. 2023 Apr 13;14(1):2114.
doi: 10.1038/s41467-023-37836-8.

Non-functional ubiquitin C-terminal hydrolase L1 drives podocyte injury through impairing proteasomes in autoimmune glomerulonephritis

Affiliations

Non-functional ubiquitin C-terminal hydrolase L1 drives podocyte injury through impairing proteasomes in autoimmune glomerulonephritis

Julia Reichelt et al. Nat Commun. .

Erratum in

Abstract

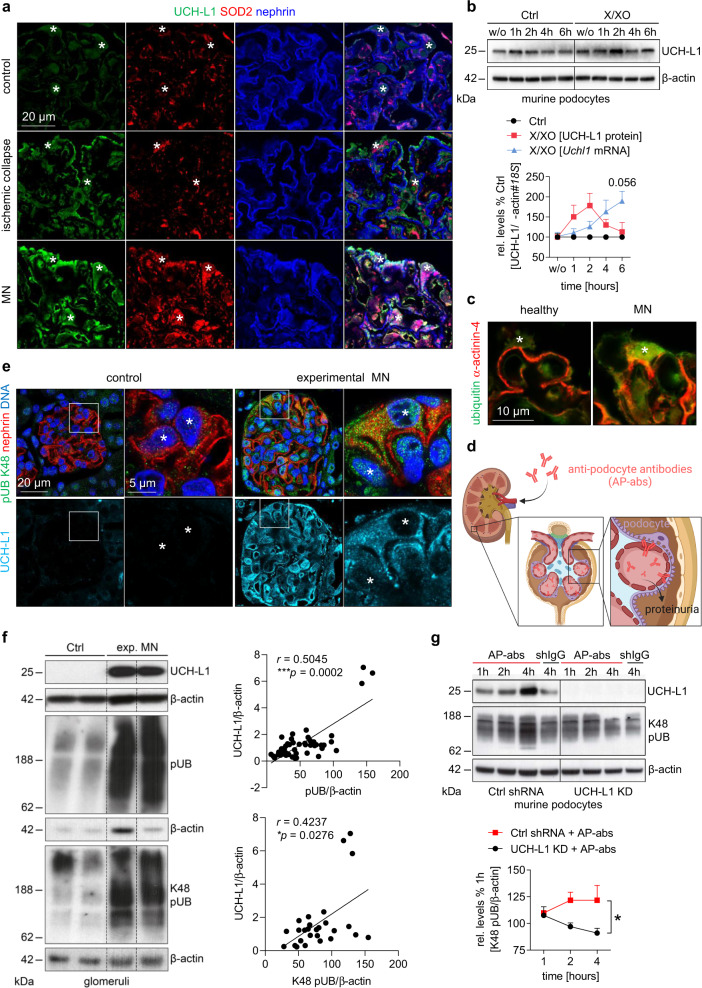
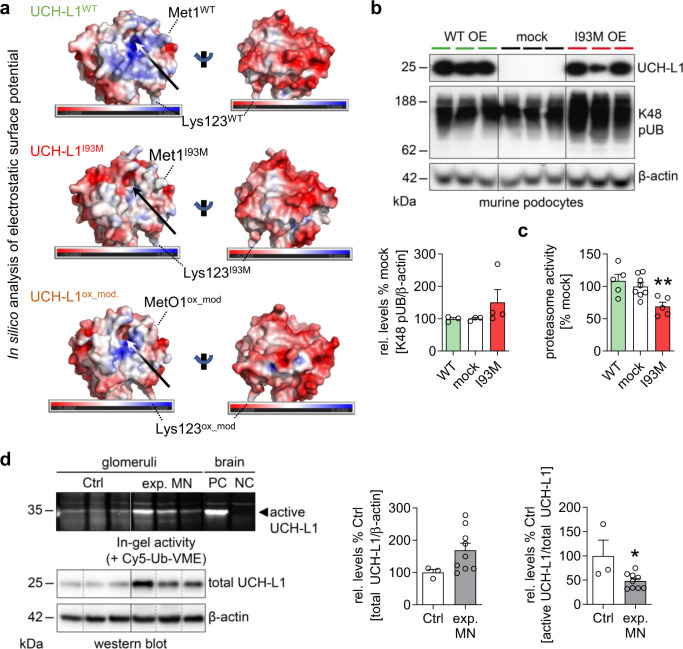
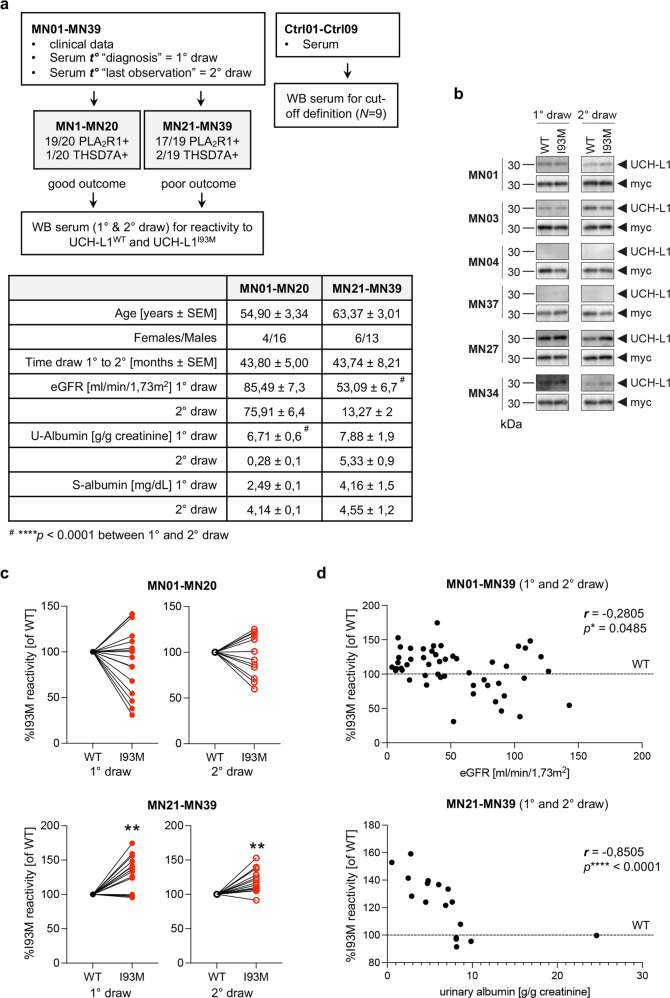
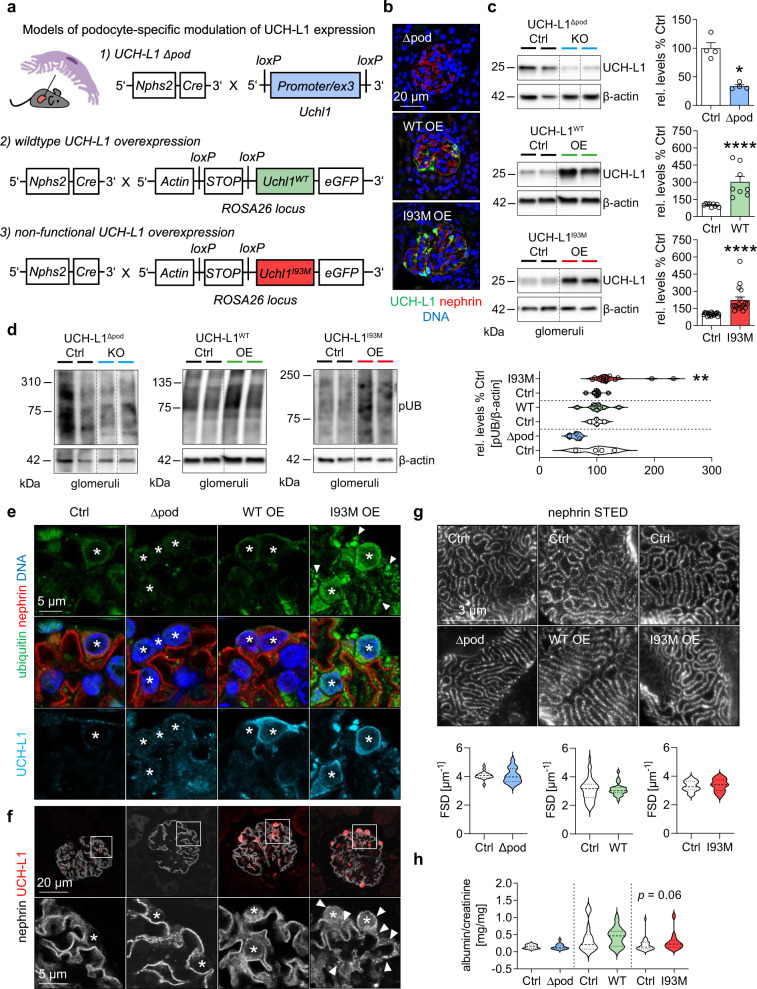
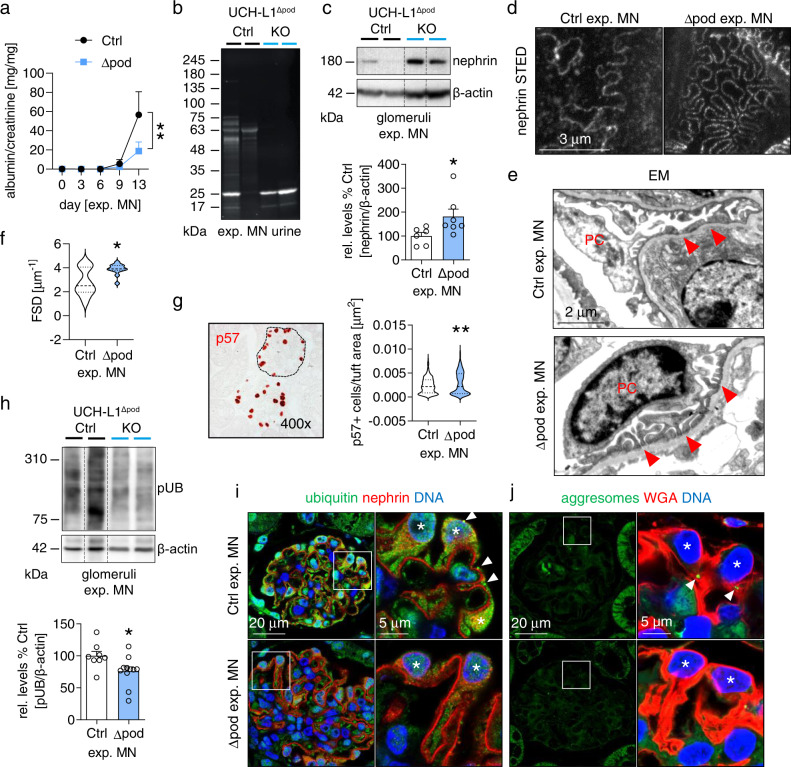
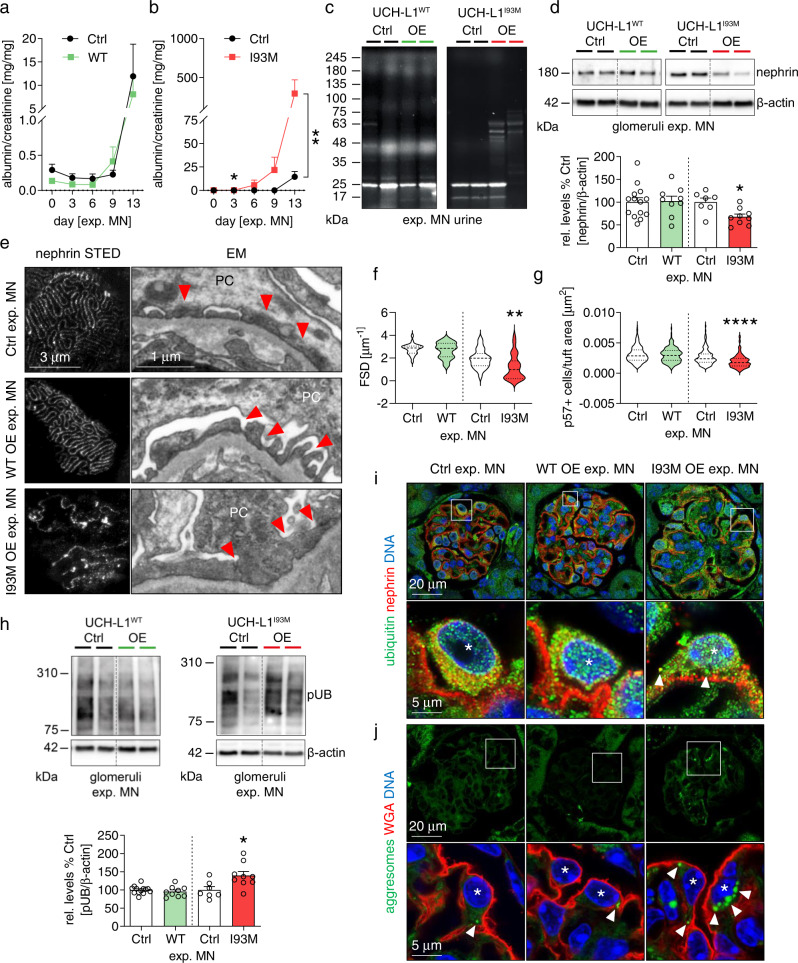
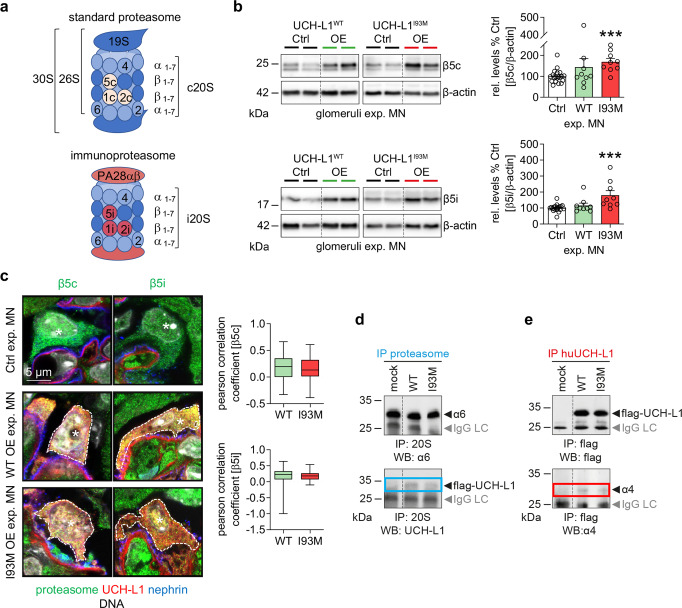
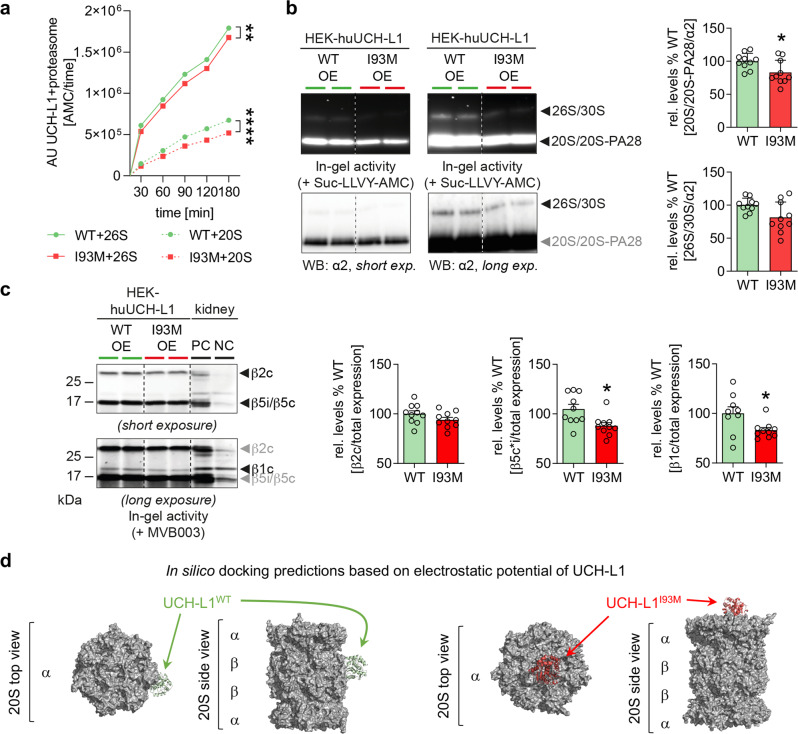
Little is known about the mechanistic significance of the ubiquitin proteasome system (UPS) in a kidney autoimmune environment. In membranous nephropathy (MN), autoantibodies target podocytes of the glomerular filter resulting in proteinuria. Converging biochemical, structural, mouse pathomechanistic, and clinical information we report that the deubiquitinase Ubiquitin C-terminal hydrolase L1 (UCH-L1) is induced by oxidative stress in podocytes and is directly involved in proteasome substrate accumulation. Mechanistically, this toxic gain-of-function is mediated by non-functional UCH-L1, which interacts with and thereby impairs proteasomes. In experimental MN, UCH-L1 becomes non-functional and MN patients with poor outcome exhibit autoantibodies with preferential reactivity to non-functional UCH-L1. Podocyte-specific deletion of UCH-L1 protects from experimental MN, whereas overexpression of non-functional UCH-L1 impairs podocyte proteostasis and drives injury in mice. In conclusion, the UPS is pathomechanistically linked to podocyte disease by aberrant proteasomal interactions of non-functional UCH-L1.


Conflict of interest statement

The authors declare no competing interests.

Figures

Fig. 1
Fig. 1. Oxidative stress leads to UCH-L1 upregulation, which induces ubiquitin accumulations in injured podocytes.
a Confocal analyses of 2 independent experiments with n = 3 exhibiting de novo UCH-L1 expression (green) correlating with enhanced SOD2 scavenger protein levels (red) in podocytes (asterisks) in renal patient biopsies with ischemic glomerular collapse or membranous nephropathy (MN). Nephrin (blue) demarcates the glomerular filtration barrier. b To induce oxidative stress podocytes were treated without (w/o) as well as for 1, 2, 4 and 6 hours with 150 µM xanthine (X) and 200 mU xanthine oxidase (XO) or equal volume of NaOH and K2HPO4 (Ctrl). Relative UCH-L1 protein (red line) and transcript (blue line) abundance in comparison to respective controls (Ctrl, black line) assessed by immunoblot normalized to β-actin or via qPCR normalized to 18S. Pooled values of 4 independent experiments with n = 1, mean + /-SEM, Two-Way ANOVA with Geisser-Greenhouse correction. c Confocal images of 2 independent experiments with n = 3 illustrate ubiquitinated protein accumulations (green) in aggrieved podocytes (asterisk) in a renal MN biopsy. α-actinin-4 (red) marks podocytes. d Mouse model of experimental MN is induced by injection of sheep anti-podocyte antibodies (AP-abs), which lead to podocyte injury and proteinuria by binding podocyte foot-process antigens (created with BioRender.com). e Experimental MN was initiated by i.v. injection of AP-abs or sheep IgG (shIgG, control) in mice. Kidneys were collected on day 14. Confocal images of 2 independent experiments with n = 3 show K48-polyubiquitinated protein aggregation (green) in UCH-L1-expressing podocytes (turquoise). Asterisks = podocyte nuclei, nephrin (red), DNA (Hoechst, blue). f Glomerular immunoblot quantification of UCH-L1 and (K48-) polyubiquitinated proteins (pUB) normalized to β-actin. Graphs show Spearman´s correlation (two-tailed) between UCH-L1 and (K48-) polyubiquitinated proteins. Pooled values of 4 (K48 pUB) or 6 (pUB) independent experiments with n = 27 (K48 pUB) or n = 49 (pUB). g ShRNA-mediated knockdown (KD) of UCH-L1 in podocytes prevents K48-polyubiquitinated protein accumulation after exposure to AP-abs for 1, 2 and 4 hours contrary to scrambled shRNA transduced podocytes (Ctrl shRNA). Pooled values of 3 independent experiments with n = 1, mean + /-SEM, *p = 0.0301, Two-Way ANOVA with Geisser-Greenhouse correction. Source data are provided as a Source Data file.
Fig. 2
Fig. 2. UCH-L1 is modified in experimental MN.
a Calculated electrostatic surface potential of the crystal structures of UCH-L1 wildtype (PDB: 2ETL, UCH-L1WT), and its I93M (PDB:3IRT, UCH-L1I93M) variant and of the predicted crystal structure of an oxidative-modified variant (UCH-L1ox_mod) in two orientations in surface representation. Surface is colored according to the electrostatic surface potential, using a ramp from −5kT/e to +5kT/e at which the surface colors are clamped at red for a negative or blue for a positive electrostatic potential, visualized by a slider. Location of the amino acid residues Lys123 and Met1 in UCH-L1WT and UCH-L1I93M or methionine sulfoxide MetO1 in UCH-L1ox_mod are indicated. While the surface of the active site entrance (arrows) in the oxidative-modified variant is less positively charged compared to the wildtype (upper panel), the dorsal side of the oxidative-modified variant shows positive surface charge which is missing in the wildtype (lower panel). b, c Doxycycline-induced overexpression of I93M-UCH-L1 or WT-UCH-L1 in murine podocytes. b K48 pUB levels were determined by immunoblot and normalized to β-actin, n = 3 (WT&mock) or n = 4 (I93M) of 2 independent experiments, mean + /-SEM, two-tailed Mann Whitney U test. c Examination of the main proteasomal chymotrypsin-like activity by measurement of Suc-LLVY-AMC peptide hydrolysis, n = 5 (WT&I93M) or n = 8 (mock) of 2 independent experiments, mean + /-SEM, **p = 0.0062, two-tailed Mann Whitney U test. d Experimental MN was initiated by i.v. injection of AP-abs or sheep IgG (Ctrl) in mice. Kidneys were collected on day 14. Glomerular enzymatic in-gel activity of UCH-L1 was measured using a ubiquitin-based activity probe (Cy5-Ub-VME), which irreversibly binds to the catalytic center of active deubiquitinating enzymes. Brain lysates of Uchl1-/- mice were used as negative control (NC), of Uchl1+/+ mice as positive control (PC). Levels of active UCH-L1 were quantified by measuring in-gel fluorescence of labeled probe at 35 kDa subsequently normalized to respective total UCH-L1 protein levels (normalized to β-actin of the same membrane). Values are presented as mean + /-SEM, n = 3 (Ctrl) or n = 9 (exp. MN) of 1 experiment, *p = 0.0364, two-tailed Mann Whitney U test. Source data are provided as a Source Data file.
Fig. 3
Fig. 3. Patients with nephrotic syndrome exhibit autoantibodies with preferential affinity to non-functional UCH-L1 protein.
a Characteristics of the membranous nephropathy patient cohort analyzed; = timepoint, MN = membranous nephropathy, WB = Western blot. The table summarizes clinical baseline characteristics of the cohort; ****p < 0.0001 between the first and second serum draw within one group, One Way ANOVA with Tukey’s multiple comparisons test. b Selected WB of patient sera diluted 1:50 to purified human UCH-L1WT and UCH-L1I93M protein and corresponding myc detection of the same membrane to control for UCH-L1 protein loading. MN01 & MN03 depict an equal/reduced reactivity to UCH-L1I93M compared to UCH-L1WT; MN04 & MN37 are sero-negative for anti-UCH-L1 antibodies; MN27 & MN34 exhibit an enhanced reactivity to UCH-L1I93M compared to UCH-L1WT. c Individual sera reactivity to UCH-L1I93M was calculated in comparison to reactivity to UCH-L1WT (set at 100%) of the same membrane. Preferential reactivity to UCH-L1I93M was observed in MN patients with poor outcome at the 1° and 2° draw; values from n = 16 (MN01-MN20) or n = 14 (MN21-MN39) patients, **p = 0.0052 (1° draw), **p = 0.0012 (2° draw), two-tailed Wilcoxon test. d Correlation of % reactivity to UCH-L1I93M in comparison to UCH-L1WT (100%, dotted line) at the time of 1° and 2° draw to clinical parameters of the time-matched sera. Reactivity to UCH-L1I93M inversely correlates to eGFR in MN patients (upper graph) and to urinary albumin abundance in MN patients with poor outcome (lower graph); Spearman´s correlation (two-tailed). Source data are provided as a Source Data file.
Fig. 4
Fig. 4. Transgenic overexpression of non-functional I93M-UCH-L1 protein leads to ubiquitin aggregation in podocytes.
a Scheme of the transgenic mouse models of modified UCH-L1 expression in podocytes (created with BioRender.com). Naive mice were subsequently analyzed: b Confocal images from 2 independent experiments with n = 3 verifies podocyte UCH-L1 knockout/overexpression (green). Nephrin (red) depicts the glomerular filtration barrier, DNA (Hoechst, blue). c Glomerular immunoblot quantification of UCH-L1. Graph shows relative UCH-L1 abundance (normalized to β-actin) to respective littermate controls (Ctrl). Pooled values of 7 independent experiments, mean + /-SEM, n = 4 Ctrl or Δpod, n ≤ 9 WT (n = 9 Ctrl, n = 8 WT OE) or n ≤ 19 I93M (n = 19 Ctrl, n = 17 I93M OE), *p = 0.0286, ****p < 0.0001, two-tailed Mann Whitney U test. The faint UCH-L1 band in UCH-L1Δpod, arises from glomerular endothelial UCH-L1 expression. d Immunoblot quantification of glomerular polyubiquitinated proteins (pUB). Graph shows relative ubiquitin abundance (normalized to β-actin) to respective littermate controls (Ctrl). Pooled values of 7 independent experiments, mean + /-SEM, n ≤ 4 Δpod (n = 4 Ctrl, n = 3 Δpod), n ≤ 8 WT (n = 4 Ctrl, n = 8 WT OE) or n ≤ 15 I93M (n = 11 Ctrl, n = 15 I93M OE), **p = 0.003, two-tailed Mann Whitney U test. e Representative staining from 2 independent experiments with n = 3 of ubiquitinated proteins (green) in relation to UCH-L1 expression (turquoise), nephrin (red), DNA (Hoechst, blue), asterisks = podocyte nuclei, arrowheads = granular ubiquitin accumulations. f Confocal analyses of 2 independent experiments with n = 3 for nephrin (white) and UCH-L1 (red) demonstrates granular nephrin pattern (arrowheads) in UCH-L1I93M overexpressing podocytes, asterisks = podocytes. g STED analyses of nephrin meanders to quantify filtration slit density (FSD) length per area (µm−1). Graphs depict pooled values of 2 independent experiments, mean + /-SEM, n ≤ 19 Δpod (n = 19 Ctrl, n = 14 Δpod), n ≤ 21 WT (n = 15 Ctrl, n = 21 WT OE) or n ≤ 31 I93M (n = 31 Ctrl, n = 23 I93M OE), two-tailed Unpaired t-test. h Urinary albumin to creatinine ratio. Pooled values of 15 independent experiments, mean + /-SEM, n ≤ 17 Δpod (n = 13 Ctrl, n = 17 Δpod), n ≤ 20 WT (n = 14 Ctrl, n = 20 WT OE) or n ≤ 30 I93M (n = 30 Ctrl, n = 25 I93M OE), two-tailed Mann Whitney U test. Source data are provided as a Source Data file.
Fig. 5
Fig. 5. Podocyte-specific UCH-L1 deletion attenuates ubiquitin accumulations and podocyte injury in experimental MN.
Experimental MN was induced by i.v. injection of AP-abs in UCH-L1-deficient (Δpod) and littermate (Ctrl) mice. Kidneys were collected on day 14. a Urinary albumin to creatinine ratio. Pooled values of 6 independent experiments, mean + /-SEM, per time n ≤ 15 (Ctrl) or n ≤ 18 (Δpod), **p = 0.0022, Two-Way ANOVA. b Stainfree SDS-PAGE from 1 experiment of creatinine-adapted urines depicts loss of high molecular weight proteins in Ctrl mice, albumin ~63 kDa. c Immunoblot quantification of glomerular nephrin abundance normalized to β-actin. Pooled values of 2 independent experiments, mean + /-SEM, n = 6 (Ctrl) or n = 7 (Δpod), *p = 0.014, two-tailed Mann Whitney U test. d STED analyses of nephrin meanders. e Electron microscopy (EM) demonstrates effaced foot processes in Ctrl and mostly preserved foot processes in Δpod mice, PC = podocyte, red arrowheads = foot processes. f Quantification of foot process effacement by PEMP analyses of filtration slit density (FSD) length per area (µm−1), pooled values of 1 experiment, mean + /-SEM, n = 15 (Ctrl) or n = 12 (Δpod), *p = 0.0321, two-tailed Mann Whitney U test. g Podocyte number per glomerular tuft area assessed by staining for p57 (podocyte marker). Pooled values of 3 independent experiments, mean + /-SEM, n = 271 (Ctrl) or n = 332 (Δpod) glomeruli, **p = 0.0014, two-tailed Unpaired t-test. h Glomerular immunoblots for polyubiquitinated proteins (pUB) normalized to β-actin. Pooled values of 3 independent experiments, mean + /-SEM, n = 8 (Ctrl) or n = 11 (Δpod), *p = 0.0328, two-tailed Mann Whitney U test. i Representative confocal images of 2 independent experiments with n = 3 showing enhanced signal for ubiquitinated proteins (green) in Ctrl podocytes with occasional ubiquitin aggregates (arrowheads). Nephrin (red) was used to depict the glomerular filtration barrier and DNA was stained with Hoechst (blue). Podocytes are marked by asterisks. j Representative confocal images of 2 independent experiments with n = 3 showing inclusion bodies (aggresomes, marked by arrowheads) in Ctrl podocytes. Wheat germ agglutinin (WGA, red) was used to highlight the podocyte plasma membrane. DNA was stained with Hoechst (blue). Asterisks demarcate podocytes. Source data are provided as a Source Data file.
Fig. 6
Fig. 6. Overexpression of non-functional I93M-UCH-L1 perpetuates podocyte injury and ubiquitin accumulations in experimental MN.
Experimental MN was induced in UCH-L1 overexpressing (WT OE and I93M OE) and respective littermate (Ctrl) mice. Kidneys were collected on day 14. a, b Urinary albumin to creatinine ratio, pooled values of 5 independent experiments (WT-UCH-L1, n ≤ 18 Ctrl or n ≤ 15 OE, per time) or of 2 independent experiments (I93M-UCH-L1, n ≤ 9 Ctrl or n = 10 OE, per time), mean + /-SEM, *p = 0.0434, **p = 0.0062, two-tailed Mann Whitney U test. c Stainfree SDS-PAGE from 1 experiment of creatinine-adapted urines depicts loss of high molecular weight proteins in I93M OE mice, albumin ~63 kDa. d Glomerular quantification of relative nephrin abundance (normalized to β-actin) to Ctrl. Pooled values of 4 independent experiments (WT-UCH-L1, n = 14 Ctrl or n = 9 WT OE) or of 3 independent experiments (I93M-UCH-L1, n = 7 Ctrl or n = 9 I93M OE), mean + /-SEM, *p = 0.0115, two-tailed Mann Whitney U test. e Left: STED analyses of nephrin meanders. Right: electron microscopy (EM) of glomerular filtration barrier integrity, arrowheads = foot processes, PC = podocyte. f Quantification of foot process effacement by PEMP analyses of filtration slit density (FSD) length per area (µm−1). Pooled values of 1 experiment (WT-UCH-L1, n = 24 Ctrl or n = 36 WT OE; I93M-UCH-L1, n = 23 Ctrl or n = 35 I93M OE), mean + /-SEM, **p = 0.0041, two-tailed Mann Whitney U test. g Quantification of podocyte loss by counting p57+ podocytes per glomerular tuft area. Pooled values of 2 independent experiments (WT-UCH-L1, n = 350 Ctrl or n = 198 WT OE) or of 1 experiment (I93M-UCH-L1, n = 150 Ctrl or n = 128 I93M OE) as mean + /-SEM, ****p < 0.0001, two-tailed Unpaired t-test. h Quantification of glomerular polyubiquitinated (pUB) proteins normalized to β-actin relative to Ctrl. Pooled values of 4 independent experiments (WT-UCH-L1, n = 13 Ctrl or n = 9 WT OE) or of 2 independent experiments (I93M-UCH-L1, n = 7 Ctrl or n = 9 I93M OE) are shown as mean + /-SEM, *p = 0.0164, two-tailed Mann Whitney U test. Confocal images from 2 independent experiments with n = 3 of (i) ubiquitinated proteins (green) in podocytes. Arrowheads = ubiquitin aggregates, nephrin (red) depicts the glomerular filtration barrier or of (j) inclusion bodies, aggresomes = arrowheads), wheat germ agglutinin (WGA, red) highlights the podocyte plasma membrane. Podocytes = asterisks, DNA (Hoechst, blue). Source data are provided as a Source Data file.
Fig. 7
Fig. 7. UCH-L1 interacts with the proteasome.
a Scheme of the standard proteasome (proteolytic subunits β1c, β2c and β5c) and of the immunoproteasome (proteolytic subunits β1i, β2i and β5i). b, c Experimental MN was induced by i.v. injection of sheep anti-murine podocyte antibodies (AP-abs) in UCH-L1 overexpressing (WT OE and I93M OE, respectively) and their littermate (Ctrl) mice. Kidneys were collected on day 14. b Glomerular immunoblot analyses of main (β5c and β5i) proteasomal subunit abundance normalized to β-actin. Pooled values of 4 independent experiments (WT-UCH-L1, n = 20 Ctrl or n = 9 WT OE) or of 2 independent experiments (I93M-UCH-L1, n = 20 Ctrl or n = 9 I93M OE) for each subunit are shown as mean + /-SEM, ***p = 0.0004 (β5c), ***p = 0.0002 (β5i), two-tailed Mann Whitney U test. c Confocal images showing co-localization of respective proteolytic proteins (green) with UCH-L1 (red) in podocytes (marked by asterisks). Nephrin (blue) was used to depict the glomerular filtration barrier and DNA was stained with Hoechst (grey). Graphs: semiquantitative analysis of spatial proximity of β5c and β5i with UCH-L1 in selected podocytes (yellow overlay in framed area), respectively; strength of positive (0 to +1) or negative (0 to −1) linear relationship represented by Pearson correlation coefficient. The box illustrates the interquartile range (IQR), median line and whiskers including the lowest and highest values within ±1.5 × IQR and above. Values consist of n = 3 (WT-UCH-L1 or I93M-UCH-L1), two-tailed Unpaired t-test. d, e Interaction studies of UCH-L1 with the proteasome by using HEK293T cells transiently transfected with human (hu) wildtype UCH-L1-flag (WT-UCH-L1) and hu-I93M-UCH-L1-flag (I93M-UCH-L1) protein. Representative immunoblot analyses of 1 experiment demonstrate interaction between UCH-L1 and the proteasome. WT-UCH-L1 and non-functional I93M-UCH-L1 protein were co-immunoprecipitated with the 20S proteasome (d, lower panel). Successful proteasome IP is shown via immunoblot to the α6 subunit (d, upper panel). Vice versa the proteasome (detected via the α4 subunit, (e, lower panel)) was co-immunoprecipitated with UCH-L1 proteins, respectively (e, upper panel). Untransfected HEK293T cells served as control. IgG LC = immunoglobulin G light chain of the capture antibody. Source data are provided as a Source Data file.
Fig. 8
Fig. 8. Non-functional protein curtails proteasomal capacity.
a Time course of in vitro chymotrypsin-like activity of 10 µg purified UCH-L1-flag constructs incubated with 5 nM purified human (hu) 20S and 26S proteasome. Fluorescence intensities of converted proteasomal substrate Suc-LLVY-AMC (60 µM) per time were determined at 355 nm and 460 nm. Values are expressed as mean + /-SEM, n = 3 (WT-UCH-L1 or I93M-UCH-L1) per subunit, **p = 0.0057, ****p < 0.0001, Two-Way ANOVA with Geisser-Greenhouse correction. b Proteasomal in-gel activity of transfected HEK293T cells overexpressing human (hu) WT-UCH-L1 and I93M-UCH-L1 constructs by measuring the turnover of the fluorogenic β5c/β5i substrate Suc-LLVY-AMC (100 µM). In-gel activity was normalized to relative proteasome abundance of the same gel assessed by subsequent immunoblot against the α2 subunit of the 20S core particle. Pooled values of 4 independent experiments, n = 10, mean + /-SEM, *p = 0.0355, two-tailed Mann Whitney U test. c Subunit-specific proteasome activity was measured in-gel using 0,5 µM of the pan-proteasomal activity based-probe MVB003 in UCH-L1 overexpressing HEK293T cells. Total kidney lysates of BALB/c wildtype mice treated with 2 µM DMSO served as positive control (PC), treatment with 2 µM epoxomicin as negative control (NC). Constitutive β1c, β2c, and β5c subunit activities were normalized to total protein abundance of associated β subunits acquired from subsequent immunoblot of the activity gel. Pooled values of 3 independent experiments, n = 10 per construct (β2c or β5c*i) and n = 9 (WT-UCH-L1) or n = 10 (I93M-UCH-L1) for β1c, mean + /-SEM, *p = 0.0107 (β5c*i), *p = 0.0258 (β1c), two-tailed Unpaired t-test. d Selected representative binding configuration of hu-WT-UCH-L1 and hu-I93M variant to the human 20S proteasome as calculated using ClusPro (https://cluspro.bu.edu). Shown are top views and side views of the 20S proteasome (PDB 5LE5) in surface representation in grey and the exemplary configurations of UCH-L1 molecules in cartoon representation shown in green (WT-UCH-L1) bound to proteasomal β subunit and in red (I93M-UCH-L1) bound to a proteasomal α subunit. The collection of all calculated biologically relevant in silico docking predictions are shown in the Supplementary Fig. 17. Source data are provided as a Source Data file.

Comment in

Similar articles

Cited by

References

    1. Pohl C, Dikic I. Cellular quality control by the ubiquitin-proteasome system and autophagy. Science. 2019;366:818–822. doi: 10.1126/science.aax3769. - DOI - PubMed
    1. Collins GA, Goldberg AL. The Logic of the 26S Proteasome. Cell. 2017;169:792–806. doi: 10.1016/j.cell.2017.04.023. - DOI - PMC - PubMed
    1. Meyer-Schwesinger C, et al. The ubiquitin proteasome system in kidney physiology and disease. Nat. Rev. Nephrol. 2019;15:393–411. doi: 10.1038/s41581-019-0148-1. - DOI - PubMed
    1. Beeken M, et al. Alterations in the ubiquitin proteasome system in persistent but not reversible proteinuric diseases. J. Am. Soc. Nephrol. 2014;25:2511–2525. doi: 10.1681/ASN.2013050522. - DOI - PMC - PubMed
    1. Tomas NM, Huber TB, Hoxha E. Perspectives in membranous nephropathy. Cell Tissue Res. 2021;385:405–422. doi: 10.1007/s00441-021-03429-4. - DOI - PMC - PubMed

Publication types

Substances