. 2023 Apr 13;13(1):6025.
doi: 10.1038/s41598-023-32571-y.

Increasing cell culture density during a developmental window prevents fated rod precursors derailment toward hybrid rod-glia cells

Affiliations

Increasing cell culture density during a developmental window prevents fated rod precursors derailment toward hybrid rod-glia cells

Ivana Barravecchia et al. Sci Rep. .

Abstract

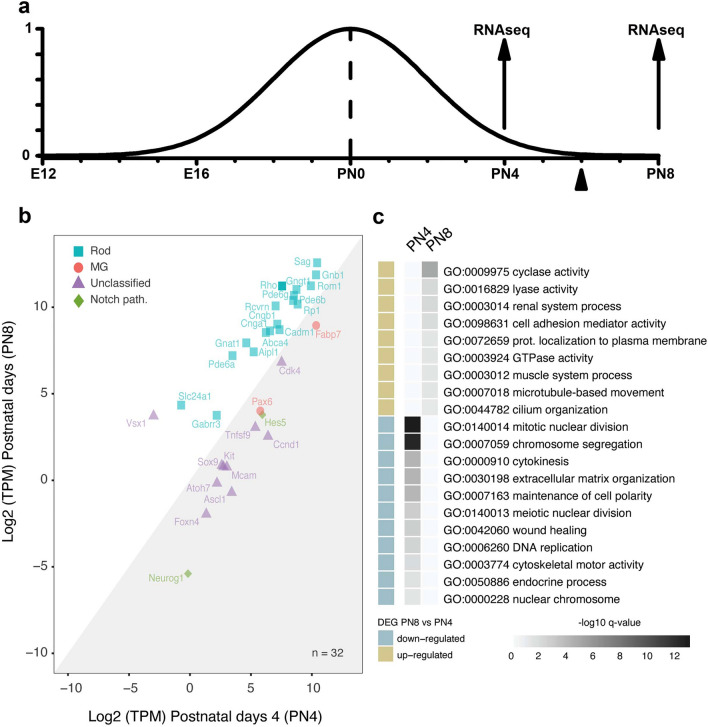
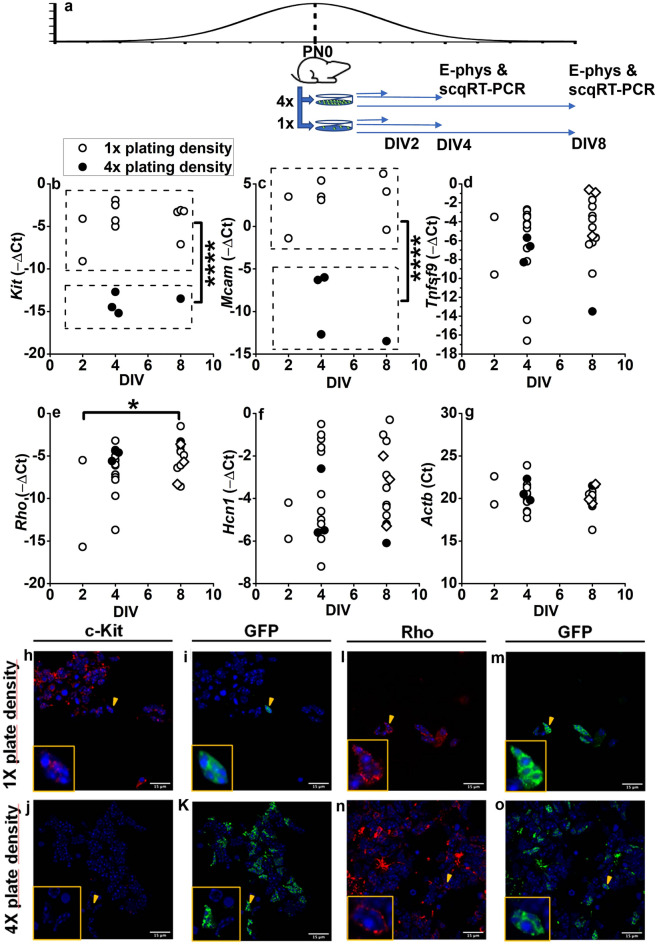
In proliferating multipotent retinal progenitors, transcription factors dynamics set the fate of postmitotic daughter cells, but postmitotic cell fate plasticity driven by extrinsic factors remains controversial. Transcriptome analysis reveals the concurrent expression by postmitotic rod precursors of genes critical for the Müller glia cell fate, which are rarely generated from terminally-dividing progenitors as a pair with rod precursors. By combining gene expression and functional characterisation in single cultured rod precursors, we identified a time-restricted window where increasing cell culture density switches off the expression of genes critical for Müller glial cells. Intriguingly, rod precursors in low cell culture density maintain the expression of genes of rod and glial cell fate and develop a mixed rod/Muller glial cells electrophysiological fingerprint, revealing rods derailment toward a hybrid rod-glial phenotype. The notion of cell culture density as an extrinsic factor critical for preventing rod-fated cells diversion toward a hybrid cell state may explain the occurrence of hybrid rod/MG cells in the adult retina and provide a strategy to improve engraftment yield in regenerative approaches to retinal degenerative disease by stabilising the fate of grafted rod precursors.


Conflict of interest statement

The authors declare no competing interests.

Figures

Figure 1
Figure 1
Transcriptome comparison of PN4 and PN8 Nrl:GFP+ rod precursors. (a) Schematic drawing of the time course of mouse rod precursors generation. The Y-axis plots the rate of rod precursor generation in arbitrary units. Precursors appear around embryonic day 13 (E13), the rate of generation peaks around the day of birth (PN0), and the process ends around postnatal day 6 (PN6). The arrowhead indicates the time of transcriptional shift in rod precursors. Arrows at PN4 and PN8 indicate the time of GFP+ rod precursors sorting for the evaluation of transcriptional changes by RNAseq analysis. (b) Scatter plot of log2 Transcripts per Million reads (TPM) at PN8 vs Log2 (TPM) at PN4. Each gene is plotted with X and Y coordinates representing normalized expression at PN4 and PN8, respectively. (c) Heatmap representing statistically significant GO over-represented classes associated with differentially expressed genes (fold change > |1.5| and false discovery rate = 0.05).
Figure 2
Figure 2
Confocal immunofluorescence imaging of c-Kit and Rho in PN4 and PN8 NRL-GFP+ retina. (af) Immunostaining for c-Kit at PN4 (a) and PN8 (d). GFP expression at PN4 (b) and PN8 (e). Merged images at PN4 (c) and PN8 (f). Insets in panels (a) and (b) show a magnification of GFP+ cell labelling positive for c-Kit. (gl) Rho immunostaining at PN4 (g) and PN8 (j). GFP signal at PN4 (h) and PN8 (k). Merged images at PN4 (i) and PN8 (l). The calibration bar corresponds to 37 µm.
Figure 3
Figure 3
Functional properties of cultured rod precursors. (a) The Y-axis plots the rod precursor generation rate in arbitrary units. The scheme illustrates the generation of retinal cultures at 1 × and 4 × cell densities from PN0 mice. Horizontal arrows indicate the use of DIV2, DIV4, DIV6, and DIV8 cultures for patch-clamp recordings (E-phys). (bd) Sweeps plot membrane currents activated in response to 2 s-long voltage steps at − 60, − 80, − 100, and − 120 mV from a holding voltage of − 40 mV in GFP+ cells isolated on the day of birth (PN0) and recorded after 2 (PN0/DIV2) (b), 4 (PN0/DIV4) (c), 6 (PN0/DIV6) (d) and 8 (PN0/DIV8) (e) days in vitro (DIV). (f) Protocol for measuring the Cs-sensitive current (IHYP) at steady-state (see “Materials and methods”). The double arrows line indicates the current activated by membrane hyperpolarisation (IHYP), computed by the difference between current amplitudes in saline with either 30 mM KCl or 30 mM KCl + 3 mM CsCl. (g) Filled symbols plot membrane conductance (GHYP) values generated by diving IHYP for the driving force (see “Materials and methods”). GHYP is plotted, after normalisation to membrane capacitance, as a function of activating voltage. The continuous line plots the best-fitting Boltzmann function used to estimate activation parameters (see “Materials and methods”) for the PN0/DIV4 cell above. (hj) Symbols plot parameters generated by best-fits to individual cells voltage-dependent activation curves similar to panel (f). Circles plot GHYP (h) normalised to membrane capacitance, the inverse slope factor SHYP (i), and the half-activation voltage V0.5HYP (j) for PN0/DIV2 (N = 6), PNO/DIV4 (N = 11), PN0/DIV6 (N = 6), and PN0/DIV8 (N = 13) cells cultured at 1 × (open circles); PN0/DIV4 (N = 3) and PN0/DIV8 (N = 1) cells cultured at 4 × cell density (filled circles). Two-way ANOVA indicated non-significant effects of DIV (F = 1.42953 with 3, 32 df: P = 0.25233) and cell density (F = 1.11282 with 1 and 32 df: P = 0.29937) on GHYP.
Figure 4
Figure 4
Single-cell qRT-PCR and immune-cytochemistry analysis of cell culture density impact in rod precursors. The scheme illustrates the generation of 1 × and 4 × cell culture densities from PN0 mice. Horizontal arrows indicate the time of patch-clamp recordings (E-phys) and cell collection for single-cell quantitative RT-PCR (E-phys and scqRT-PCR) from DIV2, DIV4, and DIV8 cultures; (be) circles plot − ΔCt values—(CtGene − CtActb); (see “Materials and methods”—“Single-cell real-time qRT-PCR”) for c-Kit (N = 14) (b), Mcam (N = 12) (c), Tnfsf9 (N = 29) (d), Rho (N = 29) (e) and Hcn1 (N = 29) (f) in 29 functionally-characterized single GFP+ rod precursors. (g) Ct values for the housekeeping gene Actb (N = 29). Open and filled circles plot data from cells cultured at lower (1 ×) and higher (4 ×) densities, respectively (see “Materials and methods”). Diamonds plot − ΔCt values for GFP+ cells with functional properties akin to MG (see text and Supplementary Fig. S1). *****P < 0.00001 and ***P < 0.001 for c-Kit and Mcam, respectively. Two-way ANOVA for the effects of DIV and cell density (for cell density, F = 70.55 with 1, 10 df for c-Kit and F = 45.02 with 1, 8 df for Mcam) followed by Bonferroni’s test). *P < 0.05 for the effect of DIV on Rho expression by two-way ANOVA for the effects of DIV and cell density (F = 3.96 with 2 and 22 df), followed by Bonferroni’s test for multiple comparisons indicating a significant difference (t = − 2.74594 with 2, 14 df: P = 0.03538) for ΔCt average difference between PN0/DIV2 and PN0/DIV8 cells (− 5.87 ± 2.15). (hk) c-Kit immunostaining of DIV8 cells plated at 1 × (h) and 4 × (j) cell culture density along with GFP signal (i,k). Arrowheads point to cells shown at an expanded scale in the inset. Note the lack of c-Kit staining in cells plated at 4 × density compared to the 1 × cells. (lo) Rho staining of DIV8 cells plated at 1 × (l) and 4 × (n) density along with GFP signal (m,o). Arrowheads point to cells shown at an expanded scale in the inset. Note Rho similar staining in cells plated at 4 × and 1 × cell density.
Figure 5
Figure 5
Correlation between gene expression and membrane conductance in single rod precursors. (a,b) Circles plot GHYP as a function of Hcn1 ΔCt for PN0/DIV4 (a) and PN0/DIV8 (b) GFP+ cells. Dotted lines plot best-fitting straight lines to GFP+ cultured at the lower density (open circles). (ch) Sweeps plot currents activated by hyperpolarising and depolarising voltage steps in PN0/DIV8 GFP+ cells, as indicated by numbers close to the sweeps, in saline with 30 mM KCl (c,f), in saline with 30 mM KCl + 2 mM BaCl2 (d,g), and saline with 30 mM KCl, 2 mM BaCl2 and 3 mM CsCl to block the residual Ih. (i,j) I/V curves plot membrane currents measured at the end of the 2 s-long hyperpolarization steps in 30 mM KCl (cyan circles), 30 mM KCl + 2 mM BaCl2 (blue squares), 30 mM KCl + 2 mM BaCl2 + 3 mM CsCl (orange diamonds) for the cell in (ce) (i) and in (fh) (j). (k) Circles plot the amplitude of the BaCl2-sensitive current in 6 PN0/DIV8 GFP cells cultured at the 1 × cell density. Current amplitudes have been normalised by cell membrane capacitance.
Figure 6
Figure 6
Cell culture density affects rod precursors over a restricted time window. (a) The scheme illustrates the generation of 1 × and 4 × cell culture densities from PN4 mice. Horizontal arrows indicate patch-clamp recordings and cell collection for single-cell quantitative RT-PCR (E-phys and scqRT-PCR) in DIV4 cultures; (b,c) Sweeps plot IHYP recorded from GFP+ cells isolated at PN4 and cultured up to DIV4 (PN4/DIV4) at 4 × (b) and 1 × (c) cell densities. (d) Currents recorded from a GFP+ cell isolated at PN0 and cultured up to DIV8 (PN0/DIV8) at the 1 × cell density. (eg) Symbols plot Boltzmann’s fits estimates of GHYP (maximum conductance) (e), SHYP (slope factor) (f), and V0.5HYP (half-activation voltage) (g) for PN4/DIV4 cells plated at 4 × (filled circles, N = 4) and 1 × cell density (open circles, N = 8). Inset in (f) also applies to (e) and (g). Squares plot activation parameters for PN0/DIV8 cells (N = 13) cultured at 1 × cell density. The dashed line in (g) plots the best fit to data points. One-way ANOVA indicates a borderline impact of culturing conditions on V0.5HYP (F = 3.438 with 2 and 20 df; P = 0.052). (hk) Circles plot − ΔCt values for c-Kit (h), Mcam (i), Rho (j), and Hcn1 (k) in single PN4/DIV4 GFP+ cells cultured in 4 × (filled circles, N = 5) or 1 × (open circles, N = 8) cell densities. Open squares plot − ΔCt values for PN0/DIV8 GFP+ cells cultured at 1 × density. Inset in (h) also applies to (i), (j) and (k).**P < 0.01 by one-way ANOVA for Mcam − ΔCt (F = 13.57 with 2, 10 df: P = 0.001415), followed by multiple comparisons with Bonferroni’s test for 4 × PN4/DIV4 (N = 4) vs 1 × PN0/DIV8 (N = 4) (t = 4.757, P = 0.00224); 1 × PN4/DIV4 (N = 6) vs 1 × PN0/DIV8 (N = 4) (t = 4.608, P = 0.00291); 4 × PN4/DIV4 (N = 4) vs 1 × PN4/DIV4 (N = 4) (t = 0.581, P = 1).
Figure 7
Figure 7
Low cell culture density provides permissive conditions for MG properties. (a,b) Columns plot IL-6 (a) and TNF-α (b) concentrations in culture medium collected at DIV4 and DIV8 after 24 incubation with 10 µg/ml LPS. CNTR plot pooled values from untreated wells at DIV4 and DIV8. ****P < 0.0001 and ***P < 0.001, respectively, by one-way ANOVA (F = 201.37909 with 2, 6 df: P = 3.16267 × 10–6) for (a) and (F = 39.70053 with 2, 6 df: P = 3.46788 × 10–4) for (b). Multiple comparisons with Bonferroni’s test: (a) CNTR vs LPS PN0/DIV4 t = 0.4806, P = 1; CNTR vs LPS PN0/DIV8 t = 17.61544, P = 6.44505 × 10–6; LPS PN0/DIV4 vs LPS PNO/DIV8 t = 17.13484, P = 6.29031 × 10–6. (b) CNTR vs LPS PN0/DIV4 t = 1.62042, P = 0.46881; CNTR vs LPS PN0/DIV8 t = 8.39846, P = 4.65651 × 10–4; LPS PN0/DIV4 vs LPS PNO/DIV8 t = 6.77804, P = 0.00151.

Similar articles

Cited by

References

    1. Gollisch T, Meister M. Eye smarter than scientists believed: Neural computations in circuits of the retina. Neuron. 2010;65(2):150–164. doi: 10.1016/j.neuron.2009.12.009. - DOI - PMC - PubMed
    1. Masland RH. Neuronal diversity in the retina. Curr. Opin. Neurobiol. 2001;11(4):431–436. doi: 10.1016/S0959-4388(00)00230-0. - DOI - PubMed
    1. Seung HS, Sumbul U. Neuronal cell types and connectivity: Lessons from the retina. Neuron. 2014;83(6):1262–1272. doi: 10.1016/j.neuron.2014.08.054. - DOI - PMC - PubMed
    1. Young RW. Cell differentiation in the retina of the mouse. Anat. Rec. 1985;212(2):199–205. doi: 10.1002/ar.1092120215. - DOI - PubMed
    1. Turner DL, Cepko CL. A common progenitor for neurons and glia persists in rat retina late in development. Nature. 1987;328(6126):131–136. doi: 10.1038/328131a0. - DOI - PubMed

Publication types

MeSH terms

Substances

LinkOut - more resources