. 2023 Apr 13;14(1):2108.
doi: 10.1038/s41467-023-37819-9.

Screening of Drosophila microRNA-degradation sequences reveals Argonaute1 mRNA's role in regulating miR-999

Affiliations

Screening of Drosophila microRNA-degradation sequences reveals Argonaute1 mRNA's role in regulating miR-999

Peike Sheng et al. Nat Commun. .

Abstract

MicroRNAs (miRNA) load onto AGO proteins to target mRNAs for translational repression or degradation. However, miRNA degradation can be triggered when extensively base-paired with target RNAs, which induces confirmational change of AGO and recruitment of ZSWIM8 ubiquitin ligase to mark AGO for proteasomal degradation. This target RNA-directed miRNA degradation (TDMD) mechanism appears to be evolutionarily conserved, but recent studies have focused on mammalian systems. Here, we performed AGO1-CLASH in Drosophila S2 cells, with Dora (ortholog of vertebrate ZSWIM8) knockout mediated by CRISPR-Cas9 to identify five TDMD triggers (sequences that can induce miRNA degradation). Interestingly, one trigger in the 3' UTR of AGO1 mRNA induces miR-999 degradation. CRISPR-Cas9 knockout of the AGO1 trigger in S2 cells and in Drosophila specifically elevates miR-999, with concurrent repression of the miR-999 targets. AGO1 trigger knockout flies respond poorly to hydrogen peroxide-induced stress, demonstrating the physiological importance of this TDMD event.


Conflict of interest statement

The authors declare no competing interests.

Figures
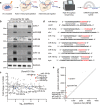
Fig. 1
Fig. 1. Identification of TDMD triggers in S2 cells by AGO1-CLASH.
a Schematic of AGO1-CLASH. Endogenous miRNAs and target RNAs are crosslinked (254 nm UV) with AGO1 and immunoprecipitated using AGO1 antibody. After AGO1-IP, the miRNAs are ligated directly to their targets to form hybrid molecules for high-throughput sequencing. Cartoons were created with BioRender.com. b Northern blot analyses of miR-7, miR-999, miR-9b, miR-9c, miR-12, miR-190, and bantam in WT, control-KO (Scramble), and Dora-KO S2 cells. The levels of bantam serve as loading control. n = 3 biological replicates. c Changes in miRNA abundance observed from CLASH between Dora-KO and control-KO S2 cell. Guide strands of the Dora-sensitive miRNAs are indicated by red dots, and the blue dots represent their passenger strands. d Base-pairing pattern of miRNAs and potential TDMD triggers. Red letters represent miRNA seed region. e The comparison of potential TDMD miRNA-target RNA hybrids in AGO1-CLASH data obtained from Dora-KO and control-KO (Scramble) S2 cells. Source data are provided as a Source Data file.
Fig. 2
Fig. 2. Evaluation of the high-confidence TDMD triggers.
a Genome browser view of trigger transcript models (blue boxes, exons; blue line, introns) with alternative isoforms and conservation plots, which are based on a 124 insects Basewise Conservation by PhyloP (phyloP124way). The transcripts are shown in the 5′ to 3′ direction. Red arrows point to the TDMD triggers. Diagramed below AGO1 transcript is the trigger site against miR-999 (in red), flanked by 15 nt on each side. The sequence logo based on six homologous sequences is shown from the indicated species. Asterisks indicate bases conserved in all of the representative examples. Tissue-specific miRNA abundance (b) and trigger transcripts abundance (c) in Drosophila from FlyAtlas 2. The gene abundance scale (log2 FPKM for genes, log2 RPM for miRNA) is shown as heatmap on the right. d Negative correlation between the miRNA abundance and trigger transcript abundance in Drosophila whole body. The linear regression is shown with solid line. r, pearson correlation coefficient. P = 0.0153 < 0.05 by two-tailed test. Source data are provided as a Source Data file.
Fig. 3
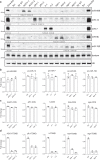
Fig. 3. TDMD triggers knockout in S2 cells increase corresponding miRNAs.
a Northern blot analyses of miR-999, miR-12, miR-7, miR-9b, miR-190, bantam, and U6 in TDMD trigger knockout of AGO1, zfh1, h, Kah, wgn, and WT, control-KO (Scramble), Dora-KO S2 cells. Total RNAs were extracted from each trigger knockout population cells selected with 5 μg/mL puromycin for 4 weeks. The levels of bantam and U6 serve as loading controls. The miRNA abundance normalized to bantam is shown below miRNA. The miRNA abundance in WT was normalized to 1. n = 3 biological replicates. RT-qPCR measurement of the levels of corresponding pri-miRNAs (b), CDS region of the trigger transcripts (c) and trigger region of the transcripts (d) in control and trigger knockout cells, normalized to Actin. Data are presented as mean ± SD. Source data are provided as a Source Data file.
Fig. 4
Fig. 4. TDMD triggers influence miRNA abundance, 3′ end extension and function.
The influence of TDMD trigger on miR-999 (a) and miR-12 (b) abundance in AGO1 and zfh1 trigger-KO cells compared to control-KO cells. miR-999 and miR-12 are indicated by red dots, as the blue dots represent their passenger strands. The fraction of small RNA-seq reads with coverage of 18-26 nucleotides (nt) for miR-999 (c) and miR-12 (d). For each miRNA, solid lines delineate the control samples, dash lines delineate the TDMD trigger-KO samples. Data are presented as mean value from two biological replicates. Repression of miR-999 (e) or miR-12 (f) targets in TDMD trigger-KO cells. Plotted are cumulative distributions of mRNA fold changes observed from TDMD trigger-KO cells, comparing the impact on all predicted miRNA targets (orange line), conserved predicted miRNA targets (red line), CLASH targets (blue line), overlap (CLASH and predicted) targets (green line) to that of non-targets (black). Log2-fold changes for each set of mRNAs are indicated. Differences between each set of predicted targets and non-targets were assessed for statistical significance using the Mann–Whitney test (two-sided) and the associated P value. Source data are provided as a Source Data file.
Fig. 5
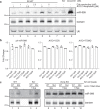
Fig. 5. Confirmation of the AGO1/miR-999 TDMD pair using morpholino oligonucleotides and a cell-free system.
a Northern blot analyses of miR-999, bantam, and U6 in S2 cells following 48 h of 1 µM, 2.5 µM, or 5 µM morpholino oligos treatment. Bantam and U6 served as loading controls. n = 3 biological replicates. b RT-qPCR analyses of pri-miR-999, AGO1-CDS and AGO1 trigger levels in control and AGO1 morpholino oligos treated cells as in (a), normalized to Actin. Data are presented as mean ± SD. n = 3 biological replicates. c Northern blot analyses of miR-999 from S2 cell lysates with the addition of in vitro transcribed WT or mutation AGO1 trigger. Bantam served as a loading control. n = 3 biological replicates. Source data are provided as a Source Data file.
Fig. 6
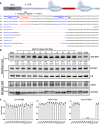
Fig. 6. Deletion of AGO1 trigger increases miR-999 in Drosophila.
a Schematic of the CRISPR-Cas9-mediated knockout of miR-999 TDMD trigger from AGO1 3′ UTR. The trigger and sgRNA sites are highlighted in red and blue, respectively. PAM sequence is underlined (green). The genotype of each mutant line is shown below. Cartoons were created with BioRender.com. b Upper panel: northern blot analyses of miR-999, bantam and U6 in controls and AGO1 trigger mutant lines. Bantam and U6 served as loading controls. The normalized miR-999 abundance (compared to bantam) are shown below each miRNA band. The miRNA abundance in control line no.1 was normalized as 1. n = 3 biological replicates. Control lines without mutation were obtained from same crossing procedure as the mutant lines. Bottom panel: western blot showing AGO1 protein level, with GAPDH as a loading control. c RT-qPCR analyses of pri-miR-999, AGO1-CDS and AGO1 trigger levels in controls and AGO1 trigger mutant lines as in (b), normalized to Actin. Data are presented as mean ± SD. n = 3 biological replicates. Source data are provided as a Source Data file.
Fig. 7
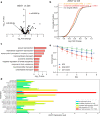
Fig. 7. AGO1 trigger-KO flies are more vulnerable to stress.
The influence of TDMD trigger on miR-999 (a) and repression of miR-999 targets (b) in AGO1 trigger KO flies. Differences between each set of predicted targets and non-targets were assessed for statistical significance using the Mann–Whitney test (two-sided) and the associated P value. P value = 8.9 × 10−5 (<0.0001) for all predicted targets compared with non-targets, and P value = 7.1 × 10−5 (<0.0001) for conserved predicted targets compared with non-targets. c DAVID identified GO term biological pathways enriched in downregulated genes in AGO1 trigger KO flies compared with control-KO flies. Unadjusted P values were determined for the GO term analysis. d The expression of AGO1 after different treatments were generated by modENCODE of FlyBase. Five-day adult male and female are included to indicate baseline AGO1 expression. e Survival rate for AGO1 trigger KO flies after hydrogen peroxide exposure compared with control-KO flies. Data are presented as mean ± SD. (∗∗) P = 0.0094 < 0.01, t test. Four independent oxidative stress experiments were conducted. In each experiment, each fly line has three vials starting with 20 male flies. Source data are provided as a Source Data file.

Similar articles

Cited by

References

    1. Bartel DP. Metazoan microRNAs. Cell. 2018;173:20–51. doi: 10.1016/j.cell.2018.03.006. - DOI - PMC - PubMed
    1. Ha M, Kim VN. Regulation of microRNA biogenesis. Nat. Rev. Mol. Cell Biol. 2014;15:509–524. doi: 10.1038/nrm3838. - DOI - PubMed
    1. Treiber T, Treiber N, Meister G. Regulation of microRNA biogenesis and its crosstalk with other cellular pathways. Nat. Rev. Mol. Cell Biol. 2019;20:5–20. doi: 10.1038/s41580-018-0059-1. - DOI - PubMed
    1. Kingston ER, Bartel DP. Global analyses of the dynamics of mammalian microRNA metabolism. Genome Res. 2019;29:1777–1790. doi: 10.1101/gr.251421.119. - DOI - PMC - PubMed
    1. Reichholf B, et al. Time-resolved small RNA sequencing unravels the molecular principles of microRNA homeostasis. Mol. Cell. 2019;75:756–768.e757. doi: 10.1016/j.molcel.2019.06.018. - DOI - PMC - PubMed

Publication types

LinkOut - more resources