. 2023 Apr 13;13(1):6021.
doi: 10.1038/s41598-023-32950-5.

Neural network based integration of assays to assess pathogenic potential

Affiliations

Neural network based integration of assays to assess pathogenic potential

Mohammed Eslami et al. Sci Rep. .

Abstract

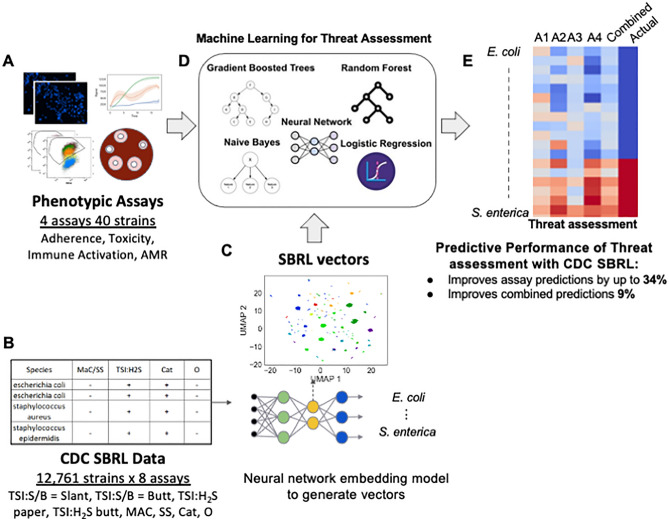
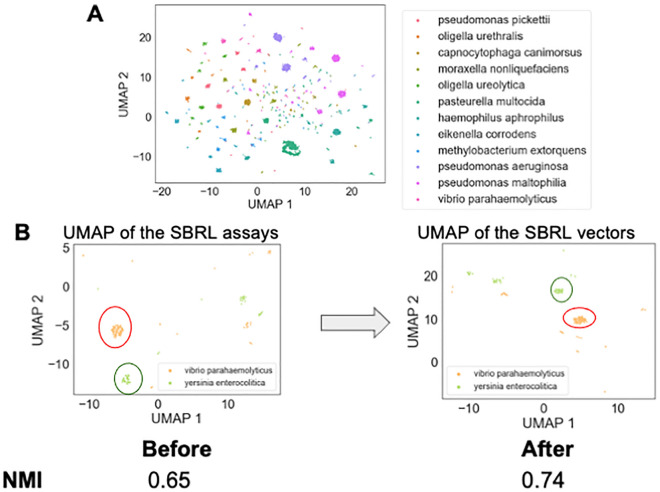
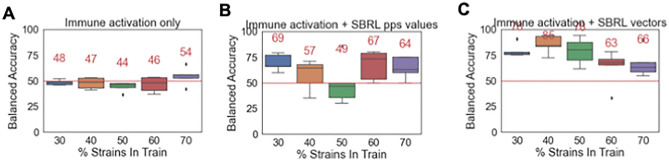
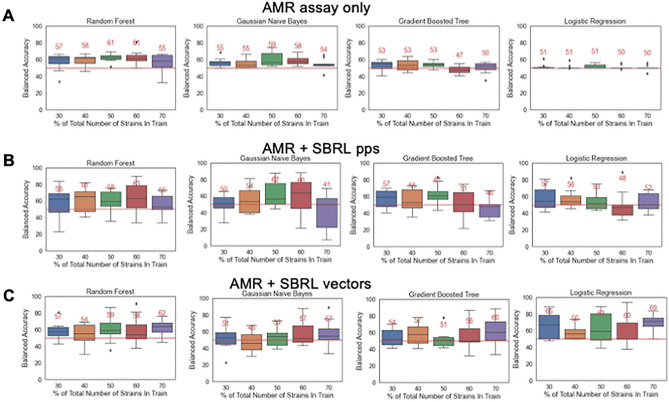
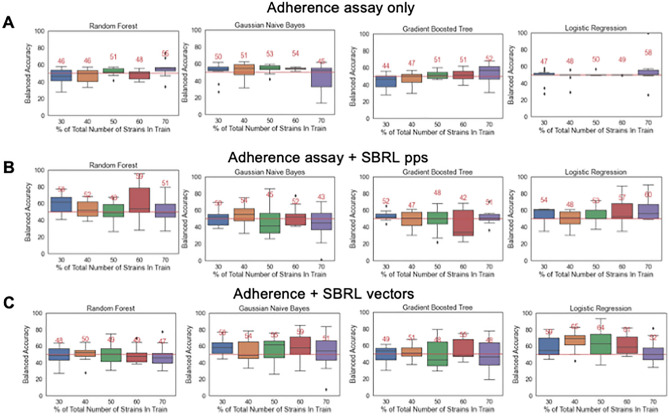
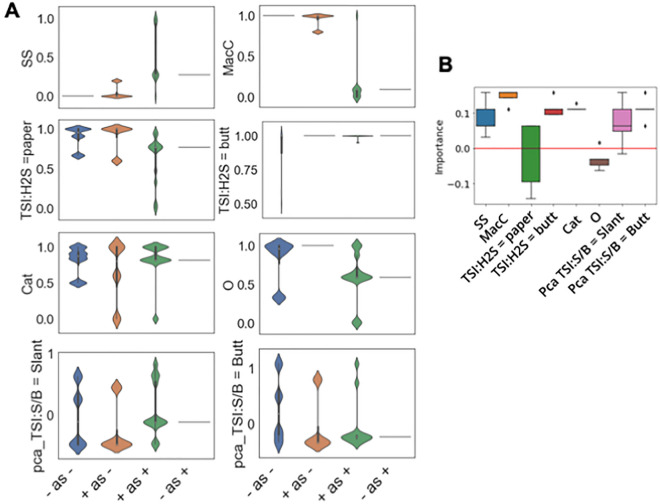
Limited data significantly hinders our capability of biothreat assessment of novel bacterial strains. Integration of data from additional sources that can provide context about the strain can address this challenge. Datasets from different sources, however, are generated with a specific objective and which makes integration challenging. Here, we developed a deep learning-based approach called the neural network embedding model (NNEM) that integrates data from conventional assays designed to classify species with new assays that interrogate hallmarks of pathogenicity for biothreat assessment. We used a dataset of metabolic characteristics from a de-identified set of known bacterial strains that the Special Bacteriology Reference Laboratory (SBRL) of the Centers for Disease Control and Prevention (CDC) has curated for use in species identification. The NNEM transformed results from SBRL assays into vectors to supplement unrelated pathogenicity assays from de-identified microbes. The enrichment resulted in a significant improvement in accuracy of 9% for biothreat. Importantly, the dataset used in our analysis is large, but noisy. Therefore, the performance of our system is expected to improve as additional types of pathogenicity assays are developed and deployed. The proposed NNEM strategy thus provides a generalizable framework for enrichment of datasets with previously collected assays indicative of species.


Conflict of interest statement

The authors declare no competing interests.

Figures

Figure 1
Figure 1
SBRL dataset of phenotypic assays for various strains cannot be easily integrated with other data. (A) Data for hallmarks of pathogenicity. (B) The CDC SBRL dataset contains additional phenotypic assays that focus on identifying bacterial strains. (C) A neural network embedding model to generate bacterial vectors at the species level so the vectors can be integrated with the pathogenicity assays. (D) Each assay integrated with the SBRL vectors are input to ML models to make predictions on bacterial pathogenicity. (E) Evaluation of pathogenic of each bacterial strain from each assay and from combining assays. Red represents a pathogen and blue represents a non-pathogen. A1–A4: predictions from each assay. Combined: statistical ensemble of A1–A4. Actual: the actual label.
Figure 2
Figure 2
Exploratory data analysis discovered that the SBRL dataset discriminate between different bacterial species. (A) 2D UMAP was performed on the SBRL assays followed by k-means clustering to provide the bacterial samples cluster labels. Every point in the plot is a bacterial sample. The points form groups in the UMAP, suggesting that the SBRL assays can aggregate similar bacteria together. The colors in the figure are the k-mean labels. (B) The neural network model pushes the samples from the same bacteria species closer together. An example output of two species, Vibrio parahaemolyticus and Yersinia enterocolitica, are shown in the UMAP before and after training to show clusters are refined by the model. We quantified how well the samples from the same species are clustered together before and after the training and found the normalized mutual information went from 0.65 to 0.74.
Figure 3
Figure 3
Incorporation of information from SBRL enhanced the predictions of pathogenic potential of the immune activation assay up to 34%. (A) Ten-fold cross validation of an ML model with an A. immune activation assay data alone, (B) the percent positive signal (pps) and (C) NNEM of SBRL data. The results went from 51%, 75%, to 85%, balanced accuracy respectively.
Figure 4
Figure 4
Incorporation of information from SBRL enhanced the predictions of pathogenic potential of the AMR assay up to 8%. (A) Ten-fold cross validation of an ML model with an A. AMR assay data alone, (B) the percent positive signal (pps) and (C) NNEM of SBRL data. The results went from 61%, 63%, to 69%, balanced accuracy respectively.
Figure 5
Figure 5
Incorporation of information from SBRL enhanced the predictions of pathogenic potential of the adherence assay up to 7%. (A) Ten-fold cross validation of an ML model with an A. adherence assay data alone, (B) the percent positive signal (pps) and (C) NNEM of SBRL data. The results went from 58%, 60%, to 65%, balanced accuracy respectively.
Figure 6
Figure 6
Comparison of threat designations of the SBRL assays based on literature and the contribution determined by the models. (A) Data-driven qualitative assessment of threat relevance of the SBRL assays based on ML predictions. Non-pathogenic strains annotated as “−” and pathogenic strains as “+”. The predictions belong to 4 groups: “− predicted to be −” , “− predicted to be +”, “+ predicted to be −” and “+ predicted to be +”. SS, MacC are the most useful assays as their “− predicted to be −” and “+ predicted to be +” groups are differentiable. (B) The quantitative measurement of the assay contribution by determining the changes in performance when each assay is dropped one by one. If an assay is dropped and the accuracy decreases, the assay gets a positive importance score and vice versa.

Similar articles

References

    1. Gomez-Cabrero D, et al. Data integration in the era of omics: Current and future challenges. BMC Syst. Biol. 2014;8(Suppl 2):I1. doi: 10.1186/1752-0509-8-S2-I1. - DOI - PMC - PubMed
    1. Yang J, et al. Phenotype-based threat assessment. Proc. Natl. Acad. Sci. U.S.A. 2022;119:e2112886119. doi: 10.1073/pnas.2112886119. - DOI - PMC - PubMed
    1. Bochner BR. Global phenotypic characterization of bacteria. FEMS Microbiol. Rev. 2009;33:191–205. doi: 10.1111/j.1574-6976.2008.00149.x. - DOI - PMC - PubMed
    1. Hwang D, et al. A data integration methodology for systems biology: Experimental verification. Proc. Natl. Acad. Sci. U.S.A. 2005;102:17302–17307. doi: 10.1073/pnas.0508649102. - DOI - PMC - PubMed
    1. Li P, et al. Systematic integration of experimental data and models in systems biology. BMC Bioinform. 2010;11:582. doi: 10.1186/1471-2105-11-582. - DOI - PMC - PubMed

Publication types