. 2023 Apr 13;13(1):6104.
doi: 10.1038/s41598-023-33321-w.

Synthetic symbiosis between a cyanobacterium and a ciliate toward novel chloroplast-like endosymbiosis

Affiliations

Synthetic symbiosis between a cyanobacterium and a ciliate toward novel chloroplast-like endosymbiosis

Yuki Azuma et al. Sci Rep. .

Abstract

Chloroplasts are thought to have co-evolved through endosymbiosis, after a cyanobacterial-like prokaryote was engulfed by a eukaryotic cell; however, it is impossible to observe the process toward chloroplasts. In this study, we constructed an experimental symbiosis model to observe the initial stage in the process from independent organisms to a chloroplast-like organelle. Our system of synthetic symbiosis is capable of long-term coculture of two model organisms: a cyanobacterium (Synechocystis sp. PCC6803) as a symbiont and a ciliate (Tetrahymena thermophila) as a host with endocytic ability. The experimental system was clearly defined, because we used a synthetic medium and the cultures were shaken to avoid spatial complexity. We determined the experimental conditions for sustainable coculture, by analyzing population dynamics using a mathematical model. We experimentally demonstrated that the coculture was sustainable for at least 100 generations, through serial transfers. Moreover, we found that cells isolated after the serial transfer improved the probability of coexistence of both species without extinction in re-coculture. The constructed system will be useful for understanding the initial stage of primary endosymbiosis from cyanobacteria to chloroplasts, i.e., the origin of algae and plants.


Conflict of interest statement

The authors declare no competing interests.

Figures

Figure 1
Figure 1
Growth characteristics of the cyanobacterium and ciliate cell populations in monocultures using TCM1Glc−. Blue-closed and red-open squares show the fold-changes in the cell concentration, after 3.5 days of culture of the cyanobacterium and ciliate, respectively. Each plotted data is the mean of at least 2 independent cultures, and the error bars indicate the standard deviation. Specifically, for the initial concentrations of the ciliate, 101, 101.75, 102, 102.5, 103, 103.5, and 104 cells/mL, the number of experimental replicates were 2, 4, 2, 10, 4, 3, and 3, respectively. For the initial concentrations of the cyanobacterium, 104, 105, 106, 106.5, and 107 cells/mL, the number of experimental replicates were 4, 4, 4, 15, and 3, respectively. The blue-dotted and red-dashed lines are the saturation concentrations of monocultures of the cyanobacterium in TCM1Glc− and the ciliate in TCM1, respectively, and thus having an initial concentration higher than the tested concentration is not applicable for subculture experiments like experimental evolution.
Figure 2
Figure 2
Interactions between the cyanobacterium and ciliate. (a) Representative micrographs of a ciliate cell that has taken up cyanobacterial cells. We sampled from a 26-h coculture, at initial concentrations of 104 cells/mL ciliate and 108 cells/mL cyanobacterium. Conditions of higher cell concentration were set, to easily observe the ciliates under the microscope. (i) A micrograph in bright field. (ii) A micrograph in fluorescence field. Red particles indicate autofluorescence derived from cyanobacterial chlorophyll. The orange arrow indicates the outline of the ciliate cell. The blue and green arrows indicate the cyanobacterial cells inside and outside the ciliate cell, respectively. (b) Cell population dynamics in cocultures. Blue-closed and red-open circles show the cell concentrations of the cyanobacterium and ciliate in the cocultures, respectively. Blue-closed and red-open squares indicate the cell concentrations of the cyanobacterium and the ciliate in monocultures, respectively. For the monoculture results, time courses are shown for the ciliate cell concentration in (i), to show the ciliate mortality at low concentration, while mean cell concentration at 3.5 d (the same results as in Fig. 1; for comparison) are shown (at 3.8 days in these graphs) for the other monoculture experiments, i.e., the ciliate in (ii) and the cyanobacterium in (i,ii). Black-open triangles indicate the cell concentration of the ciliate in monoculture, in which the supernatant of the monoculture of the cyanobacterium was used as the culture medium.
Figure 3
Figure 3
Direction field of the population dynamics of coculture. The red and blue arrows represent the values obtained from the experimental results and mathematical model, respectively. In each red arrow, the starting point indicates the initial cell concentration of both species in a coculture, while the ending point of the arrow indicates the cell concentration after 3.5 d. In each blue arrow, the angle shows the direction of change in the log-scale, as the vector of (dCS/dt)/CS and (dCT/dt)/CT from Eq. (1). The color of the blue arrows shows the magnitude of the vector in logarithm. The values of the model constants were obtained by fitting of the model to the experimental results, using the quasi-Newton method: specifically, the values of kS, dS, kT, dT, KM, and KI were 0.285 d–1, 5.16 × 102 d–1, 3.20 d–1, 1.50 × 103 d–1, 4.99 × 106 cells/mL, and 1.86 × 10–4, respectively. The black solid and dashed lines represent nullclines of population of the ciliate (CT = dT(CS + KM)/kTCS - KICS) and cyanobacterium (CT = kS(CS + KM)/dS), respectively. For example, the black solid line denotes the boundary between increase or decrease of the ciliate population; the ciliate population increases (decreases) when the state is to the right (left) of the line. Similarly, the black dashed line denotes the boundary between increase or decrease of the cyanobacterial population; the cyanobacterial population increases (decreases) when the state is below (above) of the line.
Figure 4
Figure 4
Serially transferred cocultures of the cyanobacterium and ciliate. (a) Family trees of the serially transferred cocultures showing the relation between parental cultures and their derivative lineages. Length of the black horizontal lines represents the duration from the start of the lineages to the end. The vertical axis is the initial cell concentration of the ciliate, but the values are not continuous. The initial concentrations within each ticks frame are the same, and the values are depicted (e.g., the initial concentration of the four lineages with red-open circles from round 1 are all 101.75 cells/mL). The longest transfer (round 41) was denoted using a star, and the cells obtained from the end of this 41st-round coculture were designated as Cyanobacterium41 and Ciliate41. The causes of the stop of the propagation were distinguished using three symbols, blue-closed circles, black crosses, and red-open circles, corresponding to the three patterns shown in (c) (i), (ii), and (iii), respectively, as described in detail in the main text. A symbol at round n indicates that its lineage experienced round n and stopped before round n + 1. (b) Growth curves of the longest lineages. (c) Growth curves of representative lineages whose propagation had been stopped by different causes. The end-points of each growth curve are indicated using arrows in (a). Blue-closed and red-open circles correspond to the growth curves for the cyanobacterium and ciliate, respectively. (i) Cyanobacterial concentration decreased due to the ciliate overgrowth. (ii) Initial cyanobacterial concentration became too low due to high-magnification dilution. (iii) The ciliate population did not grow.
Figure 5
Figure 5
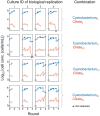
Improved sustainability through the serially transferred coculture. Growth curves of the cocultures of four possible combinations of the original (subscript 0) and evolved (subscript 41; isolated from round 41) cells of the cyanobacterium and ciliate (4 biological replicates are shown). The blue-closed and red-open circles correspond to the growth curves for the cyanobacterium and ciliate, respectively. The asterisks indicate that the ciliate was not detected.

Similar articles

Cited by

References

    1. Gavelis GS, Gile GH. How did cyanobacteria first embark on the path to becoming plastids?: Lessons from protist symbioses. FEMS Microbiol. Lett. 2018;365:209. doi: 10.1093/femsle/fny209. - DOI - PubMed
    1. Sagan L. On the origin of mitosing cells. J. Theor. Biol. 1967;14:255–274. doi: 10.1016/0022-5193(67)90079-3. - DOI - PubMed
    1. Gray MW. The evolutionary origins of organelles. Trends Genet. 1989;5:294–299. doi: 10.1016/0168-9525(89)90111-x. - DOI - PubMed
    1. Kleine T, Maier UG, Leister D. DNA transfer from organelles to the nucleus: The idiosyncratic genetics of endosymbiosis. Annu. Rev. Plant Biol. 2009;60:115–138. doi: 10.1146/annurev.arplant.043008.092119. - DOI - PubMed
    1. Raven JA, Allen JF. Genomics and chloroplast evolution: What did cyanobacteria do for plants? Genome Biol. 2003;4:209. doi: 10.1186/gb-2003-4-3-209. - DOI - PMC - PubMed

Publication types