

Identification of hub genes and immune infiltration in ulcerative colitis using bioinformatics
- PMID: 37055495
- PMCID: PMC10101977
- DOI: 10.1038/s41598-023-33292-y
Identification of hub genes and immune infiltration in ulcerative colitis using bioinformatics
Abstract
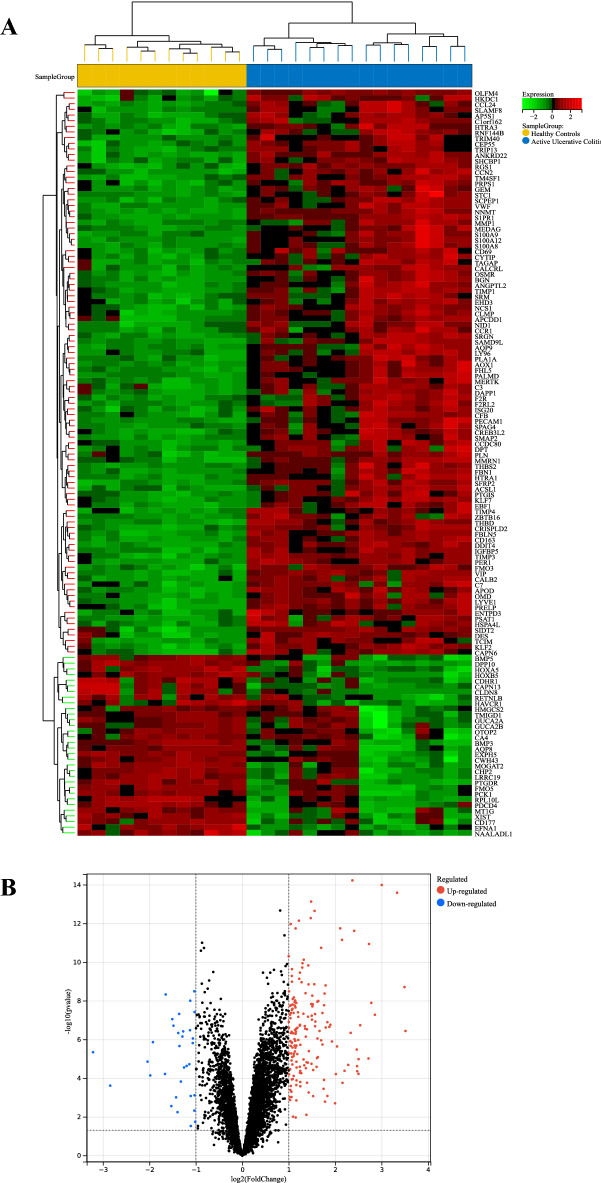
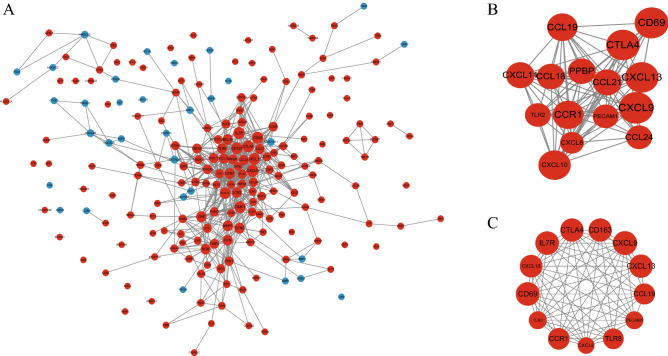
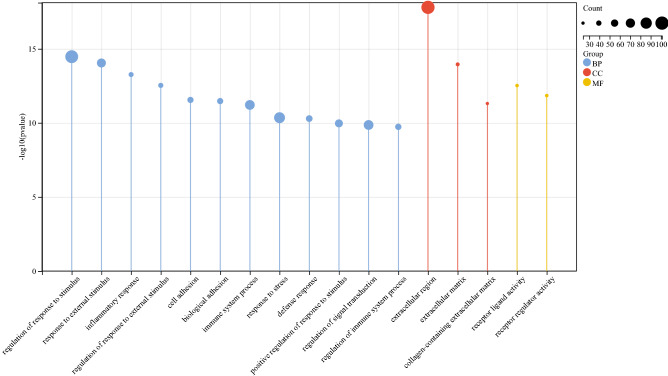
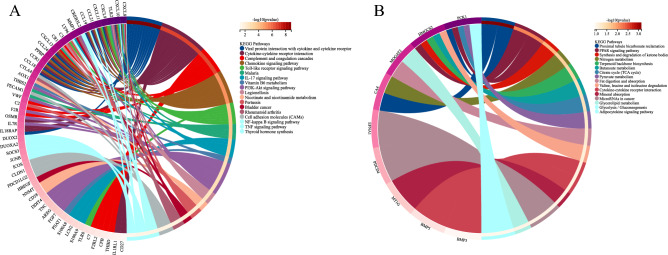
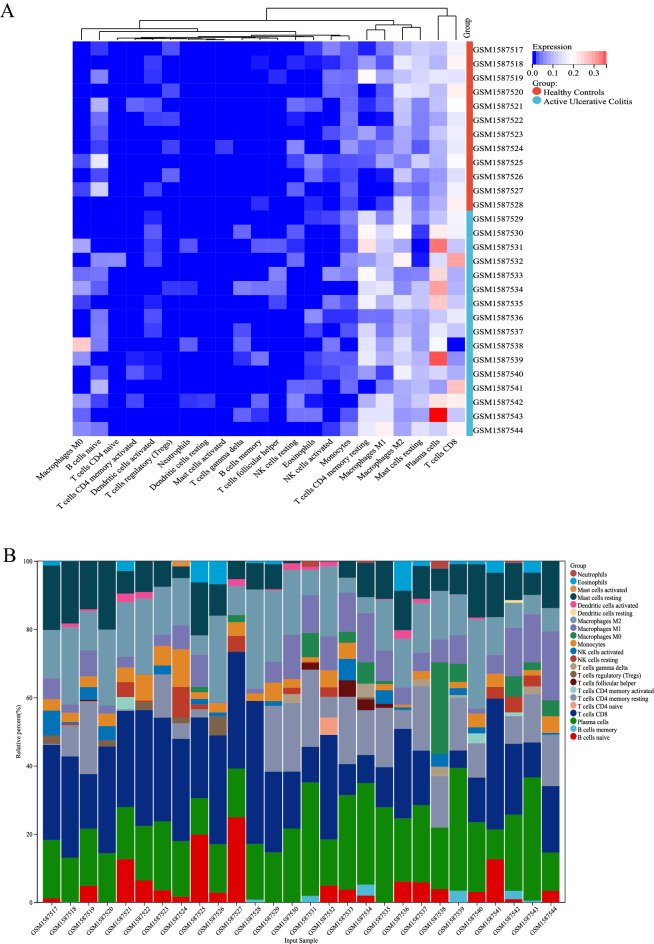
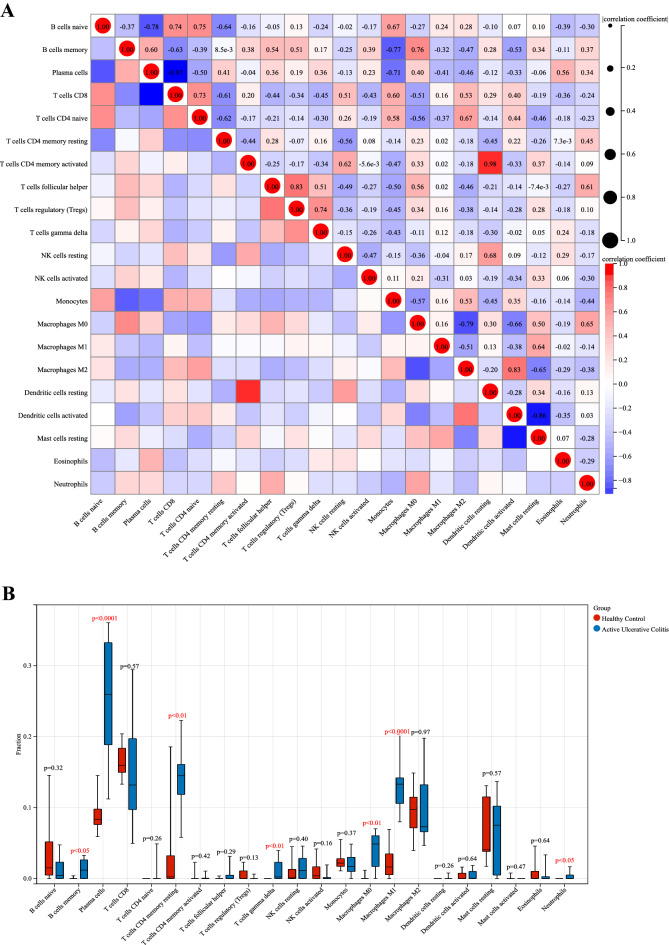
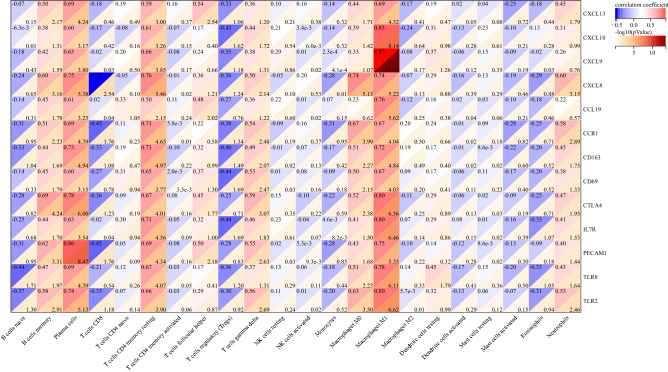
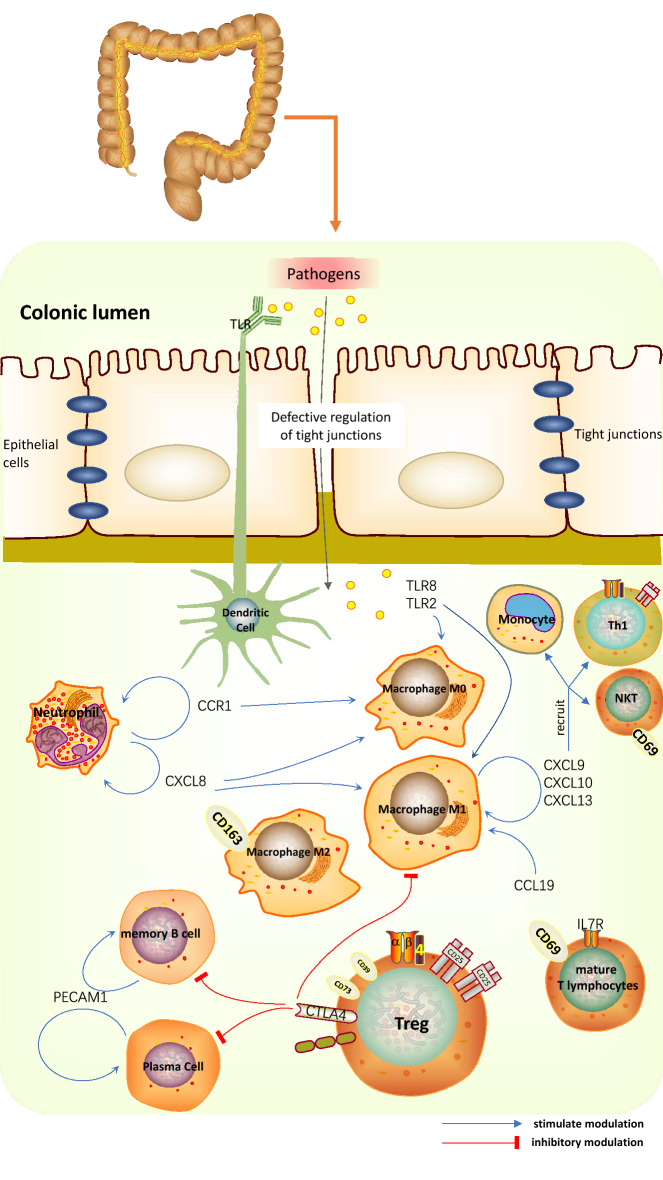
Ulcerative colitis (UC) is a chronic inflammatory disease of the intestine, whose pathogenesis is not fully understood. Given that immune infiltration plays a key role in UC progression, our study aimed to assess the level of immune cells in UC intestinal mucosal tissues and identify potential immune-related genes. The GSE65114 UC dataset was downloaded from the Gene Expression Omnibus database. Differentially expressed genes (DEGs) between healthy and UC tissues were identified using the "limma" package in R, while their Gene Ontology (GO) and Kyoto Encyclopedia of Genes and Genomes (KEGG) pathways were determined with the clusterProfiler package. Protein-protein interaction network analysis and visualization were performed with STRING and Cytoscape. Immune cell infiltration was calculated with CIBERSORT. The relationship between hub genes and immune-infiltrated cells in UC was determined by Pearson correlation. A total of 206 DEGs were identified, of which 174 were upregulated and 32 downregulated. GO and KEGG functional classification indicated DEG enrichment in immune response pathways, including Toll-like receptor signaling, IL-17 signaling, and immune system process and chemokine signaling. 13 hub genes were identified. Infiltration matrix analysis of immune cells showed abundant plasma cells, memory B cells, resting CD4 memory T cells, γδ T cells, M0 and M1 macrophages, and neutrophils in UC intestinal tissues. Correlation analysis revealed 13 hub genes associated with immune-infiltrated cells in UC. 13 hub genes associated with immune-infiltrated cells in UC were identified; they included CXCL13, CXCL10, CXCL9, CXCL8, CCL19, CTLA4, CCR1, CD69, CD163, IL7R, PECAM1, TLR8 and TLR2. These genes could potentially serve as markers for the diagnosis and treatment of UC.
© 2023. The Author(s).
Conflict of interest statement
The authors declare no competing interests.
Figures
Similar articles
-
Identification of shared gene signatures and molecular mechanisms between chronic kidney disease and ulcerative colitis.Front Immunol. 2023 Feb 13;14:1078310. doi: 10.3389/fimmu.2023.1078310. eCollection 2023. Front Immunol. 2023. PMID: 36860851 Free PMC article.
-
Identification of hub ferroptosis-related genes and immune infiltration in lupus nephritis using bioinformatics.Sci Rep. 2022 Nov 5;12(1):18826. doi: 10.1038/s41598-022-23730-8. Sci Rep. 2022. PMID: 36335193 Free PMC article.
-
Identifying Hub Genes, Key Pathways and Immune Cell Infiltration Characteristics in Pediatric and Adult Ulcerative Colitis by Integrated Bioinformatic Analysis.Dig Dis Sci. 2021 Sep;66(9):3002-3014. doi: 10.1007/s10620-020-06611-w. Epub 2020 Sep 25. Dig Dis Sci. 2021. PMID: 32974809
-
[Bioinformatics analysis and systematic review of key genes and therapeutic traditional Chinese medicine of ulcerative colitis active stage].Zhongguo Zhong Yao Za Zhi. 2020 Jun;45(11):2677-2686. doi: 10.19540/j.cnki.cjcmm.20200115.501. Zhongguo Zhong Yao Za Zhi. 2020. PMID: 32627503 Chinese.
-
Identification and Validation of Key miRNAs and a microRNA-mRNA Regulatory Network Associated with Ulcerative Colitis.DNA Cell Biol. 2021 Feb;40(2):147-156. doi: 10.1089/dna.2020.6151. Epub 2020 Dec 21. DNA Cell Biol. 2021. PMID: 33347387 Review.
Cited by
-
Association between serum direct bilirubin and 90-day mortality in patients with ARDS: A retrospective analysis.Medicine (Baltimore). 2025 Jun 27;104(26):e43051. doi: 10.1097/MD.0000000000043051. Medicine (Baltimore). 2025. PMID: 40587707 Free PMC article.
-
Evaluating the significance of ECSCR in the diagnosis of ulcerative colitis and drug efficacy assessment.Front Immunol. 2024 Aug 7;15:1426875. doi: 10.3389/fimmu.2024.1426875. eCollection 2024. Front Immunol. 2024. PMID: 39170615 Free PMC article.
-
Key Disease-Related Genes and Immune Cell Infiltration Landscape in Inflammatory Bowel Disease: A Bioinformatics Investigation.Int J Mol Sci. 2024 Sep 9;25(17):9751. doi: 10.3390/ijms25179751. Int J Mol Sci. 2024. PMID: 39273699 Free PMC article.
-
Identification of Inflammation-Related Diagnostic Biomarker and Molecular Subtypes in Ulcerative Colitis Based on Machine Learning.Dig Dis Sci. 2025 Aug 26. doi: 10.1007/s10620-025-09312-4. Online ahead of print. Dig Dis Sci. 2025. PMID: 40855234
-
Identification of Potential Genes and Critical Pathways in Postoperative Recurrence of Crohn's Disease by Machine Learning And WGCNA Network Analysis.Curr Genomics. 2023 Oct 27;24(2):84-99. doi: 10.2174/1389202924666230601122334. Curr Genomics. 2023. PMID: 37994325 Free PMC article.
References
Publication types
MeSH terms
LinkOut - more resources
Full Text Sources
Medical
Research Materials
Miscellaneous
