. 2023 Apr 13;6(1):408.
doi: 10.1038/s42003-023-04798-y.

Enriched binocular experience followed by sleep optimally restores binocular visual cortical responses in a mouse model of amblyopia

Affiliations

Enriched binocular experience followed by sleep optimally restores binocular visual cortical responses in a mouse model of amblyopia

Jessy D Martinez et al. Commun Biol. .

Abstract

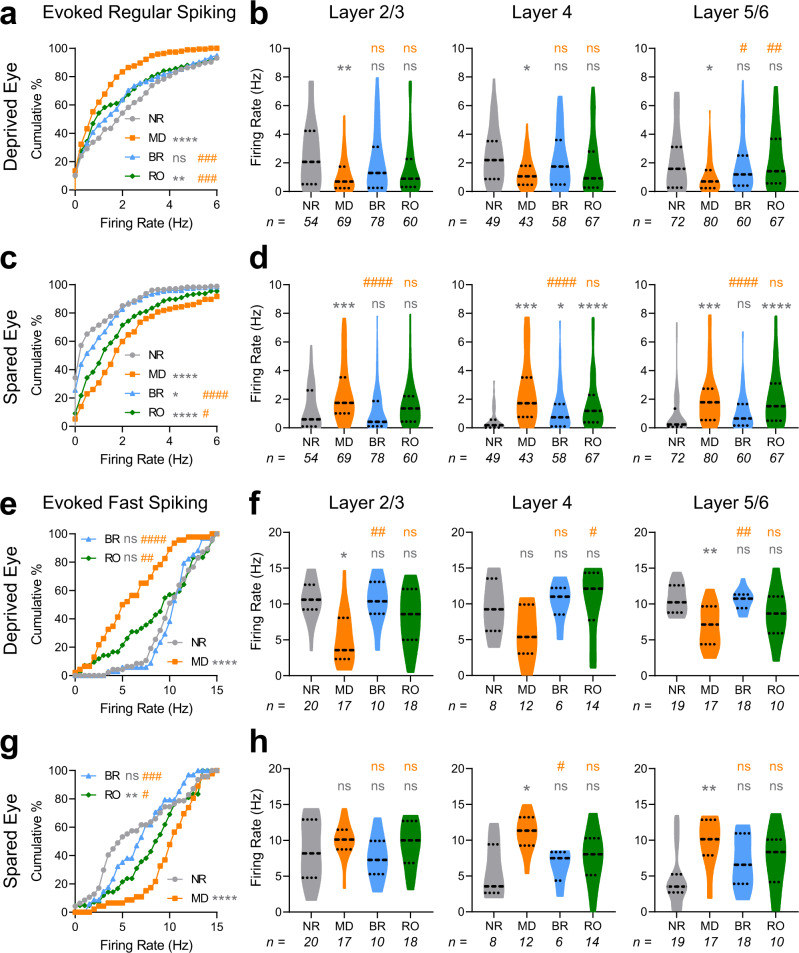
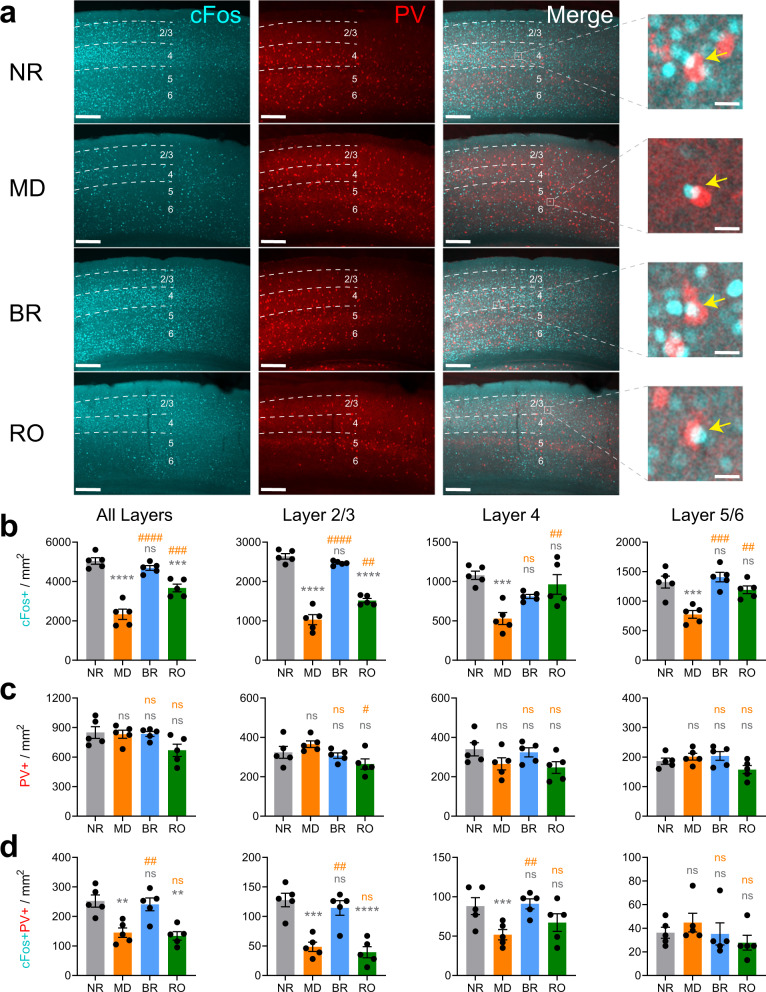
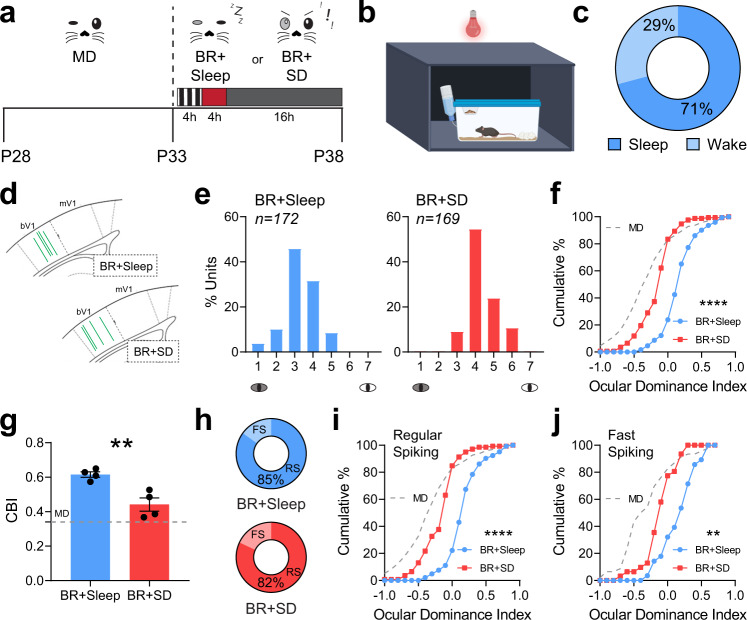
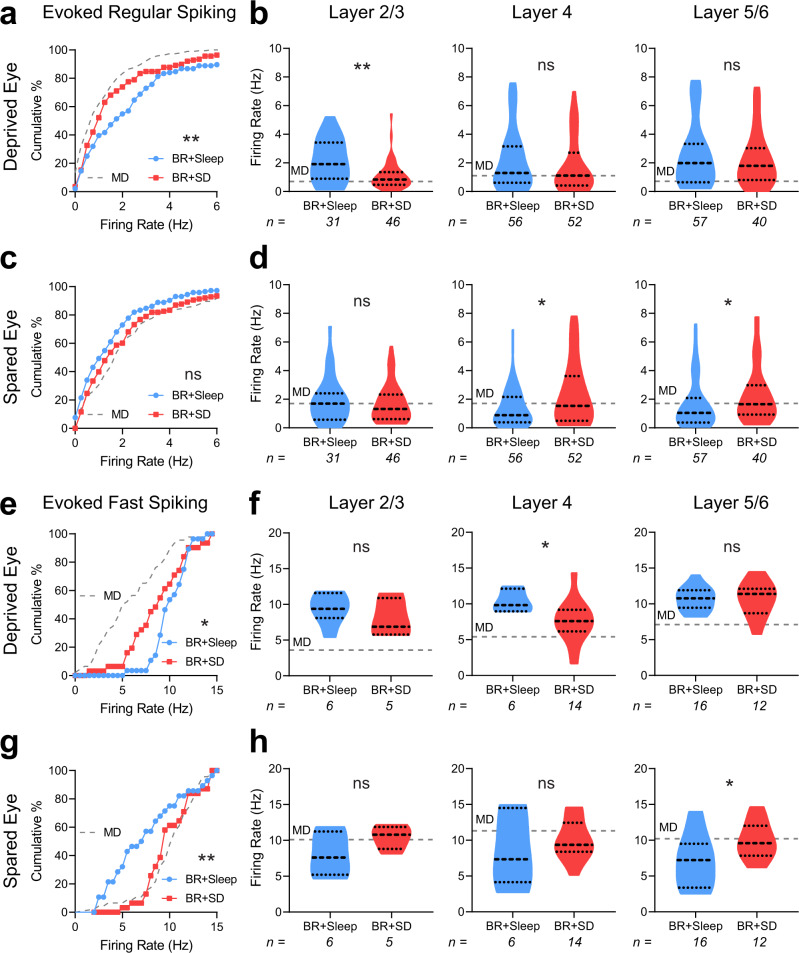
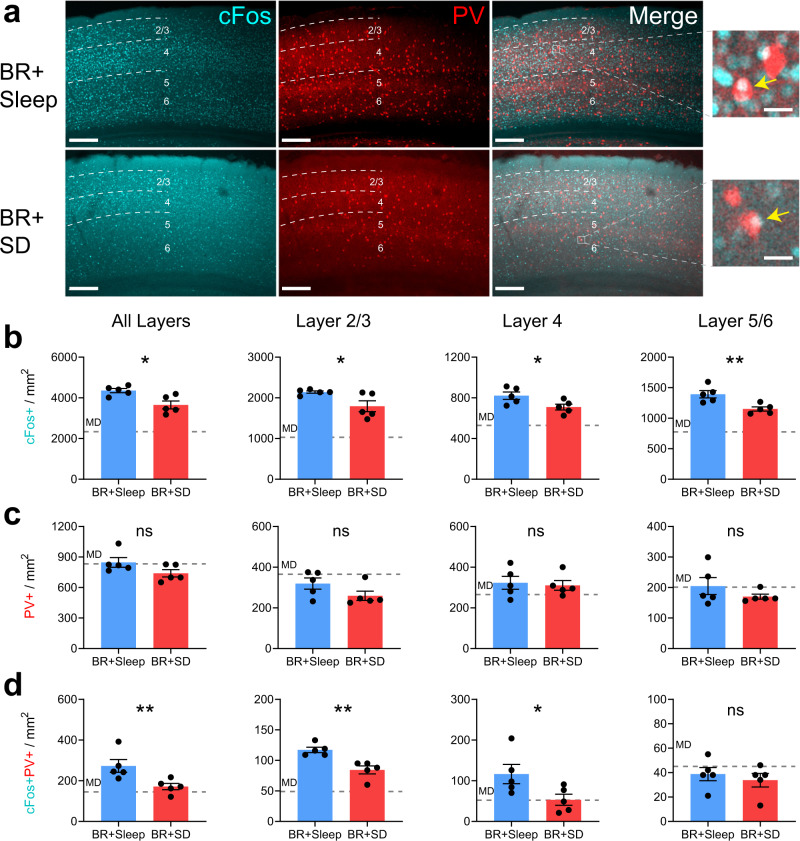
Studies of primary visual cortex have furthered our understanding of amblyopia, long-lasting visual impairment caused by imbalanced input from the two eyes during childhood, which is commonly treated by patching the dominant eye. However, the relative impacts of monocular vs. binocular visual experiences on recovery from amblyopia are unclear. Moreover, while sleep promotes visual cortex plasticity following loss of input from one eye, its role in recovering binocular visual function is unknown. Using monocular deprivation in juvenile male mice to model amblyopia, we compared recovery of cortical neurons' visual responses after identical-duration, identical-quality binocular or monocular visual experiences. We demonstrate that binocular experience is quantitatively superior in restoring binocular responses in visual cortex neurons. However, this recovery was seen only in freely-sleeping mice; post-experience sleep deprivation prevented functional recovery. Thus, both binocular visual experience and subsequent sleep help to optimally renormalize bV1 responses in a mouse model of amblyopia.


Conflict of interest statement

The authors declare no competing interests.

Figures

Fig. 1
Fig. 1. BR is more effective than RO at reversing MD-induced ocular dominance shifts.
a Experimental design. Mice underwent 5-day MD from P28-P33. MD mice were recorded at P33. Two recovery groups with either binocular recovery (BR) or reverse occlusion (RO) visual experience from P33-38 had daily 4-h periods of visual enrichment starting at lights on and were recorded at P38. Normally-reared (NR) mice were recorded at P38 without prior manipulation of vision. b Representative image of electrode probe placement in binocular primary visual cortex (bV1) coronal section stained with DAPI and enlarged view of electrode contacts, which spanned the layers of bV1 (scale bar = 200 µm). Schematic of bV1 coordinates in coronal sections where green lines represent probe placements in bV1 for all groups. c Ocular dominance histograms from bV1 neurons recorded contralateral to the original DE for all four groups, using a 7-point scale (1 = neurons driven exclusively by contralateral eye; 7 = neurons driven exclusively by ipsilateral eye, 4 = neurons with binocular responses) n = 5 mice/group. d Cumulative distribution of ocular dominance indices for all neurons recorded in each group. e Contralateral bias indices for mice in each treatment group. One-way ANOVA: F (3, 16) = 29.34, p < 0.0001. Error bars indicate mean ± SEM. f The proportion of recorded neurons classified as regular spiking (RS) neurons and fast-spiking (FS) interneurons in each treatment group. RS neurons: NR (n = 175); MD (n = 192); BR (n = 196); RO (n = 175). FS interneurons: NR (n = 47); MD (n = 46); BR (n = 34); RO (n = 42). g, h Ocular dominance index cumulative distributions for RS neurons (g) and FS interneurons (h). Ocular dominance index values for both populations were significantly shifted in favor of the SE after MD, were comparable to those of NR mice after BR, and were intermediate—between NR and MD values—after RO. **, ***, and **** (gray) indicate p < 0.05, p < 0.01 and p < 0.0001, K–S test vs. NR (d, g, h) or Tukey’s post hoc test vs. NR (e); #, ### and #### (orange) indicate p < 0.05, p < 0.001 and p < 0.0001, K-S test vs MD (d, g, h) or Tukey’s post hoc test vs MD (e); ns indicates not significant.
Fig. 2
Fig. 2. BR and RO differentially reverse MD-induced changes in DE and SE firing rate responses among RS neurons and FS interneurons.
a, c Cumulative distributions of preferred-stimulus (i.e. maximal) DE (a) and SE (c) visually-evoked firing rate responses for bV1 RS neurons. DE responses were significantly depressed after 5-day MD; this was reversed fully after BR and partially after RO. SE responses in RS neurons showed post-MD potentiation, which was maintained after RO, but largely reversed by BR. b, d Violin plots of RS neurons’ DE (b) and SE (d) visually-evoked responses recorded from neurons in bV1 layers 2/3, 4, or 5/6. Kruskal–Wallis test, p = 0.009, p = 0.035, p = 0.002 for layers 2/3, 4, and 5/6 in the DE, respectively. Kruskal–Wallis test, p < 0.0001, p < 0.0001, p < 0.0001 for layers 2/3, 4, and 5/6 in the SE, respectively. e, g Cumulative distributions of maximal DE (e) and SE (g) visually-evoked firing rate responses for FS interneurons. DE and SE responses were depressed and potentiated, respectively, after MD. These response changes were partially reversed by RO, and fully reversed by BR. g, h Violin plots of FS interneurons DE (f) and SE (h) visually-evoked responses recorded from neurons in each bV1 layer. Kruskal–Wallis test, p = 0.002, p = 0.021, p = 0.0004 for layers 2/3, 4, and 5/6 in the DE, respectively. Kruskal–Wallis test, p = 0.29, p = 0.005, p = 0.006 for layers 2/3, 4, and 5/6 in the SE, respectively. *, **, *** and **** (gray) indicate p < 0.05, p < 0.01, p < 0.001, and p < 0.0001, K-S test vs. NR (a, c, e, and g) or Dunn’s post hoc test (b, d, f, and h); #, ##, ### and #### (orange) indicate p < 0.05, p < 0.01, p < 0.001, and p < 0.0001, K-S test vs MD (a, c, e, and g) or Dunn’s post hoc test (b, d, f, and h); ns indicates not significant. Dashed lines in violin plots (b, d, f, and h) represent the 25%, median, and 75% quartiles. Sample sizes per group of units found in figure.
Fig. 3
Fig. 3. DE-driven cFos expression is reduced after MD and restored after BR, but not RO.
a Representative images of bV1 cFos (cyan), parvalbumin (PV) [red], and overlap across treatment groups following DE stimulation. Mice (n = 5/treatment group) received DE-only visual stimulation for 30 min, then were returned to their home cages for 90 min prior to perfusion. Dashed lines represent cortical layer distribution used in cell counting analysis. Scale bar = 100 µm; 20 µm (magnification inset). b DE-driven cFos+ neuron density was decreased in bV1 after MD. cFos expression was fully rescued after BR and partially rescued after RO. One-way ANOVA: F (3, 16) = 39.65, p < 0.0001. cFos+ neuron density in bV1 layers 2/3, 4, and 5/6. One-way ANOVA for layers 2/3, 4, or 5/6, respectively: F (3, 16) = 95.41, p < 0.0001, F (3, 16) = 9.093, p = 0.001, and F (3, 16) = 12.35, p = 0.0002. c Density of PV + bV1 interneurons was similar between groups. One-way ANOVA: F (3, 16) = 2.99, p = 0.062. PV + interneuron density in bV1 layers 2/3, 4, and 5/6. One-way ANOVA for layers 2/3, 4, or 5/6, respectively: F (3, 16) = 3.40, p = 0.044, ns, and ns. d cFos+ PV + interneuron density decreased with MD and recovered with BR, but not RO. One-way ANOVA: F (3, 16) = 11.40, p = 0.0003. cFos+PV + interneuron density in bV1 layers 2/3, 4, and 5/6. One-way ANOVA for layers 2/3, 4, or 5/6, respectively: F (3, 16) = 18.88, p < 0.0001, F (3, 16) = 4.25, p = 0.022, and ns. **, ***, and **** (gray) indicate p < 0.01, p < 0.001, and p < 0.0001, Tukey test vs. NR; #, ##, ### and #### (orange) indicate p < 0.05, p < 0.01, p < 0.001, and p < 0.0001, Tukey test vs MD; ns indicates not significant. Error bars indicate mean ± SEM.
Fig. 4
Fig. 4. Sleep loss following BR visual experience prevents ocular dominance shifts.
a Experimental design. Mice underwent 5-day MD and 5-day BR; each day after 4-hr BR, BR + Sleep mice were returned to their home cage and allowed ad lib sleep under dim red light, BR mice underwent 4 h of sleep deprivation (BR + SD) through gentle handling under dim red light. b Schematic of experimental setup for animal observation under dim red light. c On average, BR + Sleep mice spent 71% of the 4 h period following visual enrichment (n = 4) in sleep, based on visual confirmation of immobility, stereotyped (crouched) sleep postures, nesting, and closed eyes, consistent with prior studies,–. d Schematic of bV1 coordinates in coronal sections. Green lines indicate probe placements in bV1 for BR + Sleep and BR + SD groups. e Ocular dominance histograms for bV1 neurons recorded from BR + Sleep and BR + SD groups (4 mice/group). f Cumulative distribution of ocular dominance index values for bV1 neurons recorded from BR + Sleep and BR + SD mice. Values from neurons recorded in MD-only mice from Fig. 1 are shown (dashed gray lines) for comparison. g Contralateral bias index values were reduced for bV1 neurons recorded from BR + SD mice. Unpaired t-test: p = 0.0059. Error bars indicate mean ± SEM. h Proportion of recorded neurons identified as RS neurons or FS interneurons for the two groups. RS neurons: BR + Sleep (n = 144); BR + SD (n = 138). FS interneurons: BR + Sleep (n = 28); BR + SD (n = 31). i, j Ocular dominance index values for recorded RS neurons (i) and FS interneurons (j) were reduced in BR + SD mice. ** and **** indicate p < 0.01 and p < 0.0001, K-S test.
Fig. 5
Fig. 5. Post-BR SD prevents recovery of DE and SE responses after MD.
a, c Cumulative distributions of preferred-stimulus DE (a) and SE (c) visually-evoked firing rate responses for bV1 RS neurons. DE firing rate responses were significantly decreased in BR + SD mice relative to BR + Sleep mice. b, d Violin plots of RS neurons’ DE (b) and SE (d) visually-evoked responses recorded from neurons in bV1 layers 2/3, 4, or 5/6. Mann–Whitney test, p = 0.004, p = 0.26, p = 0.64 for layers 2/3, 4, and 5/6 in the DE, respectively. Mann–Whitney test, p = 0.61, p = 0.025, p = 0.029 for layers 2/3, 4, and 5/6 in the SE, respectively. e, g Cumulative distributions of maximal DE (e) and SE (g) visually-evoked firing rate responses for bV1 FS interneurons. Firing rate responses for DE and SE stimulation were significantly decreased and increased, respectively, in BR + SD mice. f, h Violin plots of FS interneurons’ DE (f) and SE (h) visually-evoked responses recorded from neurons in bV1 layers 2/3, 4, or 5/6. Mann–Whitney test, p = 0.66, p = 0.032, p = 0.83 for layers 2/3, 4, and 5/6 in the DE, respectively. Mann–Whitney test, p = 0.24, p = 0.49, p = 0.029 for layers 2/3, 4, and 5/6 in the SE, respectively. * and ** indicate p < 0.05 and p < 0.01, K-S test (a, c, e, and g) or Mann–Whitney (b, d, f, and h); ns indicates not significant. Values for the MD-only condition (gray dashed lines) from Fig. 2 are shown for comparison. Dashed lines in violin plots (b, d, f, and h) represent the 25%, median, and 75% quartiles. Sample sizes per group of units found in figure.
Fig. 6
Fig. 6. Post-BR SD prevents recovery of DE-driven cFos expression in bV1.
a bV1 cFos (cyan) and PV (red) expression after DE stimulation in BR + Sleep and BR + SD mice. Mice (n = 5/treatment group) received DE-only visual stimulation for 30 min, then were returned to their home cages for 90 min prior to perfusion. Scale bar = 100 µm; 20 µm (magnification inset). b DE-driven cFos+ neuron density was reduced in BR + SD mice relative to BR + Sleep mice. Unpaired t-test: p = 0.013. cFos+ neuron density was reduced in bV1 layers 2/3, 4, and 5/6 after BR + SD relative to BR + Sleep. Unpaired t-test for layers 2/3, 4, or 5/6, respectively: p = 0.036, p = 0.041, and p = 0.008. c PV immunostaining was similar between groups. PV + interneuron density in bV1 layers 2/3, 4, and 5/6 was similar between groups. d cFos+ PV + interneuron density was decreased in BR + SD mice relative to BR + Sleep mice. Unpaired t-test: p = 0.020. cFos+ PV + interneuron density was reduced in bV1 layers 2/3 and 4 in BR + SD mice relative to BR + Sleep mice. Unpaired t-test for layers 2/3, 4, or 5/6, respectively: p = 0.003, p = 0.049, and p = 0.53. Values for the MD-only condition (gray dashed lines) from Fig. 3 are shown for comparison. * and ** indicate p < 0.05, and p < 0.01, respectively; ns indicates not significant. Error bars indicate mean ± SEM.

Similar articles

Cited by

References

    1. Hensch TK. Critical period regulation. Annu Rev. Neurosci. 2004;27:549–579. doi: 10.1146/annurev.neuro.27.070203.144327. - DOI - PubMed
    1. Knudsen EI. Sensitive periods in the development of the brain and behavior. J. Cogn. Neurosci. 2004;16:1412–1425. doi: 10.1162/0898929042304796. - DOI - PubMed
    1. Blumberg MS. Developing sensorimotor systems in our sleep. Curr. Dir. Psychol. Sci. 2015;24:32–37. doi: 10.1177/0963721414551362. - DOI - PMC - PubMed
    1. Wiesel TN, Hubel DH. Single cell responses in striate cortex of kittens deprived of vision in one eye. J. Neurophysiol. 1963;28:1029–1040. doi: 10.1152/jn.1965.28.6.1029. - DOI - PubMed
    1. Gordon JA, Stryker MP. Experience-dependent plasticity of binocular responses in the primary visual cortex of the mouse. J. Neurosci. 1996;16:3274–3286. doi: 10.1523/JNEUROSCI.16-10-03274.1996. - DOI - PMC - PubMed

Publication types