. 2023 May;30(5):1382-1396.
doi: 10.1038/s41418-023-01144-x. Epub 2023 Apr 13.

Inhibition of USP14 promotes TNFα-induced cell death in head and neck squamous cell carcinoma (HNSCC)

Affiliations

Inhibition of USP14 promotes TNFα-induced cell death in head and neck squamous cell carcinoma (HNSCC)

Ethan L Morgan et al. Cell Death Differ. 2023 May.

Abstract

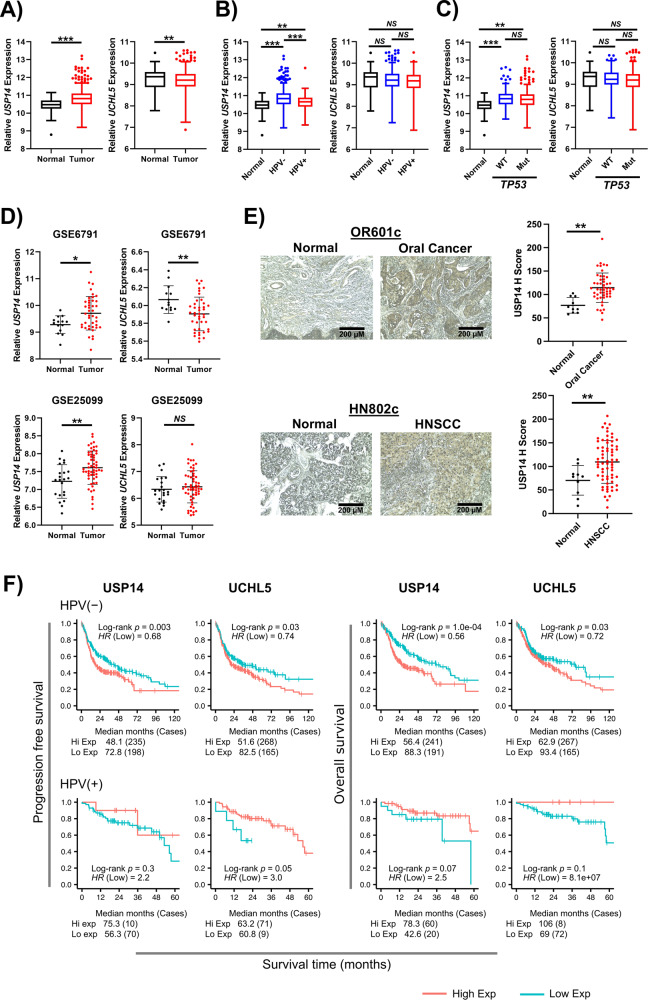
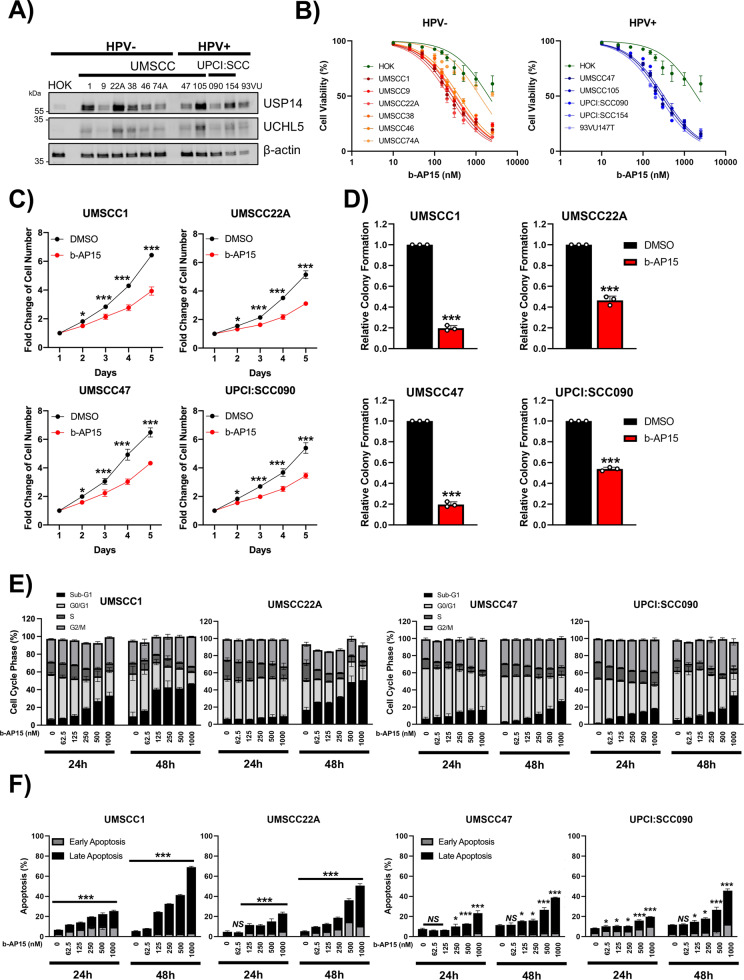
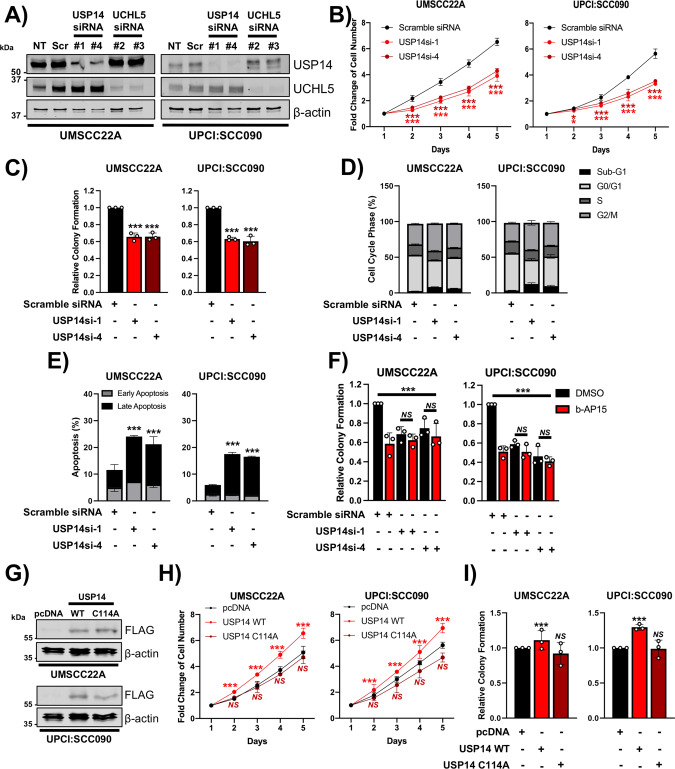
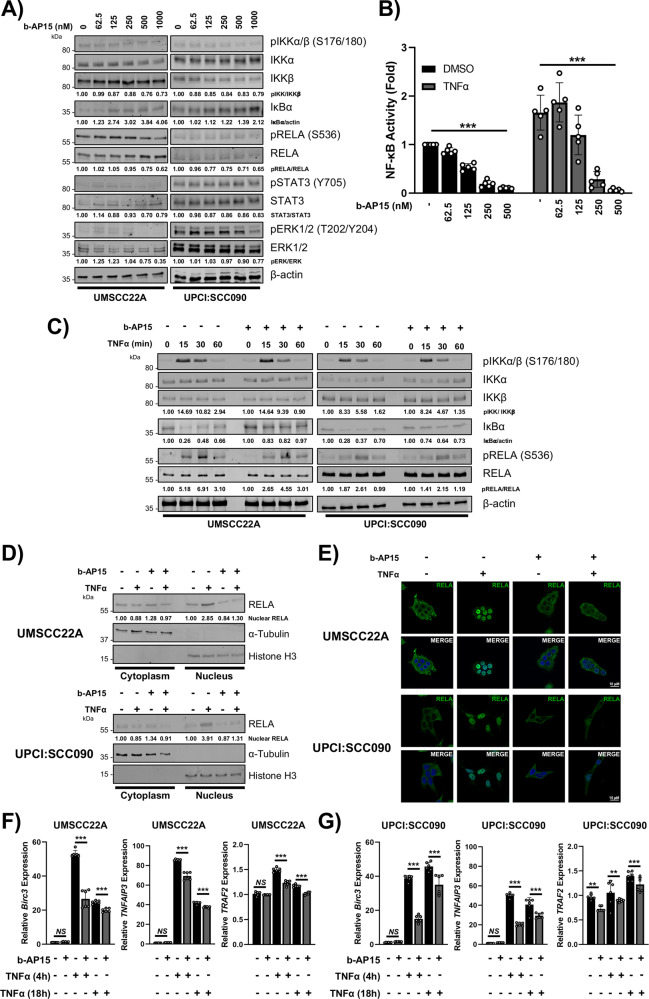
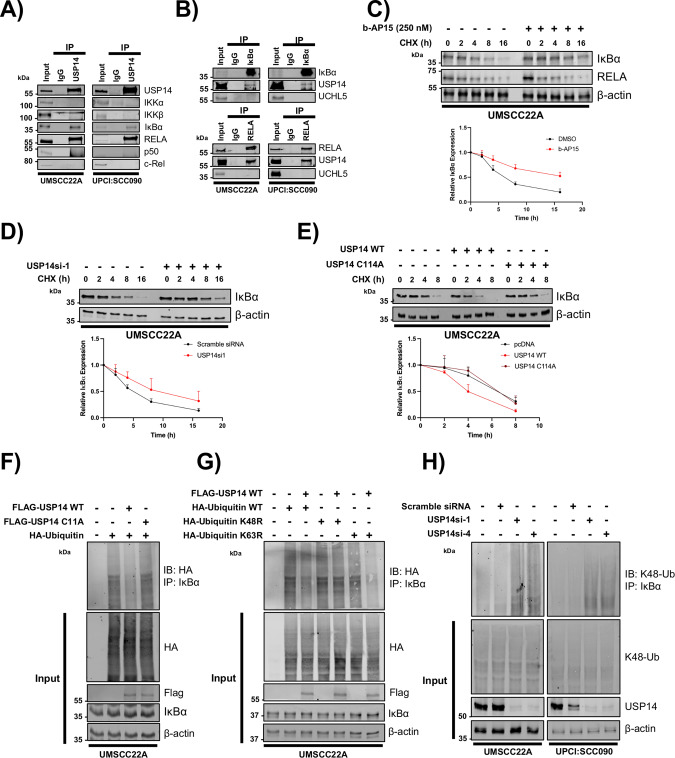
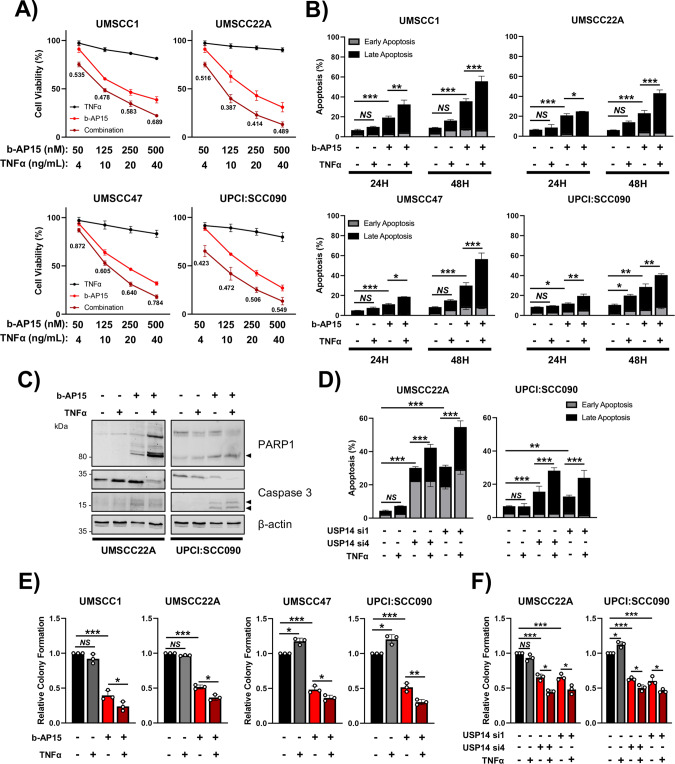
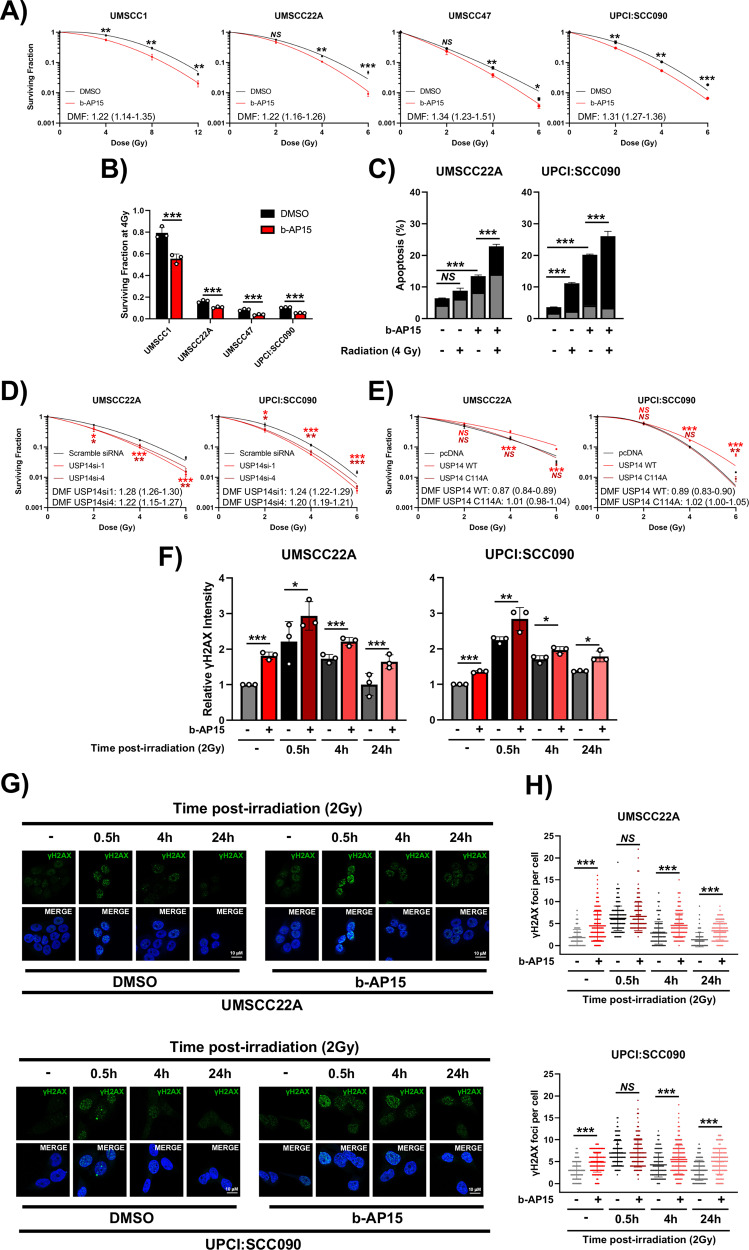
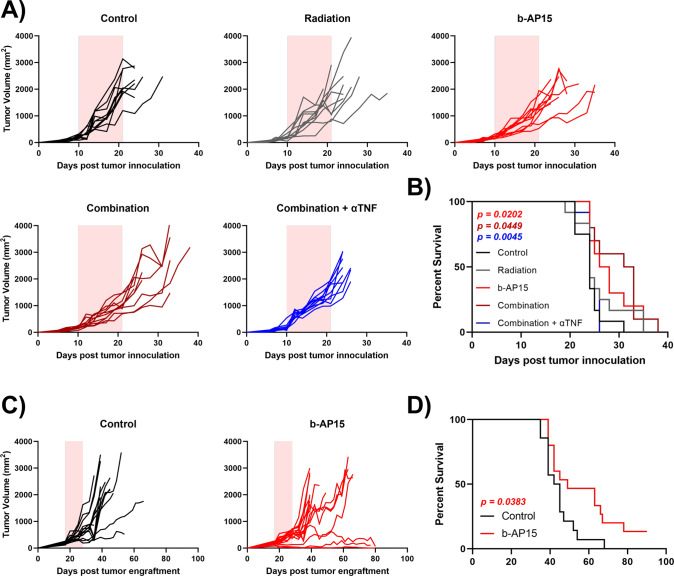
TNFα is a key mediator of immune, chemotherapy and radiotherapy-induced cytotoxicity, but several cancers, including head and neck squamous cell carcinomas (HNSCC), display resistance to TNFα due to activation of the canonical NFκB pro-survival pathway. However, direct targeting of this pathway is associated with significant toxicity; thus, it is vital to identify novel mechanism(s) contributing to NFκB activation and TNFα resistance in cancer cells. Here, we demonstrate that the expression of proteasome-associated deubiquitinase USP14 is significantly increased in HNSCC and correlates with worse progression free survival in Human Papillomavirus (HPV)- HNSCC. Inhibition or depletion of USP14 inhibited the proliferation and survival of HNSCC cells. Further, USP14 inhibition reduced both basal and TNFα-inducible NFκB activity, NFκB-dependent gene expression and the nuclear translocation of the NFκB subunit RELA. Mechanistically, USP14 bound to both RELA and IκBα and reduced IκBα K48-ubiquitination leading to the degradation of IκBα, a critical inhibitor of the canonical NFκB pathway. Furthermore, we demonstrated that b-AP15, an inhibitor of USP14 and UCHL5, sensitized HNSCC cells to TNFα-mediated cell death, as well as radiation-induced cell death in vitro. Finally, b-AP15 delayed tumor growth and enhanced survival, both as a monotherapy and in combination with radiation, in HNSCC tumor xenograft models in vivo, which could be significantly attenuated by TNFα depletion. These data offer new insights into the activation of NFκB signaling in HNSCC and demonstrate that small molecule inhibitors targeting the ubiquitin pathway warrant further investigation as a novel therapeutic avenue to sensitize these cancers to TNFα- and radiation-induced cytotoxicity.


Conflict of interest statement

The authors declare no competing interests.

Figures

Fig. 1
Fig. 1. USP14 is highly expressed in HNSCC and correlates with worse progression free survival.
A Box plot analysis of USP14 and UCHL5 mRNA expression in normal (n = 44) and HNSCC (n = 516) tissue from TCGA HNSCC database. B Box plot analysis of USP14 and UCHL5 mRNA expression in normal (n = 44), HPV- HNSCC (n = 434) and HPV + HNSCC (n = 80) tissue from TCGA HNSCC database. C Box plot analysis of USP14 and UCHL5 mRNA expression in normal (n = 44), WT TP53 HNSCC (n = 167) and mtTP53 HNSCC (n = 347) tissue from TCGA HNSCC database. D Scatter dot plot of USP14 and UCHL5 mRNA expression in normal and HNSCC tissue from the GEO database entries GSE6791 (normal n = 14, HNSCC n = 42) and GSE25099 (normal n = 22, HNSCC n = 57). E Representative immunohistochemical (IHC) staining of USP14 expression in normal and cancer tissue from OR601c and HN802c tissue microarrays (TMA). Scatter dot plot analysis of USP14 expression from the full TMAs are shown on the right. OR601c contains 10 normal and 50 oral cancer sections and HN802c contains 10 normal and 70 head and neck cancer sections. Scale bars, 200 μm. F Progression free and overall survival analysis of TCGA HNSCC data based on USP14 and UCHL5 expression, separated by HPV status. Survival data were plotted using the Kaplan–Meier survival curve. Red indicates high expression, cyan indicates low expression. P values were determined using the log-rank test. Plots were truncated at 10 years for HPV- patients and five years for HPV + patients, but the analyses were conducted using all data. NS not significant; *p  <  0.05; **p  <  0.01; ***p  <  0.001 (Student’s t test).
Fig. 2
Fig. 2. The proteasomal deubiquitinase inhibitor b-AP15 reduced proliferation and induced apoptosis in HNSCC cells.
A Western blot analysis of USP14 and UCHL5 expression in human oral keratinocytes (HOK) and a panel of HPV- and HPV + HNSCC cell lines. β-actin was used as the loading control. B XTT cell viability analysis of HOK and HNSCC cell lines after treatment with increasing doses of b-AP15 (250 nM) for 48 h. C Cell growth analysis of UMSCC1, UMSCC22A, UMSCC47 and UPCI:SCC090 cells. Cells were treated with b-AP15 (250 nM) for 24 h. Cells were then replated at a specific cell number (cell line dependent) and counted every 24 h. D Colony formation assay of UMSCC1, UMSCC22A, UMSCC47 and UPCI:SCC090 cells 24 h after b-AP15 (250 nM) treatment. E Cell cycle analysis of UMSCC1, UMSCC22A, UMSCC47 and UPCI:SCC090 cells 24 and 48 h after treatment with increasing doses of b-AP15. F Annexin V analysis of UMSCC1, UMSCC22A, UMSCC47 and UPCI:SCC090 cells 24 and 48 h after treatment with increasing doses of b-AP15. Bars represent the means ± standard deviation. All experiments are representative of at least three biological replicates. NS not significant; *p  <  0.05; **p  <  0.01; ***p  <  0.001 (Student’s t test).
Fig. 3
Fig. 3. USP14 is the primary target of b-AP15 in HNSCC cells.
A Representative western blot of USP14 and UCHL5 expression in UMSCC22A and UPCI:SCC090 cells after transfection with two specific USP14 or UCHL5 siRNAs for 72 h. β-actin was used as the loading control. B Cell growth analysis of UMSCC22A and UPCI:SCC090 cells after transfection of two specific USP14 siRNAs for 72 h. C Colony formation assay of UMSCC22A and UPCI:SCC090 cells after transfection with two specific USP14 or UCHL5 siRNA for 72 h. D Cell cycle analysis of UMSCC22A and UPCI:SCC090 cells after transfection with two specific USP14 siRNAs for 72 h. E Annexin V analysis of UMSCC22A and UPCI:SCC090 cells transfection with two specific USP14 siRNAs for 72 h. F Colony formation assay of UMSCC22A and UPCI:SCC090 cells transfection with two specific USP14 siRNAs for 72 h. After 48 h, cells were additionally treated with b-AP15 (250 nM) or vehicle control. G Representative western blot of USP14 WT and USP14 C11A expression in UMSCC22A and UPCI:SCC090 cells 48 h after transfection. β-actin was used as the loading control. H Cell growth analysis of UMSCC22A and UPCI:SCC090 cells after transfection with USP14 WT and USP14 C11A for 48 h. I Colony formation assay of UMSCC22A and UPCI:SCC090 cells after transfection with USP14 WT and USP14 C11A expression for 48 h. Bars represent the means ± standard deviation. All experiments are representative of at least three biological replicates. NS not significant; *p  <  0.05; **p  <  0.01; ***p  <  0.001 (Student’s t test).
Fig. 4
Fig. 4. b-AP15 reduces NFκB activity by preventing the nuclear translocation of RELA.
A Representative western blot of the expression of NFκB pathway components, STAT3 and ERK1/2 in UMSCC22A and UPCI:SCC090 after treatment with increasing doses of b-AP15 for 24 h. β-actin was used as the loading control. B NFκB reporter activity after treatment with increasing doses of b-AP15. Cells were treated with increasing doses of b-AP15 or vehicle control for 24 h, with TNFα (20 ng/mL) added for the final 16 h. C Representative western blot of the phosphorylation and expression of IKKα/β, IκBα and RELA. UMSCC22A and UPCI:SCC090 cells were treated with b-AP15 (250 nM) or vehicle control for 6 h, with TNFα (20 ng/mL) added for the specified time. β-actin was used as the loading control. D Representative western blot of the RELA localisation after cellular fractionation into cytoplasmic and nuclear fractions. UMSCC22A and UPCI:SCC090 cells were treated with b-AP15 (250 nM) or vehicle control for 6 h, with TNFα (20 ng/mL) added for 30 min. α-tubulin and Histone H3 were used as loading controls for the cytoplasmic and nuclear fractions, respectively. E Representative immunofluorescence images of RELA localisation. UMSCC22A and UPCI:SCC090 cells were treated with b-AP15 (250 nM) or vehicle control for 6 h, with TNFα (20 ng/mL) added for 30 min. DAPI was used as a nuclear counterstain. qPCR analysis of Birc3, TNFAIP3 and TRAF2 in UMSCC22A (F) and UPCI:SCC090 (G) cells. Cells were treated with b-AP15 (250 nM) for 24 h, with TNFα (20 ng/mL) added for the indicated times. U6 was used as the loading control. H Cell growth analysis of UMSCC22A and UPCI:SCC090 cells after transfection USP14 WT and USP14 C11A expression 48 h. Bars represent the means ± standard deviation. Western blot experiments are representative of at least three biological repeats; numbers represent quantification of protein bands. Immunofluorescence images are representative from 2 biological replicates. qPCR analysis data is from 3 technical repeats of 2 independent experiments. NS not significant; *p  <  0.05; **p  <  0.01; ***p  <  0.001 (Student’s t test).
Fig. 5
Fig. 5. USP14 interacts with and deubiquitinates IκBα.
A Representative western blot of endogenous USP14 immunoprecipitation in UMSCC22A and UPCI:SCC090 cells. USP14 immunoprecipitates were analyzed for binding to the indicated components of the NFκB pathway. USP14 was detected to confirm successful immunoprecipitation. B Representative western blot of endogenous IκBα and RELA immunoprecipitation in UMSCC22A and UPCI:SCC090 cells. IκBα and RELA immunoprecipitates were analyzed for binding to the USP14 and UCHL5. IκBα and RELA, respectively, were detected to confirm successful immunoprecipitation. C Representative western blot of UMSCC22A cells after treatment with b-AP15 (250 nM) for 6 h. Cells were the treated with 20 µM cycloheximide and harvested at the indicated time points. Lysates were analyzed for the expression of IκBα and RELA. β-actin was used as the loading control. Quantification of the protein band intensities from three biological repeats are shown below. D Representative western blot of UMSCC22A cells after transfection with a specific USP14 siRNA for 48 h. Cells were treated with 20 µM cycloheximide and harvested at the indicated time points. Lysates were analyzed for the expression of IκBα. β-actin was used as the loading control. Quantification of the protein band intensities from three biological repeats are shown below. E Representative western blot of HeLa cells after transfection of FLAG-USP14 WT or FLAG-USP14 C114A. Cells were treated with 20 µM cycloheximide and harvested at the indicated time points. Lysates were analyzed for the expression of IκBα. β-actin was used as the loading control. Quantification of the protein band intensities from three biological repeats are shown below. F UMSCC22A cells were co-transfected with HA-Ubiquitin and Flag-USP14 WT or FLAG-USP14 C114A. Cells were treated with 10 µM MG132 for 6 h and IκBα was immunoprecipitated. Ubiquitinated IκBα was detected using an anti-HA antibody. β-actin was used as the loading control. G UMSCC22A cells were co-transfected with HA-Ubiquitin or mutant Ubiquitin (K48R or K63R), with or without Flag-USP14 WT. Cells were treated with 10 µM MG132 for 6 h and IκBα was immunoprecipitated. Ubiquitinated IκBα was detected using an anti-HA antibody. β-actin was used as the loading control. H UMSCC22A and UPCI:SCC090 cells were transfected with two specific USP14 siRNAs for 72 h. Cells were treated with 10 µM MG132 for 6 h before harvesting and IκBα was immunoprecipitated Ubiquitinated IκBα was detected using an anti-K-48ubiquitin antibody. β-actin was used as the loading control. Bars represent the means ± standard deviation. All experiments are representative of at least three biological replicates. NS not significant; *p  <  0.05; **p  <  0.01; ***p  <  0.001 (Student’s t test).
Fig. 6
Fig. 6. USP14 inhibition sensitizes HNSCC cells to TNFα-induced cell death.
A XTT cell viability analysis of HNSCC cell lines after treatment with varying doses of b-AP15 and/or TNFα for 48 h. Values below the combination are Combination Indices (CI) as described in the text. B Annexin V analysis of HNSCC cell lines after treatment with TNFα (20 ng/mL), b-AP15 (250 nM), or the combination for 24 and 48 h. C Representative western blot of UMSCC22A and UPCI:SCC090 cells after treatment with TNFα (20 ng/mL), b-AP15 (250 nM) or the combination for 24 h. Lysates were analyzed for PARP1 and Caspase 3 cleavage. β-actin was used as the loading control. D Annexin V analysis of UMSCC22A and UPCI:SCC090 cells after transfection with two specific USP14 siRNAs for 72 h. TNFα (20 ng/mL) was added for the last 24 h. E Colony formation assay of HNSCC cell lines after treatment with TNFα (20 ng/mL), b-AP15 (250 nM) or the combination for 24 h. F Colony formation assay of UMSCC22A and UPCI:SCC090 cells after transfection with two specific USP14 siRNAs for 72 h. TNFα (20 ng/mL) was added for the last 24 h. Bars represent the means ± standard deviation. All experiments are representative of at least three biological replicates. NS not significant; *p  <  0.05; **p  <  0.01; ***p  <  0.001 (Student’s t test).
Fig. 7
Fig. 7. b-AP15 impairs the DNA damage response and sensitizes HNSCC cells to radiation-induced cell death.
A Clonogenic survival assays of UMSCC1, UMSCC22A, UMSCC47 and UPCI:SCC090 treated with b-AP15 (250 nM) for 2 h before irradiation. Cells were then harvested and replated 24 h after irradiation. B Survival fraction at 4 Gy from each cell line in (A). C Annexin V analysis of UMSCC22A and UPCI:SCC090 cells. Cells were treated with b-AP15 (250 nM) for 2 h before irradiation and assay was performed 24 h after irradiation. D Clonogenic survival assays of UMSCC22A and UPCI:SCC090 cells transfected with two specific USP14 siRNAs for 48 h before irradiation. Cells were then harvested and replated 24 h after irradiation. E Clonogenic survival assays of UMSCC22A and UPCI:SCC090 cells transfected with USP14 WT and USP14 C11A expression for 24 h before irradiation. Cells were then harvested and replated 24 h after irradiation. F UMSCC22A and UPCI:SCC090 cells were treated with b-AP15 (250 nM) for 2 h before irradiation. Cells were then analyzed for γH2AX expression by flow cytometry at the indicated time points. For non-irradiated samples, cells were treated with vehicle or b-AP15 (250 nM) for 24 h before analysis. Data is presented as the relative median fluorescence intensity (MFI) compared to the non-irradiated control samples. G Representative immunofluorescence images of γH2AX foci in UMSCC22A and UPCI:SCC090 cells after treatment with b-AP15 (250 nM) and radiation. Cells were treated with b-AP15 (250 nM) for 2 h before irradiation. Cells were then analyzed for γH2AX foci by immunofluorescence analysis at the indicated time points. For non-irradiated samples, cells were treated with vehicle or b-AP15 (250 nM) for 24 h before analysis. H Quantification of (G). For each condition, foci from at least 200 cells were counted. DMF values were calculated as the vehicle radiation dose for 10% survival divided by radiation dose for 10% survival with the indicated treatment. Bars represent the means ± standard deviation. All experiments are representative of at least three biological replicates. NS not significant; *p  <  0.05; **p  <  0.01; ***p  <  0.001 (Student’s t test).
Fig. 8
Fig. 8. b-AP15 reduced tumor growth and enhanced survival in vivo alone, and in combination with radiation.
A Individual growth curves of athymic nude mice subcutaneously injected with UMSCC1. Mice were split into 5 groups when the tumor size reached 200 mm3; vehicle control, radiation, b-AP15 (5 mg/kg), b-AP15 (5 mg/kg) + radiation or b-AP15 (5 mg/kg) + radiation + anti-mouse TNFα. Each group contain 10–12 mice. The pink shaded area represents the treatment window. B Survival curves of the mice in (A). C Individual growth curves of athymic nude mice subcutaneously injected with UPCI:SCC090. Mice were split into 2 groups when tumor size reached 200 mm3; vehicle control, or b-AP15 (5 mg/kg). Each group contain 15 mice. The pink shaded area represents the treatment window. D Survival curves of the mice in (C). Survival data were plotted using a Kaplan–Meier survival curve, and statistical significance was calculated using the log-rank test.

Similar articles

Cited by

References

    1. Chow LQM. Head and neck cancer. N Engl J Med. 2020;382:60–72. doi: 10.1056/NEJMra1715715. - DOI - PubMed
    1. Cramer JD, Burtness B, Le QT, Ferris RL. The changing therapeutic landscape of head and neck cancer. Nat Rev Clin Oncol. 2019;16:669–83. doi: 10.1038/s41571-019-0227-z. - DOI - PubMed
    1. Powell SF, Gold KA, Gitau MM, Sumey CJ, Lohr MM, McGraw SC. Safety and efficacy of pembrolizumab with chemoradiotherapy in locally advanced head and neck squamous cell carcinoma: a phase IB study. J Clin Oncol. 2020;38:2427. doi: 10.1200/JCO.19.03156. - DOI - PMC - PubMed
    1. Burtness B, Rischin D, Greil R, Soulières D, Tahara M, Jr, de Castro G., Jr Pembrolizumab alone or with chemotherapy for recurrent/metastatic head and neck squamous cell carcinoma in KEYNOTE-048: subgroup analysis by programmed death ligand-1 combined positive score. J Clin Oncol. 2022;40:2321–32. doi: 10.1200/JCO.21.02198. - DOI - PMC - PubMed
    1. Urban JL, Shepard HM, Rothstein JL, Sugarman BJ, Schreiber H. Tumor necrosis factor: a potent effector molecule for tumor cell killing by activated macrophages. Proc Natl Acad Sci. 1986;83:5233–7. doi: 10.1073/pnas.83.14.5233. - DOI - PMC - PubMed

Publication types

MeSH terms