. 2023 Apr;616(7957):553-562.
doi: 10.1038/s41586-023-05776-4. Epub 2023 Apr 13.

Tracking early lung cancer metastatic dissemination in TRACERx using ctDNA

Collaborators, Affiliations

Tracking early lung cancer metastatic dissemination in TRACERx using ctDNA

Christopher Abbosh et al. Nature. 2023 Apr.

Abstract

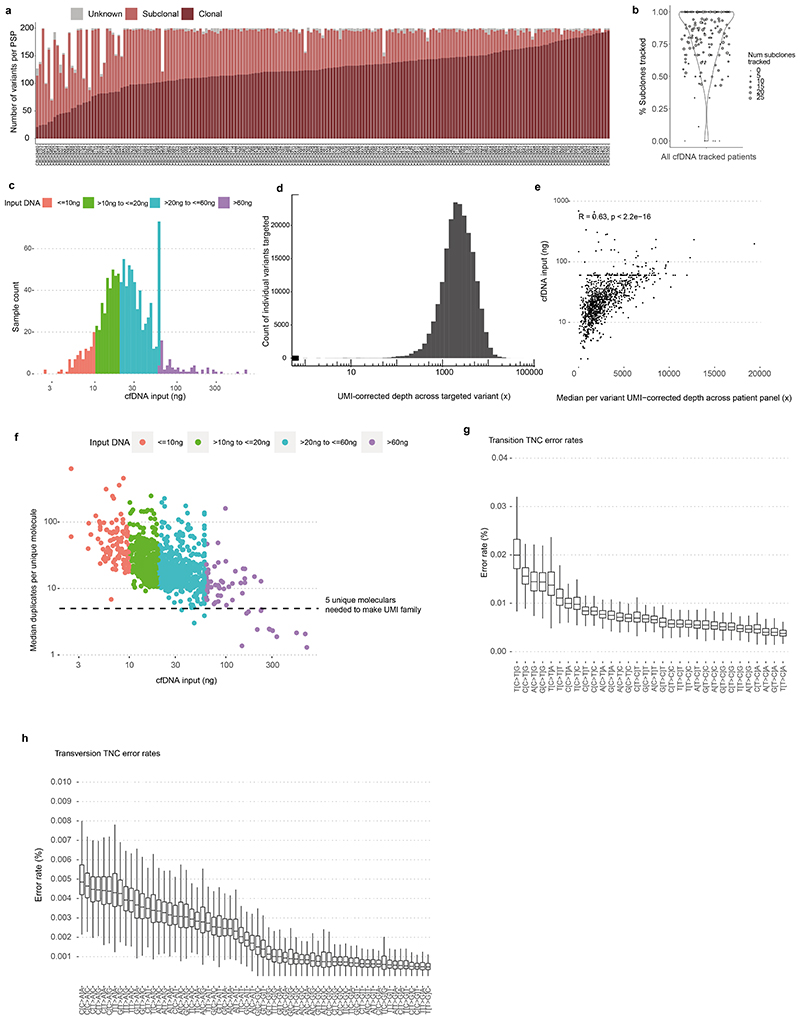
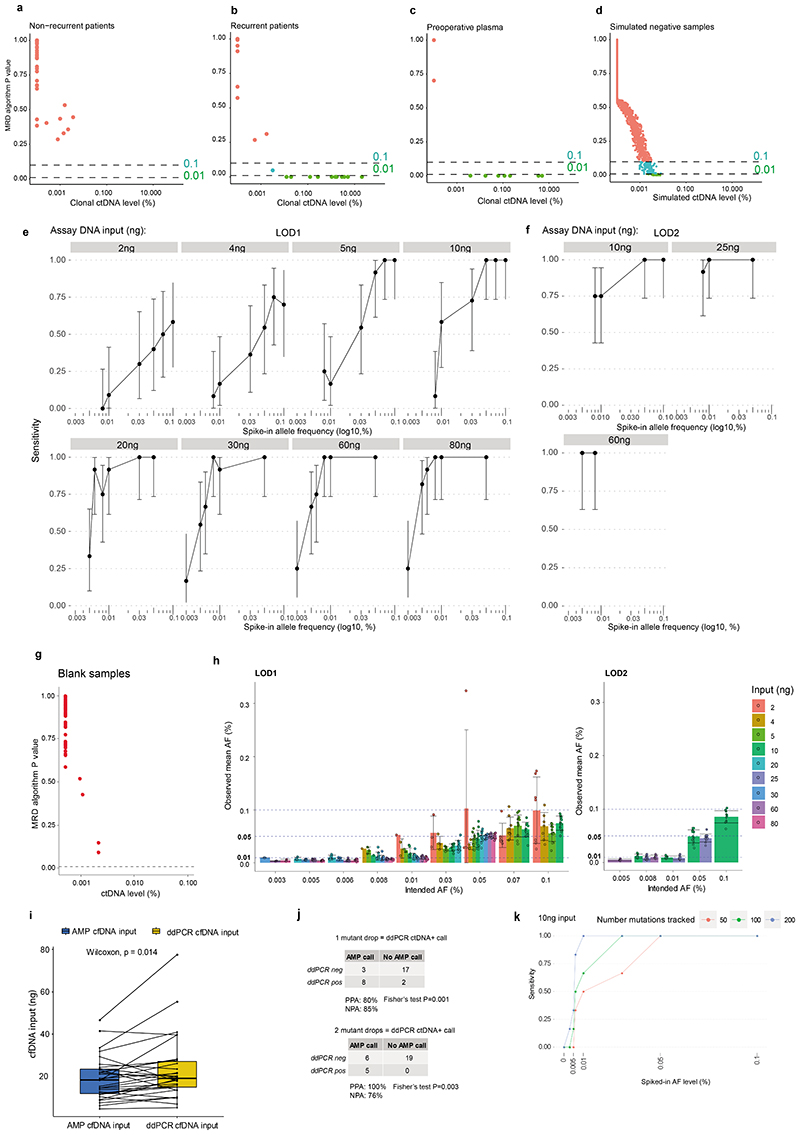
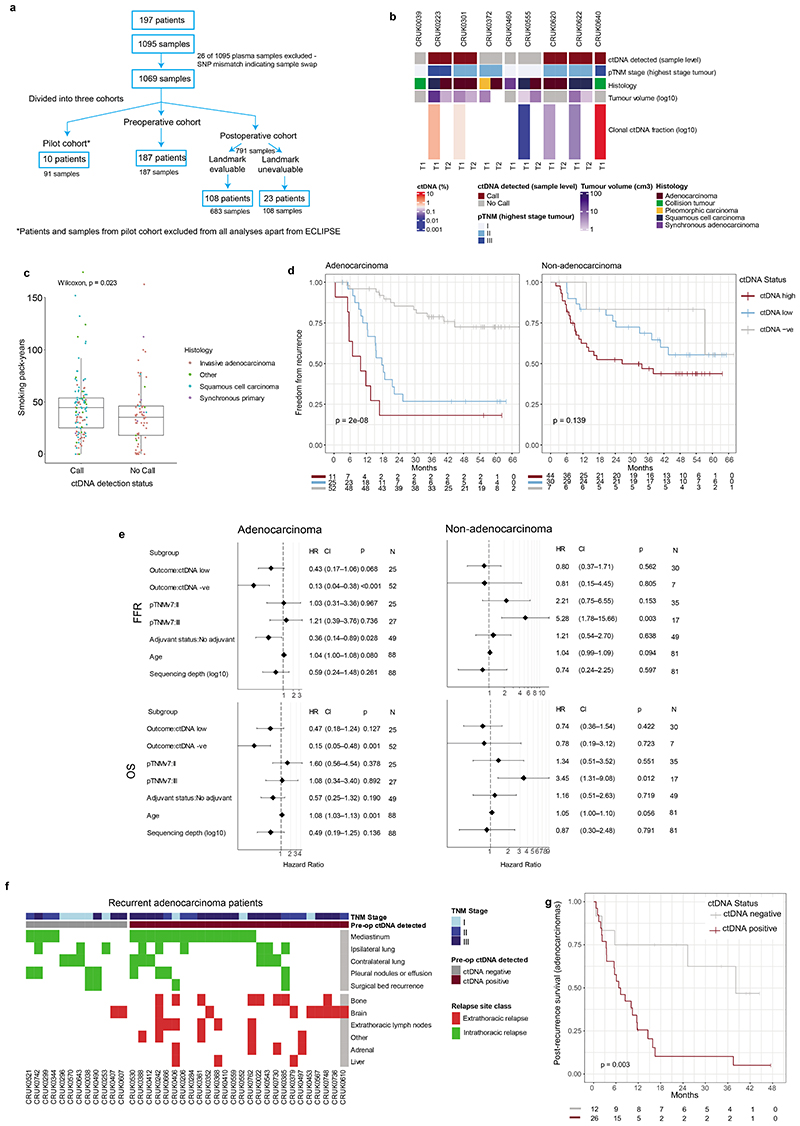
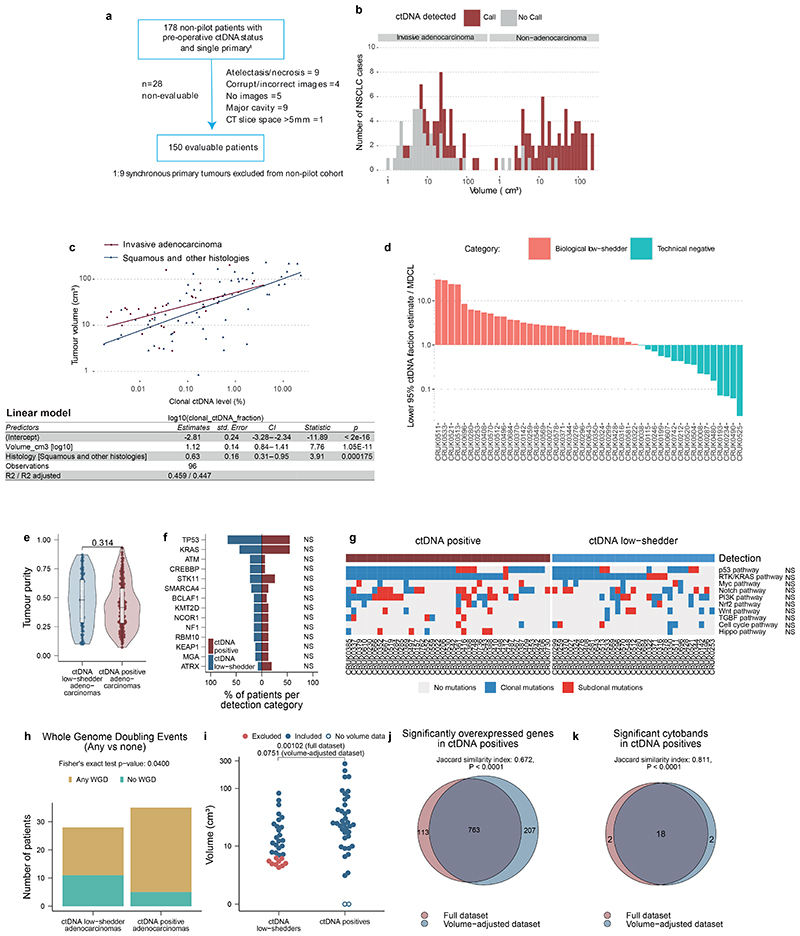
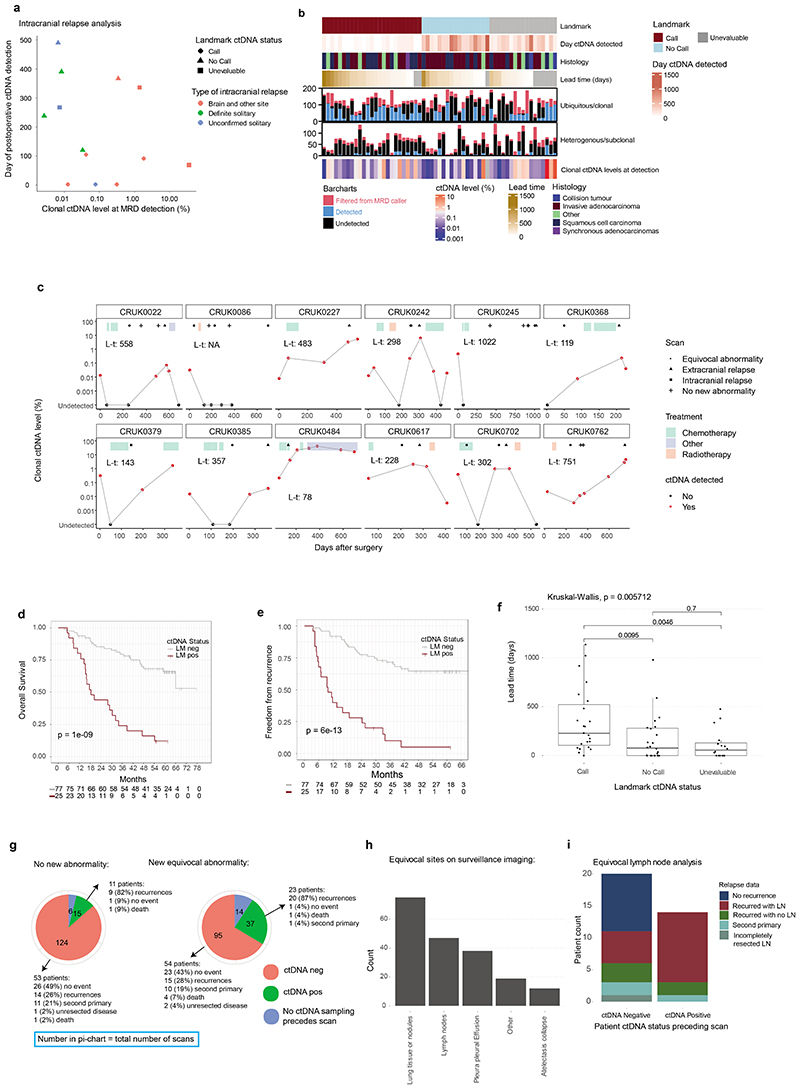
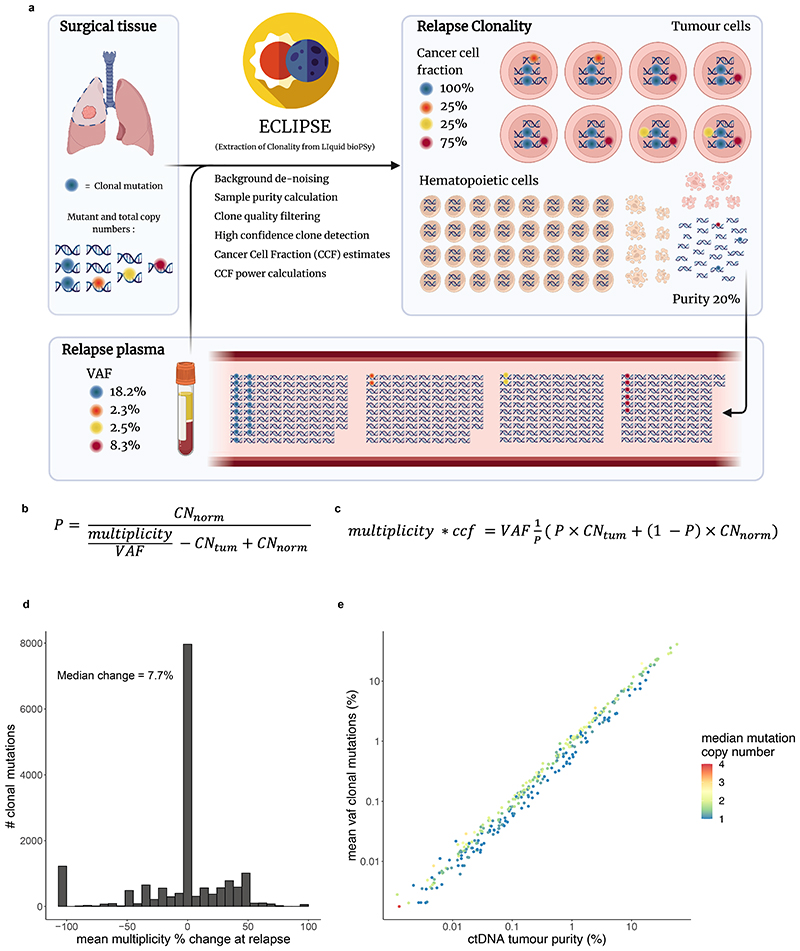
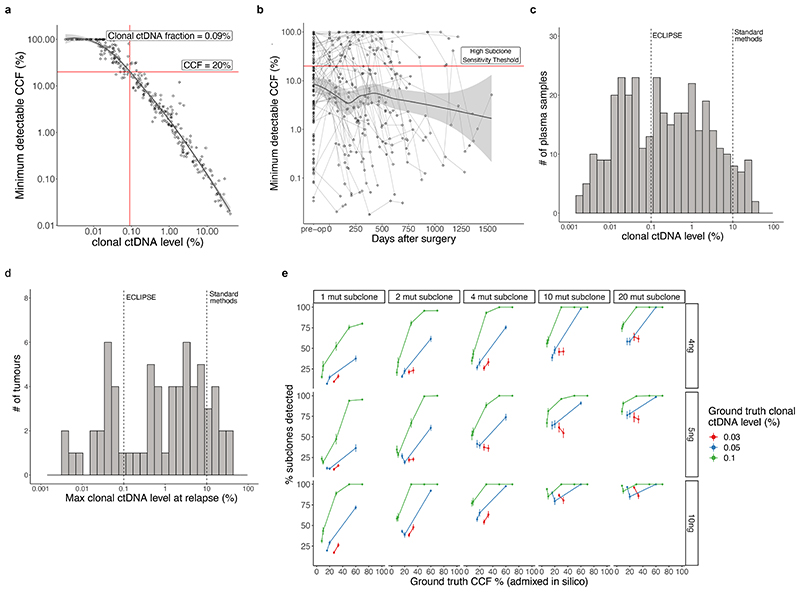
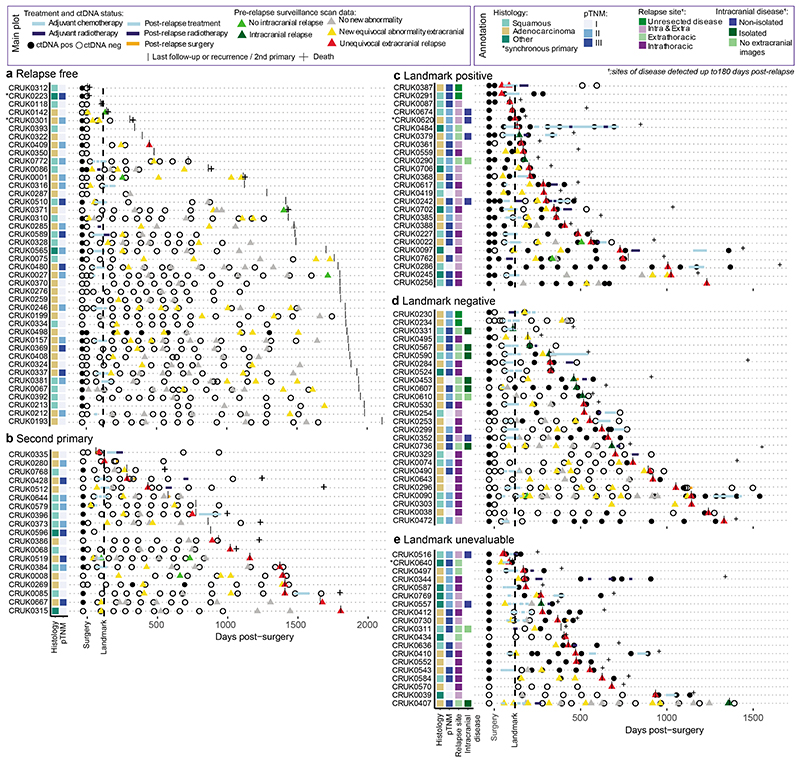
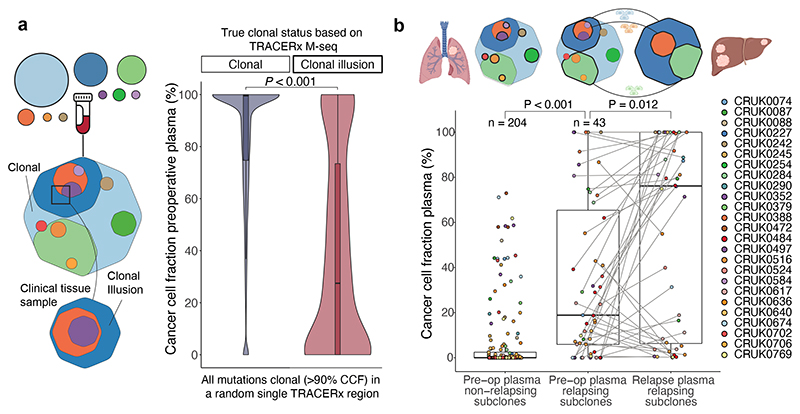
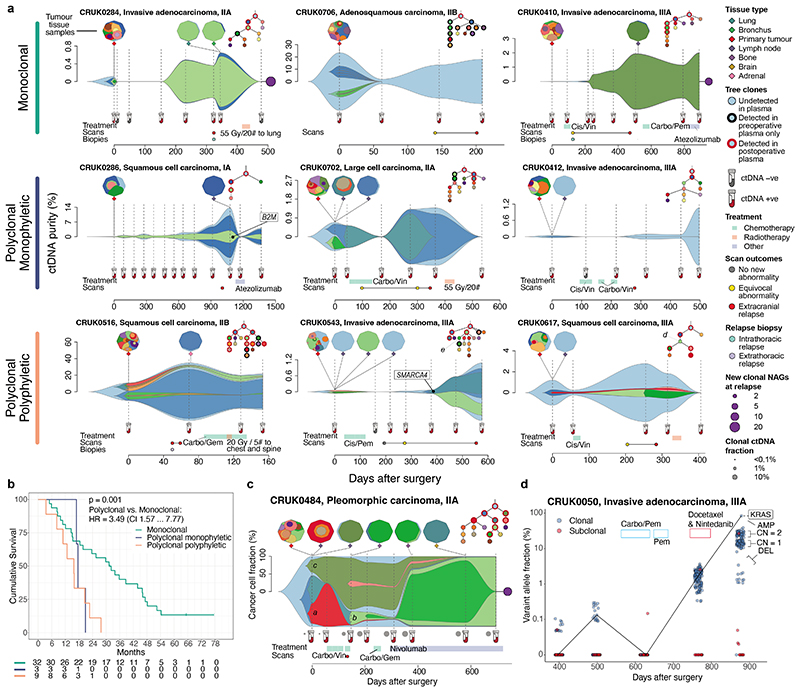
Circulating tumour DNA (ctDNA) can be used to detect and profile residual tumour cells persisting after curative intent therapy1. The study of large patient cohorts incorporating longitudinal plasma sampling and extended follow-up is required to determine the role of ctDNA as a phylogenetic biomarker of relapse in early-stage non-small-cell lung cancer (NSCLC). Here we developed ctDNA methods tracking a median of 200 mutations identified in resected NSCLC tissue across 1,069 plasma samples collected from 197 patients enrolled in the TRACERx study2. A lack of preoperative ctDNA detection distinguished biologically indolent lung adenocarcinoma with good clinical outcome. Postoperative plasma analyses were interpreted within the context of standard-of-care radiological surveillance and administration of cytotoxic adjuvant therapy. Landmark analyses of plasma samples collected within 120 days after surgery revealed ctDNA detection in 25% of patients, including 49% of all patients who experienced clinical relapse; 3 to 6 monthly ctDNA surveillance identified impending disease relapse in an additional 20% of landmark-negative patients. We developed a bioinformatic tool (ECLIPSE) for non-invasive tracking of subclonal architecture at low ctDNA levels. ECLIPSE identified patients with polyclonal metastatic dissemination, which was associated with a poor clinical outcome. By measuring subclone cancer cell fractions in preoperative plasma, we found that subclones seeding future metastases were significantly more expanded compared with non-metastatic subclones. Our findings will support (neo)adjuvant trial advances and provide insights into the process of metastatic dissemination using low-ctDNA-level liquid biopsy.

Trial registration: ClinicalTrials.gov NCT01888601.


Conflict of interest statement

Declarations of interest

C.A. has received speaking honoraria or expenses from AstraZeneca and Bristol Myers Squibb and reports employment at AstraZeneca. C.A. and C.S. are inventors on a European patent application relating to assay technology to detect tumour recurrence (PCT/GB2017/053289). This patent has been licensed to commercial entities and under their terms of employment C.A and C.S are due a revenue share of any revenue generated from such license(s). C.A. and C.S.. declare a patent application (PCT/US2017/028013) for methods to detect lung cancer. A.M.F., C.A. and C.S. are named inventors on a patent application to determine methods and systems for tumour monitoring (PCT/EP2022/077987). C.A., C.S., K.L., C.P., T.H., L.J., M.R.S, A.G., and A.L., are named inventors on a provisional patent protection related to a ctDNA detection algorithm. S.V is a co-inventor to a patent of methods for detecting molecules in a sample (U.S. Patent # 10,578,620). T.H., A.G., M.M, A.C., A.S., A.O., L.J., P.K., M.R.S, R.D..D., A.L. and J.S. are former or current employees of Invitae or ArcherDx and report stock ownership. D.B. reports personal fees from NanoString and AstraZeneca and has a patent (PCT/GB2020/050221) application on methods for cancer prognostication. M.A.B. has consulted for Achilles Therapeutics.D.A.M reports speaker fees from AstraZeneca, Eli Lilly and Takeda, consultancy fees from AstraZeneca, Thermo Fisher, Takeda, Amgen, Janssen, MIM Software, Bristol-Myers Squibb and Eli Lilly and has received educational support from Takeda and Amgen. N.G-H., A.L-H, H.B., D.H., D.S., and J.C.B., report stock ownership and employment at AstraZeneca. A.Ha. has received fees for being a member of Independent Data Monitoring Committees for Roche-sponsored clinical trials, and academic projects co-ordinated by Roche. C. T. H. has received speaker fees from AstraZeneca. M.J-H. has consulted for, and is a member of, the Achilles Therapeutics Scientific Advisory Board and Steering Committee, has received speaker honoraria from Pfizer, Astex Pharmaceuticals, Oslo Cancer Cluster, and is co-inventor on a European patent application relating to methods to detect lung cancer (PCT/US2017/028013). This patent has been licensed to commercial entities and under terms of employment M.J-H. is due a share of any revenue generated from such license(s).N.J.B. is a co-inventor to a patent to identify responders to cancer treatment (PCT/GB2018/051912), has a patent application (PCT/GB2020/050221) on methods for cancer prognostication and a patent on methods for predicting anti-cancer response (US14/466,208). H.J.W.L.A. acknowledges financial support from NIH (NIH-USA U24CA194354, NIH-USA U01CA190234, NIH-USA U01CA209414, and NIH-USA R35CA22052), and the European Union - European Research Council (HA: 866504). H.J.W.L.A. has also received personal fees and stock from Onc.AI, Sphera LLC and Love Health Inc, and speaking honoraria from Bristol Myers Squibb. K.L. has a patent on indel burden and CPI response pending and speaker fees from Roche tissue diagnostics and Ellipses Pharmaceuticals, research funding from CRUK TDL/Ono/LifeArc alliance, Genesis Therapeutics and consulting roles with Monopteros Therapeutics and Kynos Therapeutics (all outside of this work). N.M. has received consultancy fees and has stock options in Achilles Therapeutics. N.M. holds European patents relating to targeting neoantigens (PCT/EP2016/059401), identifying patient response to immune checkpoint blockade (PCT/EP2016/071471), determining HLA LOH (PCT/GB2018/052004), predicting survival rates of patients with cancer (PCT/GB2020/050221). C.S. acknowledges grant support from AstraZeneca, Boehringer-Ingelheim, Bristol Myers Squibb, Pfizer, Roche-Ventana, Invitae (previously Archer Dx Inc - collaboration in minimal residual disease sequencing technologies), Ono Pharmaceutical, and Personalis. He is an AstraZeneca Advisory Board member and Chief Investigator for the AZ MeRmaiD 1 and 2 clinical trials and is also Co-Chief Investigator of the NHS Galleri trial funded by GRAIL and a paid member of GRAIL's Scientific Advisory Board. He receives consultant fees from Achilles Therapeutics (also SAB member), Bicycle Therapeutics (also a SAB member), Genentech, Medicxi, Roche Innovation Centre – Shanghai, Metabomed (until July 2022), and the Sarah Cannon Research Institute C.S has received honoraria from Amgen, AstraZeneca, Pfizer, Novartis, GlaxoSmithKline, MSD, Bristol Myers Squibb, Illumina, and Roche-Ventana. C.S. had stock options in Apogen Biotechnologies and GRAIL until June 2021, and currently has stock options in Epic Bioscience, Bicycle Therapeutics, and has stock options and is co-founder of Achilles Therapeutics. C.S. holds additional patent applications related to targeting neoantigens (PCT/EP2016/059401), identifying patient response to immune checkpoint blockade (PCT/EP2016/071471), determining HLA LOH (PCT/GB2018/052004), predicting survival rates of patients with cancer (PCT/GB2020/050221), identifying patients who respond to cancer treatment (PCT/GB2018/051912) and both a European and US patent application related to identifying insertion/deletion mutation targets (PCT/GB2018/051892).

Figures

Extended Figure 1
Extended Figure 1. TRACERx ctDNA cohort sequencing parameters.
A. Stacked bar plot of patient specific panels (PSPs) designed from primary tumour sequencing data showing the number of clonal (dark red) and subclonal (light red) variants per panel. Variants lacking clonality information are displayed in grey (median of 3 variants per patient [1-20], these mutations are either no longer called by TRACERx or called by ArcherDx but not TRACERx, see methods). A median of 126 clonal variants (range 21 to 195) and 64 subclonal variants (range 0 to 174) were tracked by the PSPs. Clonality was determined by PyClone analyses of multi-region exome data derived from primary resections of NSCLC (methods), in the absence of PyClone data, variants present in all multi-region sequenced tumour samples were called clonal. B. Violin plot demonstrating the % of subclonal clusters derived from multi-region tumour exome data tracked by PSPs on a per patient basis. A median of 88% of the subclonal mutation clusters present in each patient's multi-region exome derived phylogenetic tree were tracked [range 0-100]. 184 tumours with phylogenetic trees were included. C. Distribution of cfDNA input values for the cohort, median input of 23ng, n=1069 samples. Capping at 60ng input was performed for some of the cohort explaining the peak at this value; for the remainder of the cohort, all cfDNA extracted was input into the assay (colours represent different cfDNA input categories as indicated). D. Histogram demonstrating the distribution of per-variant unique sequencing depth values across the cohort; unique depth refers to error-controlled depth achieved across a position targeted by a PSP (at least 5 unique molecular identifier (UMI) matched reads required to create a consensus error-controlled read, see methods). The median unique depth per-variant tracked by a PSP was 2226x (range 0 to 53789x, n=201910). E. Correlation between cfDNA input (ng, Y axis) into the assay and the median UMI-corrected depth achieved across a PSP across 1069 plasma timepoints (X axis). Spearman's R value = 0.63 and two-sided P value < 2.2e-16. F. Association between median deduplication ratio achieved in a sample (Y-axis) and cfDNA input into the assay (ng, X-axis); duplication ratio refers to the median number of duplicate UMI-supported reads within a read family. Resequencing of samples where the median duplication ratio was less than 10 was performed where possible to maximise recoverable information from cfDNA samples, given that 5 UMI-supported reads are required to make a UMI family. 17 of 1069 evaluated cfDNA samples exhibited a final median deduplication ratio less than 5 (corresponds to the horizontal line on the plot). Colours correspond to different cfDNA input categories and match panel ©. G-H. Boxplots demonstrating the error rates (%, Y axis) per each of 96 mutation trinucleotide contexts (X axis, 192 mutation trinucleotide contexts [TNCs] simplified to 96 reverse-complement identical mutation types), plots divided by transition event (G) and transversion event (H). Background position data from n=1069 cell-free DNA libraries utilised to generate plots, variants predicted to exhibit low background error rates from pilot data analyses were prioritised for PSP design. Hinges correspond to first and third quartiles, whiskers extend to the largest/smallest value no further than 1.5x the interquartile range. Centre lines represent medians.
Extended Figure 2
Extended Figure 2. MRD calling thresholds and analytical validation.
A-D. Postoperative MRD caller P values (one-sided Poisson test, see methods) observed in pilot-phase of the project. A. n=5 patients who did not have recurrence of their NSCLC; all n=55 patient samples had caller P values in excess of P > 0.1 threshold meaning that they were deemed negative for ctDNA. B. Postoperative caller P values observed in n=5 patients who had relapse of their NSCLC. 1 of 13 calls was made between caller P values of 0.1 and 0.01, the remaining 12 calls were made at a caller P value less than 0.01. C. Preoperative ctDNA calls from pilot cohort; 7 patients had positive ctDNA in plasma prior to surgery, all calls were made at caller P values <0.01. D. In-silico simulation analysis to assess MRD caller specificity. 3157 mock MRD panels were generated within the evaluable pilot patient libraries and MRD caller P values were assessed. At a caller P value <0.1 threshold, 121/3157 simulated mock panels were ctDNA positive (in-silico specificity of 96.2%); at a caller P value threshold <0.01, 22/3157 simulated mock panels were ctDNA positive (in-silico specificity of 99.3%). E-F. Analytical validation of 50 variant MRD detection panels. E. Fragmented DNA with a known single nucleotide polymorphism (SNP) profile was spiked into a second background of fragmented DNA with a different SNP profile and a patient-specific panel targeted 50 alternate positions present in spiked-in DNA. 559 data points were generated across different DNA input quantities indicated, to establish the limit of detection plots. The Y axis and centre of the error bars demonstrate sensitivity (defined as the proportion of all repeats that resulted in MRD detection using a caller P value of 0.01). The confidence intervals on the plot are Clopper-Pearson confidence intervals (95% CIs). The X axis shows the quantity of variant germline DNA that was spiked into each repeat expressed as a percentage of total DNA in that sample. F. Circulating tumour DNA samples with high variant allele fractions were spiked into a different cell-free DNA background. Variant positions in ctDNA were targeted with a 50 variant panel; 100 data points were generated across the DNA input quantities indicated. Axes and error bars are the same as (E). G. Data from analyses of 48 blank samples donated by 24 healthy participants, caller P values are displayed. H. Barplots demonstrating the intended allele frequencies and the measured allele frequencies in the different spike-ins presented in part (E) and part (F) only data from variant DNA positive samples are presented. The colours of the barplot represent different DNA input masses as shown by the legend. The error bars on the plot represent the mean value of all positive spike-in samples +/- standard deviation of the values. Where the error bar is absent, this is because at this spike-in level and DNA input mass, only one positive sample was observed. Where the error bar led to an observed mean AF less than 0, the error bar was stopped at 0 for visualisation purposes (the 0.05% spike-in, 2ng input mass case). The horizontal dashed lines correspond to 0.1%, 0.05%, and 0.01% spike-in categories. Each data point is represented on the plots by a circle. n=369 variant DNA positive samples displayed in LOD1 barchart, n=93 variant DNA positive samples displayed in LOD2 barchart. I. Comparison between the content of cell-free DNA input into ddPCR reactions (yellow) and AMP PCR reactions (blue). Hinges correspond to first and third quartiles, whiskers extend to the largest/smallest value no further than 1.5x the interquartile range. Centre lines represent medians. Each dot on the plot represents a data point, lines connect paired samples from the same patient. Significantly more cell-free DNA was input into ddPCR reactions (paired two-sided Wilcoxon-test P=0.01366). J. Orthogonal comparison between ctDNA detection based on AMP panels used in TRACERx and ddPCR against a single clonal variant. ddPCR ctDNA positive call threshold was two mutant droplets (bottom table) and one mutant droplet (top table). Percentage positive agreement (PPA) and percentage negative agreement (NPA) using ddPCR as the comparator is displayed in the table. Two-sided Fisher's test P values are demonstrated under the cross tables. K. A 300 mutation patient-specific panel was designed and applied to 10ng DNA samples containing spike-in variant levels from 0% to 0.1%. In silico sub-sampling of the 300 mutations was performed (3 x 200 mutation in silico panels, 3x 100 mutation in silico panels and 3x 50 mutation in silico panels, see methods) and sensitivities are categorised by the number of mutations targeted by the panel.
Extended Figure 3
Extended Figure 3. Preoperative ctDNA detection
A. Flow diagram demonstrating different cohorts analysed in this manuscript; the top part of the flow diagram shows the total number of plasma samples that were intended to be analysed (n=1095 from 197 patients) which reduced to 1069 samples due to single nucleotide polymorphism mismatches between cfDNA and tissue exome data in 26 cases, suggesting sample swap. These samples were analysed in 3 main cohorts, the pilot cohort (left), the preoperative cohort (middle), and the postoperative cohort (right). The postoperative cohort was divided into different categories based on landmark evaluability (relating to samples donated within 120 days of surgery to enable a landmark ctDNA analysis). B. Heatmap demonstrating individual tumour-specific clonal ctDNA fractions in patients with synchronous primaries diagnosed at baseline. The annotation rows of the heatmap show the ctDNA call present in that sample across all variants interrogated by the MRD caller, the highest pathological TNM stage, the individual histology, and individual tumour volumes of the two synchronous tumours present at baseline (for this category, grey represents absent data or volume unevaluable). C. Boxplot demonstrating the difference in pack-year history across 187 preoperative ctDNA positive NSCLC patients and preoperative ctDNA negative NSCLC patients. Hinges correspond to first and third quartiles, whiskers extend to the largest/smallest value no further than 1.5x the interquartile range. Centre lines represent medians. P value represents a Wilcoxon-test. D. Kaplan-Meier curves demonstrating freedom from recurrence outcomes in ctDNA high (dark red), ctDNA low (blue), and ctDNA negative (grey) single primary adenocarcinoma patients (left) and single primary non-adenocarcinoma patients (right). ctDNA high and low were categorised based on median clonal ctDNA levels across ctDNA positive cases and relate to above and below 0.16%. Log-rank P values are displayed on each plot. E. Multivariable Cox regression analyses of Overall Survival (OS) and Freedom From Recurrence (FFR, defined as recurrence only) in patients with single (non-synchronous) NSCLC; evaluating ctDNA detection status, pTNM stage (Tumour Node Metastasis pathological stage version 7, categories I, II or III), whether adjuvant therapy was administered, age, and log10-transformed unique sequencing depth as predictors in adenocarcinomas and non-adenocarcinomas separately. Unique sequencing depth was included to adjust for under sequenced samples, representing potential false negatives. n=88 adenocarcinoma patients and n=81 non-adenocarcinoma patients were analysed for FFR and OS. On the forest plots, the diamond represents the multivariable Hazard Ratio (HR) with error-bars corresponding to 95% confidence intervals (CI). Multivariable P values (p) are displayed on the plot alongside the number of patients in each category (N). Reference categories were ctDNA positive patients, pTNM stage I patients and patients given adjuvant therapy. The exact Cox regression P value for the Outcome: ctDNA -ve category in the FFR adenocarcinoma plot = 0.00022. F. Heatmap showing the site of relapse in recurrent adenocarcinoma cases divided by whether preoperative ctDNA was detected (dark red, right) or undetected (grey, left). Intrathoracic (mediastinum, locoregional, ipsilateral lung, distant lung – green colours) or extrathoracic (bone, brain, liver, adrenal, extrathoracic lymph nodes or other extrathoracic site – red colours) sites of relapse are shown (sites shown are metastatic sites diagnosed within 180 days of clinical relapse). Heatmap is annotated by Tumour Node Metastasis pathological version 7 stage. G. Kaplan-Meier curve demonstrating post-relapse survival in recurrent adenocarcinoma patients stratified by preoperative ctDNA positive (red) or preoperative ctDNA negative (grey). Log-rank P value is displayed on the plot.
Extended Figure 4
Extended Figure 4. Volume and phenotypic analysis of ctDNA positive and ctDNA negative adenocarcinomas.
A. Flow chart demonstrating patients available for volumetric analyses and reasons for exclusion. B. Histogram showing the number of NSCLC cases by volume, with ctDNA positive samples shown as red bars, and ctDNA negative samples shown as grey bars. n=150 volume evaluable cases. C. Volume versus log10-transformed clonal ctDNA level correlation plot with each individual TRACERx case that was ctDNA positive as a point and coloured by adenocarcinoma status (dark red) and squamous or other histology (dark blue). Fitted line represents a linear model line categorised by tumour histology. Below the correlation plot is a table describing a linear multivariable model based on these data to predict log10-transformed clonal ctDNA levels based on tumour volume and histology (adenocarcinoma and squamous and other categories). P values represent linear model adjusted P values, n=96 ctDNA positive, volume evaluable NSCLCs analysed. D. Based on a multivariable linear regression model fitted to the data in (C), we categorised ctDNA negative adenocarcinomas as biological low-shedders or technical non-shedders (see methods). If a particular tumour volume resulted in an estimated clonal mutation ctDNA level above the clonal ctDNA level a library could detect (95% lower confidence interval for estimated clonal ctDNA level based on tumour volume is above detectable clonal ctDNA level in the preoperative cfDNA library from that patient), then the case was classed as a probable biological low-shedder (red on histogram); otherwise, the case was classed as a probable technical non-shedder (turquoise on histogram). Y axis represents the lower 95% confidence estimate for clonal mutation ctDNA level divided by the minimally detectable clonal mutation ctDNA level (MDCL) for that patient's panel. The X axis is each individual patient analysed. Data from n=47 ctDNA negative adenocarcinomas presented. E. Violin box-plots comparing tumour purity in ctDNA low-shedder adenocarcinomas (blue, n = 79 tumour regions from 28 patients) and ctDNA positive adenocarcinomas (red, n = 166 tumour and lymph node regions from 35 patients). Pairwise comparisons are performed using linear mixed-effects models, P values are two-sided. Boxplot hinges correspond to first and third quartiles, whiskers extend to the largest/smallest value no further than 1.5x the interquartile range and centre lines represent medians. Violins represent the distribution of the underlying data. F. Barplots showing gene-level driver alterations between ctDNA positive adenocarcinomas (n = 39 patients) and ctDNA negative low-shedder adenocarcinomas (n = 31 patients). Colours denote ctDNA detection status. Y axis shows the top 14 most frequently altered genes, X axis shows the percentage of patients carrying an alteration in the gene per detection category. NS: Not significant (two-sided Fisher's exact test with FDR P value adjustment). G. Pathway-level driver mutations between ctDNA positive adenocarcinomas (n = 39 patients) and ctDNA negative low-shedder adenocarcinomas (n = 31 patients). X axis shows patient IDs, Y axis shows pathways following the Sanchez-Vega definition. Top bar denotes ctDNA detection status (dark red represents ctDNA positives, blue represents biological low-shedders). Heatmap colours display mutations; blue denote clonal mutations and red denote subclonal mutations. No pathway showed significant enrichment in either ctDNA shedder or non-shedder adenocarcinomas (NS: Not significant, using two-sided Fisher’s exact test with FDR P value adjustment). H. Whole genome doubling status per tumour comparing ctDNA positive adenocarcinomas to ctDNA negative low-shedder adenocarcinomas, using two-tailed Fisher's exact test. Yellow represents the number of tumours subjected to whole genome doubling in at least one region, turquoise represents tumours without any whole genome doublings. I. Volume by ctDNA shedding status. Biological non-shedders in red represent the smallest quartile samples. After removal of these from the analysis, no significant difference in tumour volume was found between ctDNA positives and ctDNA low-shedders. Pairwise comparisons are made with two-sided Wilcoxon-tests. J. Venn diagram showing the overlap between significantly differentially expressed genes between ctDNA positive and ctDNA low shedder adenocarcinomas obtained from the full dataset, relative to the volume-adjusted dataset. Comparisons are made by computing the Jaccard similarity index and the corresponding two-sided P value using the exact method. K. Venn diagram showing the overlap between significantly altered cytobands as called by GISTIC, comparing ctDNA positive to ctDNA low shedder adenocarcinomas obtained from the full dataset, relative to the volume-adjusted dataset. Statistical testing follows (J).
Extended Figure 5
Extended Figure 5. Exploration of unexpected MRD positive results in non-relapse patients.
A. Table demonstrating details of unexpected ctDNA positive results in patients who did not suffer disease recurrence. B. CRUK0498 false positive analysis: Dot-plots represent confidently detected variants at illustrated cfDNA sampling timepoints (left panel), variants confidently detected in normal tissue, control DNA, and peripheral-blood mononuclear cell (PBMC, buffy-coat) DNA based on application of CRUK0498's patient specific panel to these respective samples (middle panel) and the mutant allele frequencies of selected variants in tumour tissue exome data (right panel). The four variants in the legend (variants in genes ATP2C1, DDIT4L, EYS, and TUSC3) represent variants confidently called at 50% or more of the timepoints across the cfDNA samples (note that confidently called means an individual variant Poisson one-sided P value of <0.01 [generated by MRD caller, see methods]). C. A haematoxylin and eosin image from patient CRUK0498's tumour where exome analysis detected the variants in genes ATP2C1, DDIT4L, EYS at high variant allele-frequencies. This image shows a dense lymphocyte aggregate in this tumour region. Scale bar below image. A single image was analysed. D. A further 19 preoperative PBMC samples were analysed from TRACERx patients; no confident panel-wide variant DNA calls were made in these patients' PBMC samples using the MRD calling algorithm. E. Variant-level analyses of the preoperative samples analysed in panel (D) highlighted that 12 of 3621 variants interrogated by the panels were detected (variant level one-sided Poisson P value <0.01). 8 of 12 detected variants were removed from the MRD caller algorithm in cell-free DNA analyses (cfDNA) due to triggering filters highlighted in the heatmap annotation. Only 2 of the 4 remaining variants carried deep alternate reads in the respective patients' preoperative cfDNA sample (red arrows). The heatmap shows the cfDNA variant allele frequency and the WBC variant allele frequency of the detected variants (grey colour represents no detection of the variant). Two mistargeted germline variants are highlighted by black arrows for patient CRUK0296, variants were targeted in error by the industry panel design pipeline but not by the TRACERx exome pipeline (methods), and were filtered from the MRD calling algorithm due to triggering the outlier filter (dao imbalance filter, dark red).
Extended Figure 6
Extended Figure 6. Expanded postoperative ctDNA and imaging surveillance analysis.
A. Analysis of 13 patients who experienced intracranial relapse who were positive for ctDNA in a postoperative blood sample. The X axis shows the clonal ctDNA level at the point of postoperative ctDNA detection and the Y axis shows the day of postoperative ctDNA detection. Points are coloured based on whether the intracranial relapse was solitary (green), accompanied by another extracranial site (red), or unconfirmed solitary (blue, no extracranial imaging performed) and are shaped by landmark ctDNA status. B. Heatmap of clonal mutation ctDNA level data at first postoperative ctDNA detection. The annotation rows show the landmark ctDNA status of the patient (landmark positive, ctDNA detected within 120 days postoperatively; landmark negative, ctDNA negative within 120 days postoperatively; unevaluable, landmark status cannot be established), the day ctDNA was detected postoperatively, the histology of the primary tumour, and lead time (days from ctDNA detection to clinical relapse). Where lead time was not applicable (for example incompletely resected disease, ctDNA detected post-relapse, see methods) lead time is coloured grey. The next two rows (bar charts) demonstrate the number of clonal or subclonal mutations tracked by an AMP patient-specific panel (PSP); if the bar is blue, it represents confident detection of an individual variant (based on an individual variant P value of <0.01 [one sided Poisson test based on MRD caller output, see methods]), if the bar is black, it represents absence of confident calling of a variant, if the bar is red, it represents that a variant was filtered by the MRD calling algorithm. The final row represents the mean clonal ctDNA level at the first ctDNA detection time point for a patient. This is on a log-10 scale as displayed in the heatmap legend. For patient CRUK0296, ctDNA detection occurred but clonal ctDNA levels were 0% (grey bar) as the mutation driving ctDNA detection postoperatively did not have a clonal status. C Longitudinal per-patient plots in 12 patients who were ctDNA positive prior to adjuvant therapy. Plots are annotated with lead time (L-t), scans performed, and treatment administered (see legend). The Y axis represents clonal ctDNA levels and each circle on the plot represents a blood sampling time point. If the circle is red, it indicates that the blood sample was positive for ctDNA using the MRD caller. The X axis displays days post-surgery. D-E. Kaplan-Meier curves in the landmark evaluable population (patients who donated blood within 120 days post-surgery before treatment or clinical recurrence, n=102/108 landmark evaluable patients were evaluable for survival analysis, see methods for exclusions) showing overall survival (OS,D) or freedom from recurrence (FFR,E) outcomes for landmark positive (dark red) versus landmark negative (grey) patients. Log-rank P values displayed on curves. F. Boxplots showing the distribution of lead times (times from ctDNA detection to clinical recurrence) categorised by patient landmark ctDNA status. Hinges correspond to first and third quartiles, whiskers extend to the largest/smallest value no further than 1.5x the interquartile range. Centre lines represent medians. Kruskal-Wallis test P=0.0057, unadjusted pairwise Wilcoxon-tests compare individual categories, n=63 patients analysed. G. Pie charts demonstrate the number of occurrences of specified ctDNA detection statuses (red – ctDNA negative, green – ctDNA positive, blue – no ctDNA status established), preceding a scan showing no new changes (left) or new equivocal extracranial changes (middle). The ctDNA positive and negative categories are then broken down further into a patient-level analysis showing the outcomes of patients who experienced the occurrence of the specified imaging and ctDNA status event(s). H. Barchart showing the count of specific equivocal anatomical sites noted on scans showing new equivocal changes; equivocal lung lesions and lymph nodes were the most common abnormal equivocal findings on NSCLC surveillance imaging. Multiple equivocal sites can be observed on one scan. I. Barplot of eventual site of relapse and ctDNA status in 33 patients with ctDNA status established prior to surveillance imaging, showing new equivocal lymph node enlargement. The X axis shows the patient ctDNA detection status preceding surveillance scans. The Y axis shows the patient count. Patient CRUK0090 exhibited occurrences of both negative and positive ctDNA statuses prior to separate equivocal lymphadenopathy scans, so is present in both ctDNA positive and negative categories. Other patients are only included once. Patient CRUK0234 was diagnosed with an unresected lymph node, was ctDNA negative postoperatively and included in the analysis. The barcharts are filled with recurrence status of patients in these categories. Recurred with LN refers to lymph node involvement at relapse (dark red colour). Recurred with no LN refers to recurrence with no lymph node involvement (green colour).
Extended Figure 7
Extended Figure 7. ECLIPSE methodology.
A. A conceptual overview of the ECLIPSE method and data input types. CCF; cancer cell fraction and VAF; variant allele fraction. B. Equation to calculate tumour purity (the % of cells from which the DNA was derived which are tumour cells, see supplementary note 1, also termed 'cellularity' or 'aberrant cell fraction') using clonal mutations. C. Equation to calculate cancer cell fraction (CCF). Multiplicity = the number of mutated DNA copies in each mutated cell, CNt = total copy number in the tumour, CNn = total copy number in normal (non-tumour) cells, VAF = variant allele fraction, P = tumour purity (the % of cells from which the DNA was derived which are tumour cells, see Supplementary Note 1). D. Percentage change in mean multiplicity of clonal mutations comparing measurements in surgical excised tissue samples to tissue samples taken at relapse (46 patients with paired primary and recurrence tissue samples plotted). E. A comparison between mean clonal VAF of mutations and ctDNA tumour purity as calculated by ECLIPSE where data points (plasma samples) are coloured by the average copy number of tracked clonal mutations (measured using tissue sequencing). Multi-tumour patients and samples with evidence of copy number of instability at relapse are excluded. A total of 322 samples from 134 patients are plotted.
Extended Figure 8
Extended Figure 8. Subclone detection sensitivity of ECLIPSE.
A. Minimally detectable CCF for each ctDNA positive sample compared to clonal ctDNA levels for each sample. All ctDNA positive samples included (N=354). Minimally detectable CCF was calculated using the minimum number of required reads for a positive (P<0.01) clone detection call (methods). B. Minimally detectable CCF over time for each patient with a horizontal line indicating the threshold for high subclone sensitivity samples (20% CCF). All ctDNA positive samples included (N=354). 61% of preoperative MRD positive samples were considered high subclone sensitivity and 66% of postoperative samples were considered of high subclone sensitivity (overall 64% of samples). C. A histogram of clonal ctDNA levels for all ctDNA positive samples (N=354) with vertical lines indicating thresholds for ECLIPSE evaluability and for traditional clonal deconvolution evaluability used for TRACERx tissue samples and previous clonal deconvolution approaches in ctDNA,. D. A histogram of maximum clonal ctDNA levels observed in post-operative samples for each patient with vertical lines indicating thresholds for ECLIPSE evaluability and for traditional clonal deconvolution evaluability (see C). This is shown for 66 patients who relapsed with ctDNA positive postoperative plasma. E. Validation of ECLIPSE detection rates across varying subclonal mutation number, clonal ctDNA level, subclone cancer cell fraction and DNA input amount into the assay. Subclones were constructed using ground truth in vitro spike-in experiments with 10-12 technical replicates for each input mass-allele fraction combination. These ground truth mutant allele fractions were then mixed in silico to construct 76,263 subclones varying across these parameters. Data from these experimentally derived subclones were then run through ECLIPSE and subclone detection rates across each of these parameters depicted.
Extended Figure 9
Extended Figure 9. Time-matched comparisons between subclonal structure measured in plasma and in tissue at surgery.
A. Correlation between cancer cell fractions (CCFs) as measured in preoperative plasma samples with phylogenetic data, >0.1% clonal ctDNA level & >=10ng DNA input (high subclone sensitivity samples) with ECLIPSE and those measured with multi-region tissue sequencing (M-seq) at surgery (N=71 patients and 684 subclones included). B. Copy number unaware CCFs calculated only using VAFs (methods) compared to tissue CCF from M-seq. All preoperative samples with phylogenetic data, >0.1% clonal ctDNA level & >=10ng DNA input (high subclone sensitivity samples) were included (N=71 patients and 684 subclones included). C. A scatter plot demonstrating the relationship between clonal ctDNA level and the proportion of multi-region tumour exome (M-seq) defined subclones detected by ECLIPSE based on varying subclonal cancer cell fractions as indicated, loess lines are fitted to the plots, n= 117 ctDNA positive preoperative samples. D. A comparison of pre-operative plasma CCFs and the average CCFs across all tissue regions sampled at surgery for clones that were unique to one tumour tissue region and for clones that were distributed across more than two tumour tissue regions. N=71 patients and 684 subclones included. A Wilcoxon-test was used to compare groups. E. A comparison of pre-operative plasma CCFs and the average CCFs across all tissue regions sampled at surgery for clones that were unique to one tumour tissue region separated between small (<20cm3), medium (>20cm3 & <100cm3), and large (>100cm3) tumours as measured on pre-operative PET/CT scans. N=71 patients and 684 subclones included. A Wilcoxon-test was used to compare groups. F. A comparison of detection rates in pre-operative plasma for 20% CCF subclones across a range of clonal ctDNA levels split by whether the subclones were spread across multiple primary tumour tissue regions or were limited to only a single primary tumour tissue region. 1924 subclones were assessed in 197 preoperative plasma samples. G. A map of tumour clones with areas of multi-regional tissue sampling indicated and clones which are over- and undersampled highlighted. Most of the undersampled clones are in fact not in the sampled areas creating a bias towards oversampling in clones which we are able to detect, an effect also called the 'winner's curse'. H. A ROC curve describing the sensitivity and specificity of detecting clonal illusion mutations using plasma-based CCFs with 95% confidence intervals generated using bootstrapping across 500-fold cross-validation (N= 71 tumours).
Extended Figure 10
Extended Figure 10. Clonal composition measurements in ctDNA after surgery.
A. An overview of clonal structure evaluability at relapse for TRACERx patients in our cohort (N = 75 tumours) using either cell-free DNA and ECLIPSE or relapse tissue and WES/PyClone. B. ctDNA detection status post-operatively of subclones split by detection status in metastatic tissue. Untracked subclones (those without any mutations included in the PSP panels) were excluded (N = 26 tumours). P value indicates the result from Fisher's exact test. C. Clonal (estimated as present in 100% of tumour cells) vs subclonal (estimated as present in <100% of cells) status at relapse of primary tumour subclones by whether they were detected in cfDNA and metastatic tissue or cfDNA alone (N = 26 tumours). P value indicates the result from a Fisher's exact test. D. Metastatic dissemination class determined by tissue and by cfDNA in 22 cases with a metastatic biopsy, a postoperative high subclone sensitivity plasma sample, and a phylogenetic tree constructed. E. Overall survival Kaplan-Meier plot demonstrating time from the first MRD positive timepoint to death stratified by ECLIPSE metastatic dissemination class at relapse (monoclonal: light blue, polyclonal polyphyletic: purple, and polyclonal monophyletic: green). HR: Hazard ratio, CI: confidence interval. 44 patients were included in this analysis. The P value indicates the result of a log-rank test. F. A multivariable Cox proportional hazards model to predict overall survival from the time of first MRD detection including the clonality of metastatic dissemination at relapse, stage, maximum postoperative clonal ctDNA level, average DNA assay input, histology, and whether the first plasma sample after surgery was ctDNA positive, including only relapse patients. 44 patients were included in this analysis. Error bars indicate 95% confidence intervals. G. The frequency of high confidence subclonal to clonal bottlenecks (methods) at the latest possible plasma sample time point with sufficient clonal ctDNA level (high sensitivity subclone samples, N = 44 tumours) and which of these subclones harbour subclonal neoantigens (NAGs) which therefore become clonal at relapse. H. In cases of clonal bottlenecking at relapse, the percentage increase in the number of clonal mutations is shown as a box and whisker plot with the absolute number of new clonal mutations (N = 18 tumours). I. In cases of clonal bottlenecking at relapse, the percentage increase in the number of clonal NAGs is shown as a box and whisker plot with the absolute number of new clonal NAGs (N = 18 tumours). NAG = Neoantigen.
Figure 1
Figure 1. Overview of cohort and ctDNA calling.
A. The ctDNA detection method estimates intra-library, trinucleotide specific sequencing error rates. For calling ctDNA, the number of consensus reads at all positions targeted by a patient specific panel (PSP), that pass described filters are compared to expected error rates. To detect subclones, ECLIPSE evaluates the collective signal across all mutations in each subclone and integrates this with primary-tumour derived copy number information to estimate plasma cancer cell fractions (CCF), clonal sweeps (where a subclone reaches 100% CCF) and metastatic dissemination patterns. The ctDNA analysis approach is described further in Supplementary Note. B. Heatmap of clinical features associated with preoperative ctDNA analyses in non-pilot TRACERx patients (with non-synchronous primary tumours). N2 upstaging row: patients clinically staged with N0/1 lymph-node involvement upstaged to N2 disease by pathology; grey - no pathology staging. pTNM stage row: pathological tumour node metastasis (v7) stage. Volumetrics row: tumour volume (cm3) measured by computed tomography, grey - unevaluable, log10 transformed. Barcharts: mutations tracked by a patient's PSP categorised by clonality; black - mutation undetected (per-variant one-sided Poisson P value >0.01, methods), red - mutation filtered by MRD caller, blue - mutation detected. Clonal ctDNA level: the mean percentage of mutant consensus reads across all clonally mutated positions tracked by a PSP (log10 transformed, methods), patients with 0% level are given a white colour, a non-zero clonal ctDNA level can occur in ctDNA negative patients where signal was insufficient to result in confident detection of ctDNA. C. Kaplan-Meier curves demonstrating overall survival outcomes in ctDNA high (dark red), ctDNA low (blue) and ctDNA negative (grey) non-synchronous adenocarcinoma patients (left) and non-synchronous non-adenocarcinoma patients (right). ctDNA high and low was categorised based on median clonal ctDNA levels across all ctDNA positive NSCLCs (0.16%). Log-rank P values displayed.
Figure 2
Figure 2. Genomic and transcriptomic predictors of ctDNA detection in early-stage NSCLC.
A. Differential gene expression analysis comparing 34 ctDNA positive adenocarcinomas (101 regions) to 28 ctDNA low-shedder adenocarcinomas (62 regions). X axis shows log2 difference in means, Y axis shows two-sided FDR adjusted P values. Statistical testing is carried out by computing moderated t-statistics from a linear model fit to the transformed expression data (methods). Red and blue: genes significantly over-expressed in ctDNA positives and ctDNA low-shedders (technical non-shedders excluded), respectively. Top 15 genes are labelled per detection category. B, C. Reactome pathway enrichment analysis based on the 1,759 significant genes found in A. Y axis lists pathways, X axes shows proportion of genes involved. B. Top 15 pathways in ctDNA positives. C. The only significantly enriched pathway in ctDNA low-shedders. Size: gene count, colour: one-sided hypergeometric P value. D. Differential enrichment analysis based on the Hallmark gene-sets. Samples, axes and colours follow A. E. ORACLE gene expression scores in ctDNA positive (35 patients, 109 regions) versus ctDNA negative (42 patients, 87 regions) adenocarcinomas. Centre lines show medians. Colours follow A. F, G. Violin-boxplots showing wGII and FLOH levels of ctDNA positive adenocarcinomas (35 patients, 166 regions), ctDNA low-shedder adenocarcinomas (28 patients, 79 regions) and squamous or other carcinomas (74 patients, 303 regions). Hinges correspond to first and third quartiles, whiskers extend to the largest/smallest value no further than 1.5x the interquartile range. Center lines represent medians. H, I. GISTIC score analysis comparing 35 ctDNA positives (166 regions) and 28 ctDNA low-shedders (79 regions). Red: amplifications, blue: deletions, grey: non-significant values. Y axis: one-sided P values computed by GISTIC 2.0's permutation-based statistical methods, X axis: GISTIC score difference. Dotted lines: G-score and significance cutoffs. Pairwise comparisons are performed using linear mixed-effects models, P values are two-sided.
Figure 3
Figure 3. Postoperative Minimal Residual Disease detection in early-stage NSCLC.
A-D. Longitudinal ctDNA data from non-pilot patients with (A) no evidence of non-small-cell lung cancer (NSCLC) recurrence, n=42; (B) development of a second-primary cancer, n=19; (C) recurrence of NSCLC in landmark positive patients, n=25 patients (D) recurrence of NSCLC in landmark negative patients, n=26 patients and (E) recurrence of NSCLC in landmark unevaluable patients, n=19 patients. In all panels, each circle represents a cfDNA sampling time point. Circles to the left of surgical day are preoperative timepoints, circles to the right of surgical day are postoperative timepoints. Black filled circle: positive ctDNA detection. Light blue rectangles: chemotherapy, dark blue rectangles: radiotherapy, orange rectangles: patient received post-recurrence surgery. Triangles represent standard of care postoperative CT, PET or MRI surveillance imaging (imaging up until first relapse or last follow-up displayed on plot). Imaging classified as no disease (grey), equivocal images (yellow), or unequivocal imaging evidence of extracranial relapse (red). Light green triangles: no evidence of intracranial relapse, dark green triangles: intracranial relapse. Vertical black lines: the event date for a patient (if death, second-primary, NSCLC recurrence occurred); otherwise, the vertical line represents last TRACERx follow-up. Crosses: patient death events. To the left of the panels, the annotation plots highlight histology, pTNM (pathological TNM) status, relapse site, and details regarding whether an intracranial relapse was isolated (brain-only) or non-isolated (brain and extracranial site) or occurred without extracranial imaging to confirm solitary status. Relapse site annotation displays anatomical sites of disease identified within an 180 day post-recurrence period.
Figure 4
Figure 4. Clonality measurements in preoperative plasma overcome sampling bias from a single tissue sample and predict metastatic seeding potential.
A. Depiction of a clonal illusion where a dark blue subclone is found in 100% of cells in a single clinical tissue sample. Such clonal illusion mutations may be detected in a clinical setting using ctDNA derived from many different tumour regions to increase accuracy of ITH measurements in the clinic. Mutations which were clonal (CCF > 90%) in a single, randomly selected tumour region are compared using plasma-based preoperative CCFs splitting by those truly clonal across all tumour regions in TRACERx (clonal) and those which, whilst they were clonal in the randomly selected region, were absent from other tumour regions (clonal illusion). Only data from a single randomly selected region was used by ECLIPSE to generate these CCFs. The distribution of plasma CCFs in each case is represented by a violin plot and a box and whisker plot. A Wilcoxon-test was used to compare groups. Only preoperative samples with at least 0.1% clonal ctDNA level (high subclone sensitivity samples, 71 samples from 71 patients) were included in this analysis (Supplementary Note for analysis of lower ctDNA levels). M-seq = Multiregional sequencing. B. Box and whisker plots of preoperative plasma primary tumour subclone CCFs split by whether a given subclone was found to be present or absent in cfDNA samples at relapse and postoperative plasma CCFs for relapse subclones at the last high subclone sensitivity timepoint. Only tumours with at least one sample >0.1% clonal ctDNA level (high subclone sensitivity) both preoperatively and postoperatively were included (N=26 tumours with CCFs from 247 subclones included). Two sided Wilcoxon-tests were used to compare groups.
Figure 5
Figure 5. Longitudinal measurements of clonal evolution in plasma from surgery, through therapy and to recurrence.
A-D. ctDNA purity for each clone is calculated by multiplying the clone CCF by the ctDNA purity of the plasma sample (methods) and represents the fraction of all cells from which cfDNA was derived which harbour a given tumour clone at each timepoint. Clonal nesting is based on the phylogenetic tree for each tumour. Data from all ctDNA positive plasma samples are shown including results from ECLIPSE of samples <0.1% clonal ctDNA level. Clone maps for each tumour tissue mass are depicted above the ctDNA based clonal structure with the phylogenetic tree. Metastatic dissemination class was defined using primary tumour subclones, excluding metastatic unique clones in surgically excised lymph nodes or intrapulmonary metastases (methods). Both CRUK0617 subclone d and CRUK0543 subclone e were not detected in ctDNA but their presence was inferred by detection of its daughter subclones (Supplementary Note). A. Depictions of longitudinal tumour evolution for examples of monoclonal, polyclonal monophyletic and polyclonal polyphyletic metastatic dissemination patterns. B. A Kaplan-Meier plot depicting differences in overall survival between metastatic dissemination classes (N= 44 tumours which had at least 1 high subclone sensitivity postoperative sample). A log-rank test was used to compare survival in the two groups. C. CCFs depicted through time and therapy for CRUK0484 who experienced a polyclonal polyphyletic relapse. D. Variant allele fractions for mutations tracked in CRUK0050 at recurrence. NAG = Neoantigen, Cis = Cisplatin, Vin = Vinorelbine, Carbo = Carboplatin, Pem = Pemetrexed, Gem = gemcitabine, Gy = Gray.

Comment in

Similar articles

Cited by

References

    1. Moding EJ, Nabet BY, Alizadeh AA, Diehn M. Detecting Liquid Remnants of Solid Tumors: Circulating Tumor DNA Minimal Residual Disease. Cancer Discov. 2021;11:2968–2986. doi: 10.1158/2159-8290.CD-21-0634. - DOI - PMC - PubMed
    1. Jamal-Hanjani M, et al. Tracking the Evolution of Non-Small-Cell Lung Cancer. N Engl J Med. 2017;376:2109–2121. - PubMed
    1. Chabon JJ, et al. Integrating genomic features for non-invasive early lung cancer detection. Nature. 2020;580:245–251. doi: 10.1038/s41586-020-2140-0. - DOI - PMC - PubMed
    1. Peng M, et al. Circulating Tumor DNA as a Prognostic Biomarker in Localized Non-small Cell Lung Cancer. Front Oncol. 2020;10:561598. doi: 10.3389/fonc.2020.561598. - DOI - PMC - PubMed
    1. Xia L, et al. Perioperative ctDNA-based Molecular Residual Disease Detection for Non-Small Cell Lung Cancer: A Prospective Multicenter Cohort Study (LUNGCA-1) Clin Cancer Res. 2021 - PubMed

Publication types

MeSH terms

Associated data