

Predicting long-term prognosis after percutaneous coronary intervention in patients with new onset ST-elevation myocardial infarction: development and external validation of a nomogram model
- PMID: 37055777
- PMCID: PMC10103457
- DOI: 10.1186/s12933-023-01820-9
Predicting long-term prognosis after percutaneous coronary intervention in patients with new onset ST-elevation myocardial infarction: development and external validation of a nomogram model
Abstract
Background: The triglyceride glucose (TyG) index is a well-established biomarker for insulin resistance (IR) that shows correlation with poor outcomes in patients with coronary artery disease. We aimed to integrate the TyG index with clinical data in a prediction nomogram for the long-term prognosis of new onset ST-elevation myocardial infarction (STEMI) following primary percutaneous coronary intervention (PCI) .
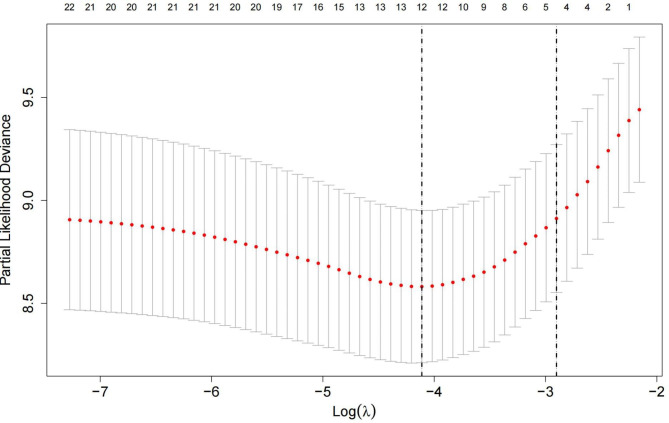
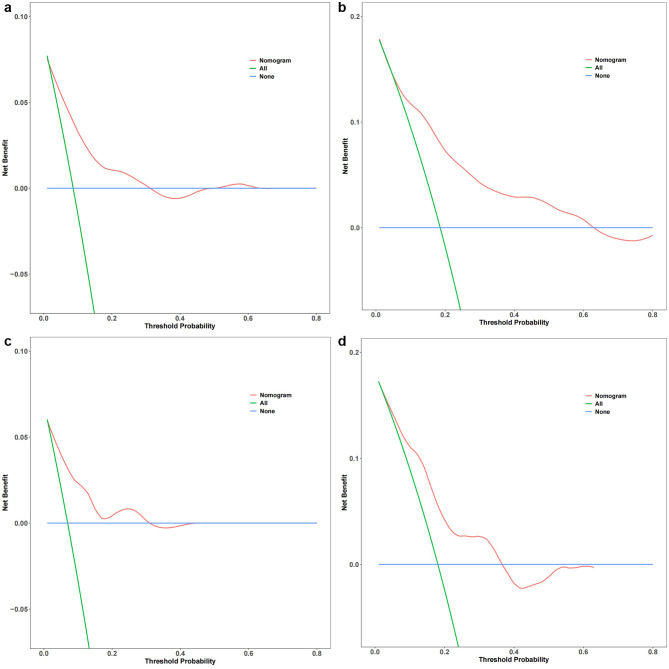
Methods: This retrospective study included new-onset STEMI patients admitted at two heart centers for emergency PCI from December 2015 to March 2018 in development and independent validation cohorts. Potential risk factors were screened applying least absolute shrinkage and selection operator (LASSO) regression. Multiple Cox regression was employed to identify independent risk factors for prediction nomogram construction. Nomogram performance was assessed based on receiver operating characteristic curve analysis, calibration curves, Harrell's C-index and decision curve analysis (DCA).
Results: In total, 404 patients were assigned to the development cohort and 169 to the independent validation cohort. The constructed nomogram included four clinical variables: age, diabetes mellitus, current smoking, and TyG index. The Harrell's C-index values for the nomogram were 0.772 (95% confidence interval [CI]: 0.721-0.823) in the development cohort and 0.736 (95%CI: 0.656-0.816) in the independent validation cohort. Significant correlation was found between the predicted and actual outcomes in both cohorts, indicating that the nomogram is well calibrated. DCA confirmed the clinical value of the development prediction nomogram.
Conclusions: Our validated prediction nomogram based on the TyG index and electronic health records data was shown to provide accurate and reliable discrimination of new-onset STEMI patients at high- and low-risk for major adverse cardiac events at 2, 3 and 5 years following emergency PCI.
Keywords: Major adverse cardiovascular events; Percutaneous coronary intervention; Prediction nomogram; ST-elevation myocardial infarction; Triglyceride glucose index.
© 2023. The Author(s).
Conflict of interest statement
The authors declare that they have no conflict of interests.
Figures


Similar articles
-
Establishment and validation of a risk model for prediction of in-hospital mortality in patients with acute ST-elevation myocardial infarction after primary PCI.BMC Cardiovasc Disord. 2020 Dec 9;20(1):513. doi: 10.1186/s12872-020-01804-7. BMC Cardiovasc Disord. 2020. PMID: 33297955 Free PMC article.
-
Development and validation of a prognostic model for predicting post-discharge mortality risk in patients with ST-segment elevation myocardial infarction (STEMI) undergoing primary percutaneous coronary intervention (PPCI).J Cardiothorac Surg. 2024 Mar 30;19(1):163. doi: 10.1186/s13019-024-02665-3. J Cardiothorac Surg. 2024. PMID: 38555468 Free PMC article.
-
Multimodal data-driven prognostic model for predicting new-onset ST-elevation myocardial infarction following emergency percutaneous coronary intervention.Inflamm Res. 2023 Sep;72(9):1799-1809. doi: 10.1007/s00011-023-01781-5. Epub 2023 Aug 29. Inflamm Res. 2023. PMID: 37644338
-
Construction and evaluation of nomogram model for individualized prediction of risk of major adverse cardiovascular events during hospitalization after percutaneous coronary intervention in patients with acute ST-segment elevation myocardial infarction.Front Cardiovasc Med. 2022 Dec 21;9:1050785. doi: 10.3389/fcvm.2022.1050785. eCollection 2022. Front Cardiovasc Med. 2022. PMID: 36620648 Free PMC article.
-
Diagnostic efficacy of the triglyceride-glucose index in the prediction of contrast-induced nephropathy following percutaneous coronary intervention.Front Endocrinol (Lausanne). 2023 Nov 22;14:1282675. doi: 10.3389/fendo.2023.1282675. eCollection 2023. Front Endocrinol (Lausanne). 2023. PMID: 38075076 Free PMC article.
Cited by
-
Association of the triglyceride glucose index with myocardial ischemia in patients with minimal to moderate coronary artery disease.Sci Rep. 2024 Oct 30;14(1):26093. doi: 10.1038/s41598-024-76530-7. Sci Rep. 2024. PMID: 39478011 Free PMC article.
-
A nomogram based on the TyG index for the prediction of lower-limb venous thrombosis in patients with intracerebral hemorrhage.Sci Rep. 2025 May 19;15(1):17406. doi: 10.1038/s41598-025-01923-1. Sci Rep. 2025. PMID: 40389507 Free PMC article.
-
Insulin resistance assessed by estimated glucose disposal rate and risk of incident cardiovascular diseases among individuals without diabetes: findings from a nationwide, population based, prospective cohort study.Cardiovasc Diabetol. 2024 Jun 6;23(1):194. doi: 10.1186/s12933-024-02256-5. Cardiovasc Diabetol. 2024. PMID: 38844981 Free PMC article.
-
Multimodal Visualization and Explainable Machine Learning-Driven Markers Enable Early Identification and Prognosis Prediction for Symptomatic Aortic Stenosis and Heart Failure With Preserved Ejection Fraction After Transcatheter Aortic Valve Replacement: Multicenter Cohort Study.J Med Internet Res. 2025 May 1;27:e70587. doi: 10.2196/70587. J Med Internet Res. 2025. PMID: 40310672 Free PMC article.
-
Incorporating Inflammation Biomarker-Driven Multivariate Predictive Model for Coronary Microcirculatory Dysfunction in Acute Myocardial Infarction Following Emergency Percutaneous Coronary Intervention.Clin Cardiol. 2024 Oct;47(10):e70032. doi: 10.1002/clc.70032. Clin Cardiol. 2024. PMID: 39429096 Free PMC article.
References
-
- Lee JM, Hwang D, Choi KH et al. Prognostic Implications of Relative Increase and Final Fractional Flow Reserve in Patients With Stent Implantation. JACC Cardiovasc Interv. 2018;20:2099–2109. - PubMed
-
- Jeremias A, Davies JE,Maehara A et al. Blinded Physiological Assessment of Residual Ischemia After Successful Angiographic Percutaneous Coronary Intervention: The DEFINE PCI Study. JACC Cardiovasc Interv. 2019;20:1991–2001. - PubMed
Publication types
MeSH terms
Substances
LinkOut - more resources
Full Text Sources
Miscellaneous
