

Inhibition of NLRP1 inflammasome improves autophagy dysfunction and Aβ disposition in APP/PS1 mice
- PMID: 37055801
- PMCID: PMC10100229
- DOI: 10.1186/s12993-023-00209-8
Inhibition of NLRP1 inflammasome improves autophagy dysfunction and Aβ disposition in APP/PS1 mice
Abstract
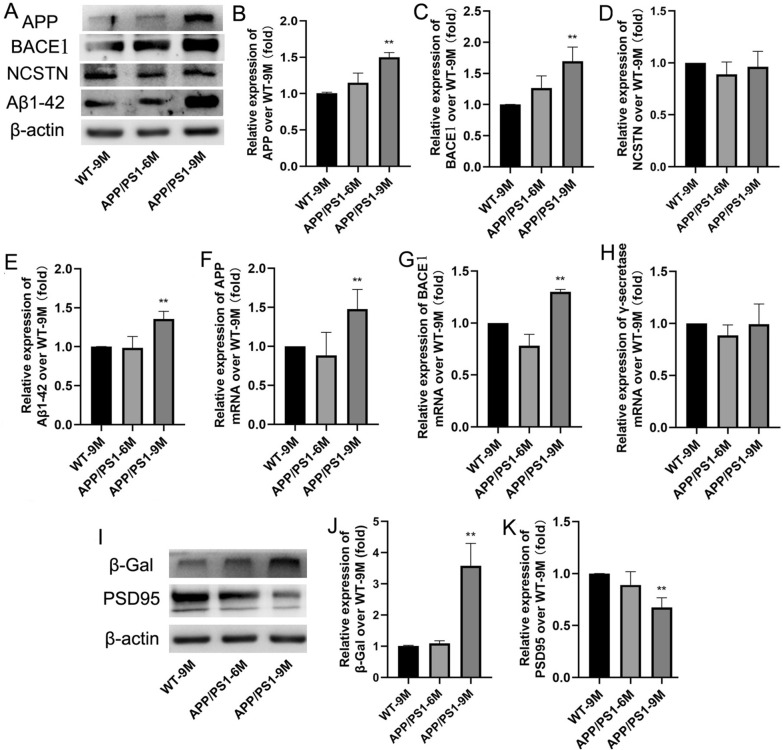
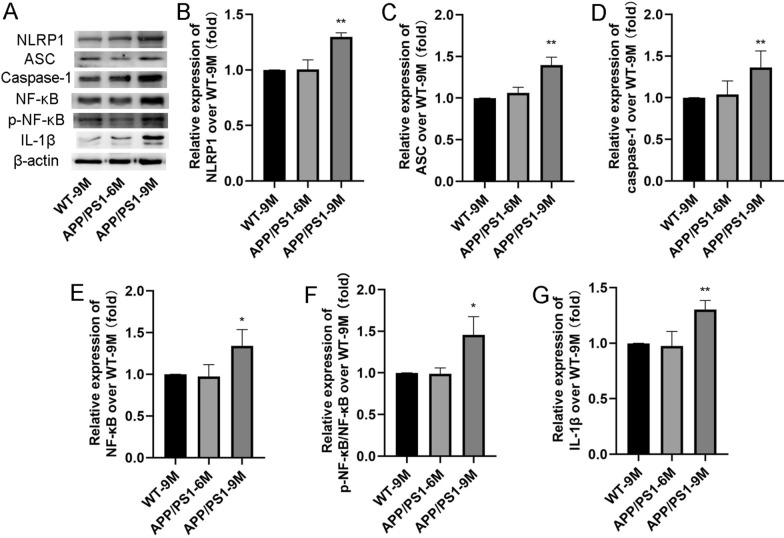
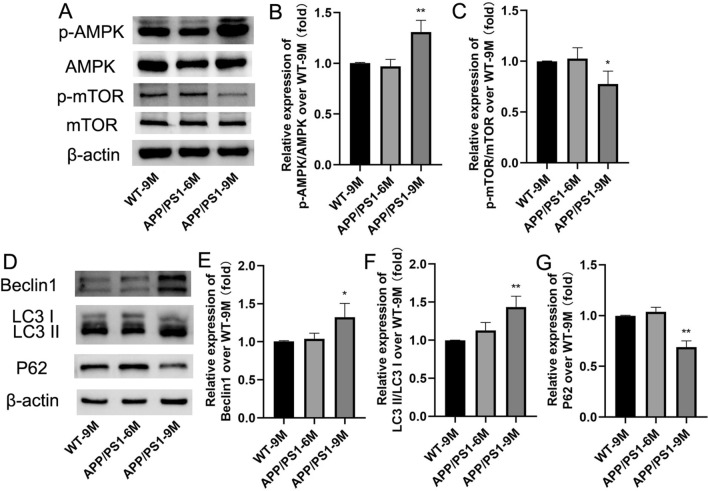
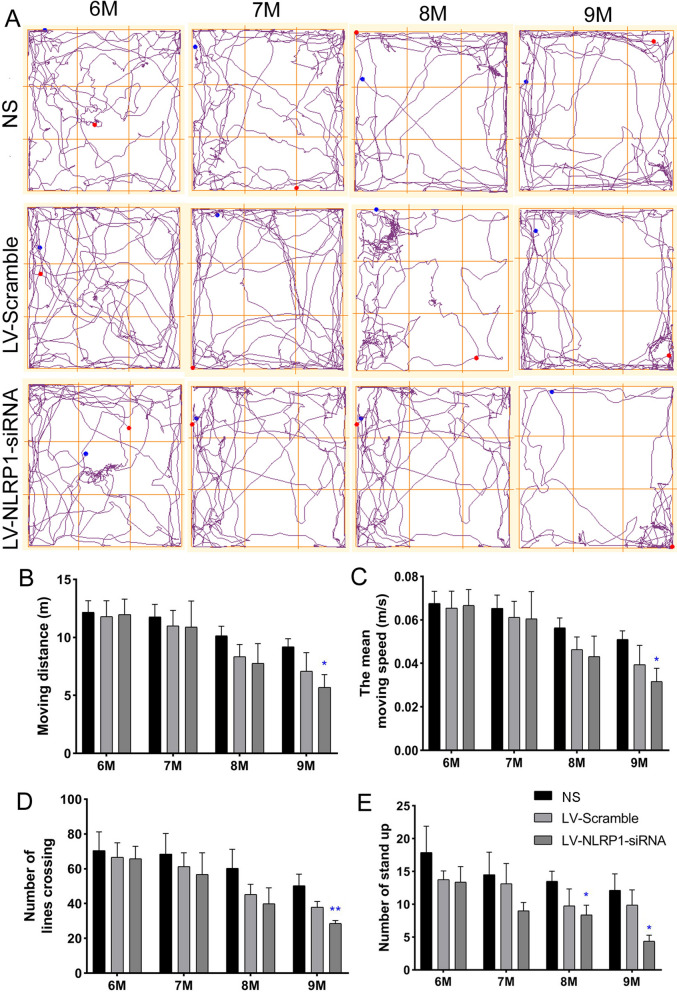
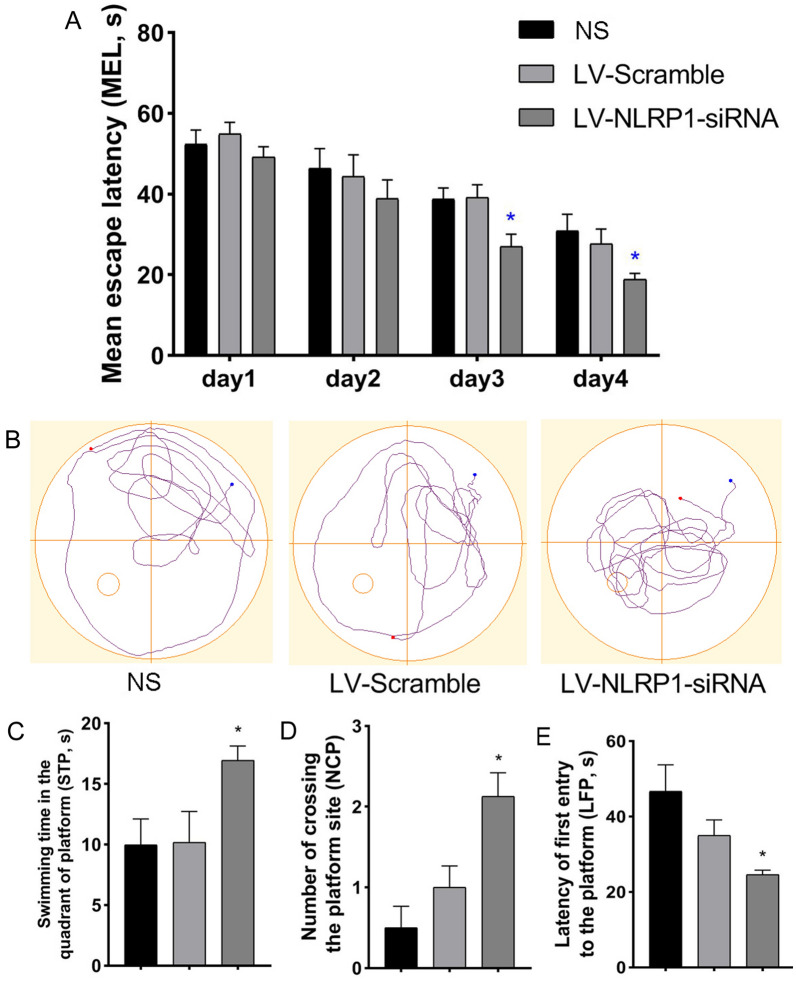
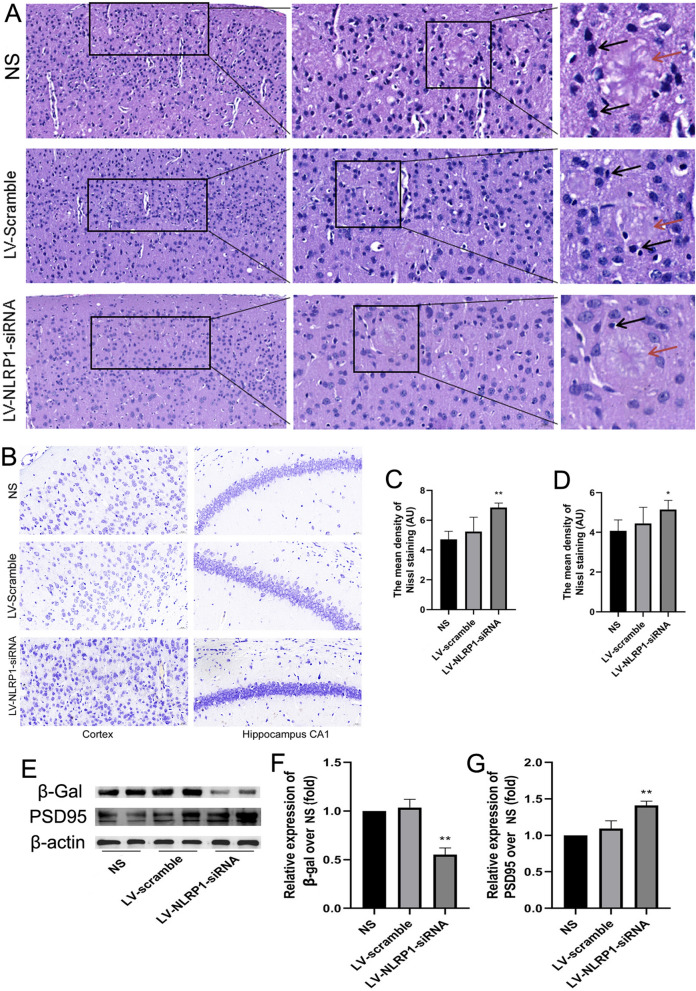
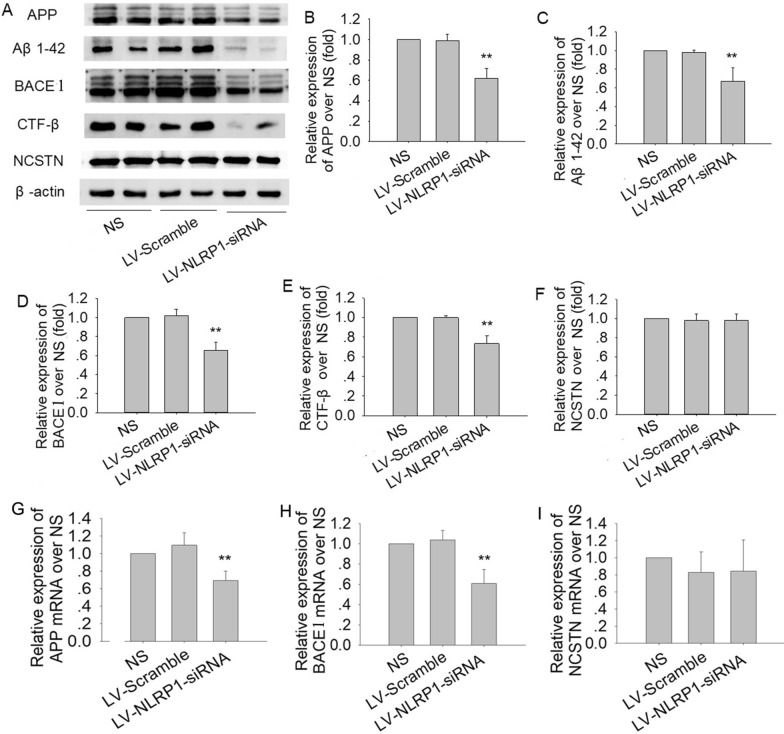
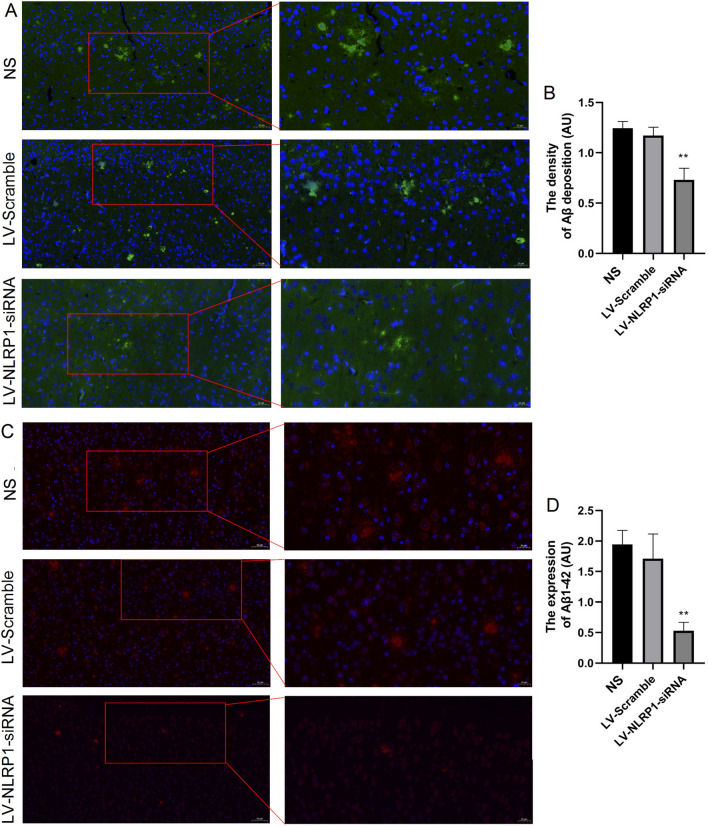
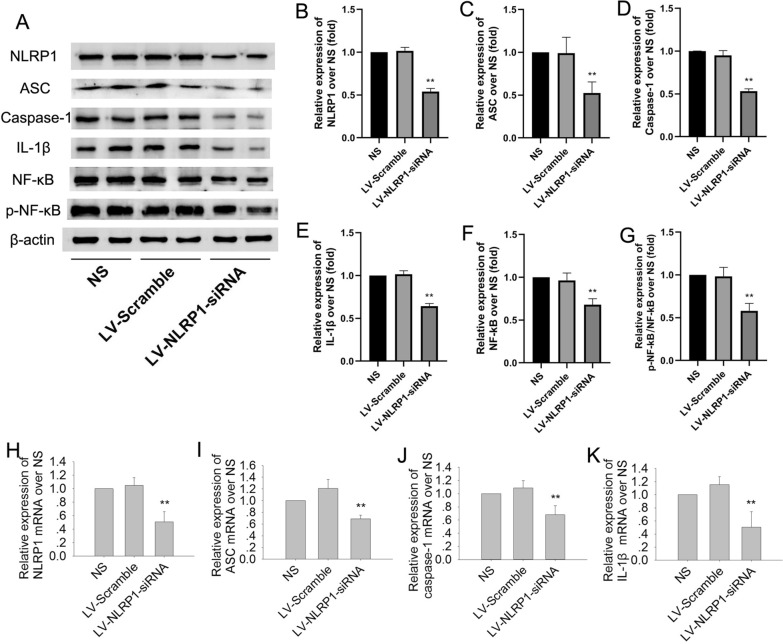
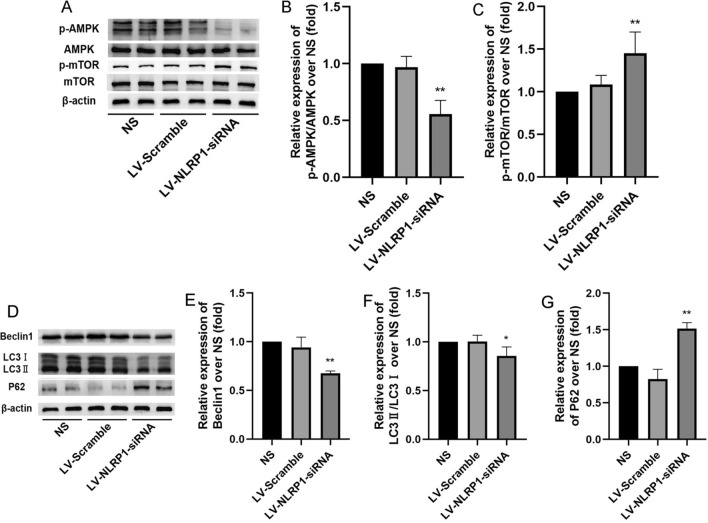
Increasing evidence has shown that the NOD-like receptor protein 1 (NLRP1) inflammasome is associated with Aβ generation and deposition, which contributes to neuronal damage and neuronal-inflammation in Alzheimer's disease (AD). However, the specific mechanism of NLRP1 inflammasome in the pathogenesis of AD is still unclear. It has been reported that autophagy dysfunction can aggravate the pathological symptoms of AD and plays an important role in regulating Aβ generation and clearance. We hypothesized that NLRP1 inflammasome activation may induce autophagy dysfunction contributing to the progression of AD. In the present study, we observed the relationship between Aβ generation and NLRP1 inflammasome activation, as well as AMPK/mTOR mediated-autophagy dysfunction in WT 9-month-old (M) mice, APP/PS1 6 M and APP/PS1 9 M mice. Additionally, we further studied the effect of NLRP1 knockdown on cognitive function, Aβ generation, neuroinflammation and AMPK/mTOR mediated autophagy in APP/PS1 9 M mice. Our results indicated that NLRP1 inflammasome activation and AMPK/mTOR mediated-autophagy dysfunction are closely implicated in Aβ generation and deposition in APP/PS1 9 M mice, but not in APP/PS1 6 M mice. Meanwhile, we found that knockdown of NLRP1 significantly improved learning and memory impairments, decreased the expressions of NLRP1, ASC, caspase-1, p-NF-κB, IL-1β, APP, CTF-β, BACE1 and Aβ1-42, and decreased the level of p-AMPK, Beclin 1 and LC3 II, and increased the level of p-mTOR and P62 in APP/PS1 9 M mice. Our study suggested that inhibition of NLRP1 inflammasome activation improves AMPK/mTOR mediated-autophagy dysfunction, resulting in the decrease of Aβ generation, and NLRP1 and autophagy might be important targets to delay the progression of AD.
Keywords: AMPK/mTOR; APP/PS1 mice; Alzheimer's disease; Autophagy; NLRP1 inflammasome.
© 2023. The Author(s).
Conflict of interest statement
The authors declare that they have no known competing financial interests or personal relationships that could have appeared to influence the work reported in this paper.
Figures
Similar articles
-
Ginsenoside Rg1 alleviates learning and memory impairments and Aβ disposition through inhibiting NLRP1 inflammasome and autophagy dysfunction in APP/PS1 mice.Mol Med Rep. 2023 Jan;27(1):6. doi: 10.3892/mmr.2022.12893. Epub 2022 Nov 11. Mol Med Rep. 2023. PMID: 36367174 Free PMC article.
-
Stress level of glucocorticoid exacerbates neuronal damage and Aβ production through activating NLRP1 inflammasome in primary cultured hippocampal neurons of APP-PS1 mice.Int Immunopharmacol. 2022 Sep;110:108972. doi: 10.1016/j.intimp.2022.108972. Epub 2022 Jun 28. Int Immunopharmacol. 2022. PMID: 35777263
-
Electroacupuncture Improves Learning and Memory Abilities via Activating AMPK/mTOR-Induced Autophagy in APP/PS1 Mice.Biochem Genet. 2024 Aug;62(4):2540-2552. doi: 10.1007/s10528-023-10503-9. Epub 2023 Nov 18. Biochem Genet. 2024. PMID: 37980310
-
Impaired autophagy and APP processing in Alzheimer's disease: The potential role of Beclin 1 interactome.Prog Neurobiol. 2013 Jul-Aug;106-107:33-54. doi: 10.1016/j.pneurobio.2013.06.002. Epub 2013 Jul 1. Prog Neurobiol. 2013. PMID: 23827971 Review.
-
Exploring the bi-directional relationship between autophagy and Alzheimer's disease.CNS Neurosci Ther. 2020 Feb;26(2):155-166. doi: 10.1111/cns.13216. Epub 2019 Sep 10. CNS Neurosci Ther. 2020. PMID: 31503421 Free PMC article. Review.
Cited by
-
Pharmacological inhibition of plasminogen activator inhibitor-1 prevents memory deficits and reduces neuropathology in APP/PS1 mice.Psychopharmacology (Berl). 2023 Dec;240(12):2641-2655. doi: 10.1007/s00213-023-06459-8. Epub 2023 Sep 12. Psychopharmacology (Berl). 2023. PMID: 37700086
-
Pyroptosis in Alzheimer's Disease: Mechanisms and Therapeutic Potential.Cell Mol Neurobiol. 2025 Jun 17;45(1):57. doi: 10.1007/s10571-025-01579-5. Cell Mol Neurobiol. 2025. PMID: 40526193 Free PMC article. Review.
-
NLRP3/1-mediated pyroptosis: beneficial clues for the development of novel therapies for Alzheimer's disease.Neural Regen Res. 2024 Nov 1;19(11):2400-2410. doi: 10.4103/1673-5374.391311. Epub 2023 Dec 21. Neural Regen Res. 2024. PMID: 38526276 Free PMC article.
-
A Perfect Storm: The Convergence of Aging, Human Immunodeficiency Virus Infection, and Inflammasome Dysregulation.Curr Issues Mol Biol. 2024 May 15;46(5):4768-4786. doi: 10.3390/cimb46050287. Curr Issues Mol Biol. 2024. PMID: 38785555 Free PMC article. Review.
-
Inflammasome activity regulation by PUFA metabolites.Front Immunol. 2024 Sep 3;15:1452749. doi: 10.3389/fimmu.2024.1452749. eCollection 2024. Front Immunol. 2024. PMID: 39290706 Free PMC article. Review.
References
-
- Fiest KM, Roberts JI, Maxwell CJ, Hogan DB, Smith EE, Frolkis A, Cohen A, Kirk A, Pearson D, Pringsheim T, et al. The prevalence and incidence of dementia due to Alzheimer's disease: a systematic review and meta-analysis. Can J Neurol Sci. 2016;43(Suppl 1):S51–82. doi: 10.1017/cjn.2016.36. - DOI - PubMed
-
- Vassar R, Bennett BD, Babu-Khan S, Kahn S, Mendiaz EA, Denis P, Teplow DB, Ross S, Amarante P, Loeloff R, et al. Beta-secretase cleavage of Alzheimer's amyloid precursor protein by the transmembrane aspartic protease BACE. Science. 1999;286(5440):735–741. doi: 10.1126/science.286.5440.735. - DOI - PubMed
MeSH terms
Substances
Grants and funding
- KJ2020ZD14/the Major projects of Anhui Provincial Department of EducationKJ2020ZD14
- KJ2020ZD14/the Major projects of Anhui Provincial Department of EducationKJ2020ZD14
- KJ2020ZD14/the Major projects of Anhui Provincial Department of EducationKJ2020ZD14
- KJ2020ZD14/the Major projects of Anhui Provincial Department of EducationKJ2020ZD14
- KJ2020ZD14/the Major projects of Anhui Provincial Department of EducationKJ2020ZD14
LinkOut - more resources
Full Text Sources
Medical
Research Materials
Miscellaneous
