. 2023 Apr 13;30(1):23.
doi: 10.1186/s12929-023-00917-3.

A tumor microenvironment-based prognostic index for osteosarcoma

Affiliations

A tumor microenvironment-based prognostic index for osteosarcoma

Changwu Wu et al. J Biomed Sci. .

Abstract

Background: The tumor microenvironment (TME) has a central role in the oncogenesis of osteosarcomas. The composition of the TME is essential for the interaction between tumor and immune cells. The aim of this study was to establish a prognostic index (TMEindex) for osteosarcoma based on the TME, from which estimates about patient survival and individual response to immune checkpoint inhibitor (ICI) therapy can be deduced.

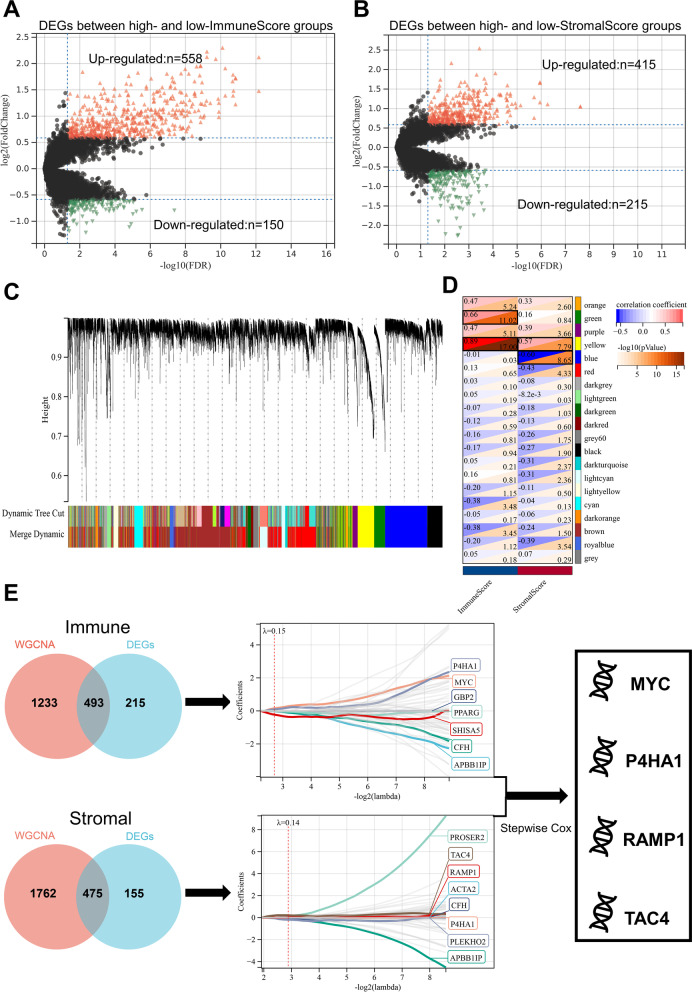
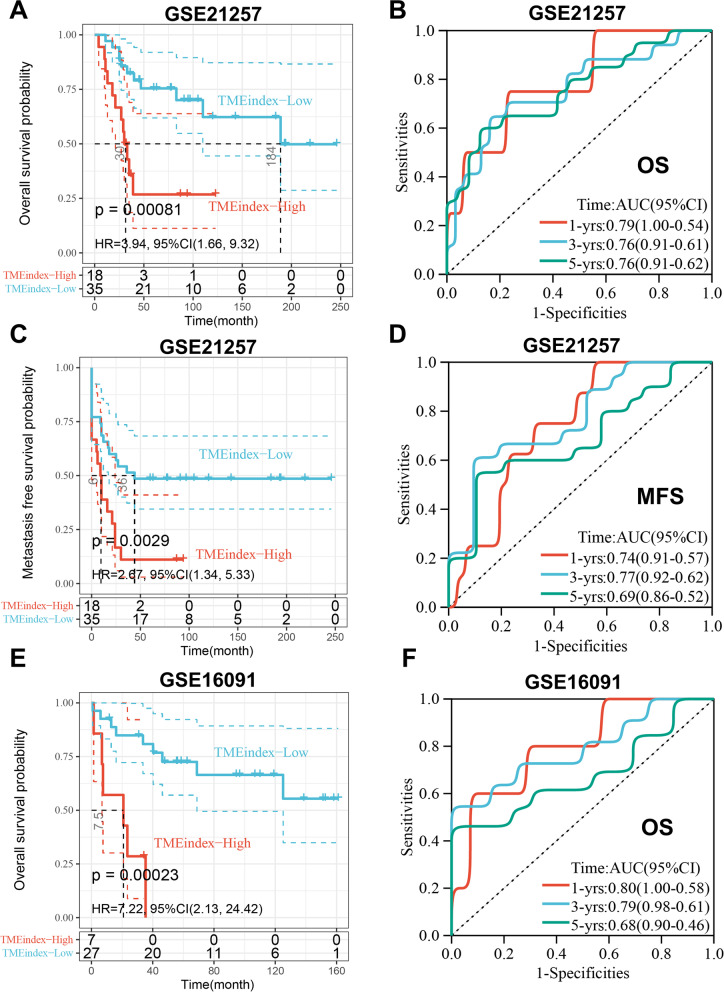
Methods: Based on osteosarcoma samples from the Therapeutically Applicable Research to Generate Effective Treatments (TARGET) database, the ESTIMATE algorithm was used to estimate ImmuneScore and StromalScore. Combined differentially expressed gene analysis, weighted gene co-expression network analyses, the Least Absolute Shrinkage and Selection Operator regression and stepwise regression to construct the TMEindex. The prognostic role of TMEindex was validated in three independent datasets. The molecular and immune characteristics of TMEindex and the impact on immunotherapy were then comprehensively investigated. The expression of TMEindex genes in different cell types and its effects on osteosarcoma cells were explored by scRNA-Seq analysis and molecular biology experiments.

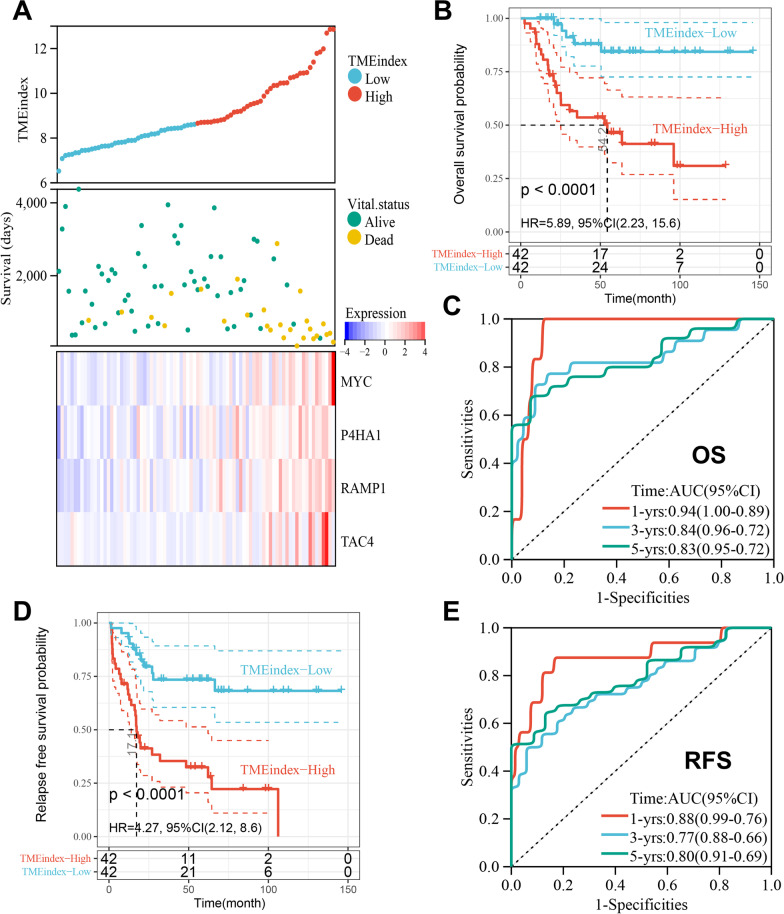
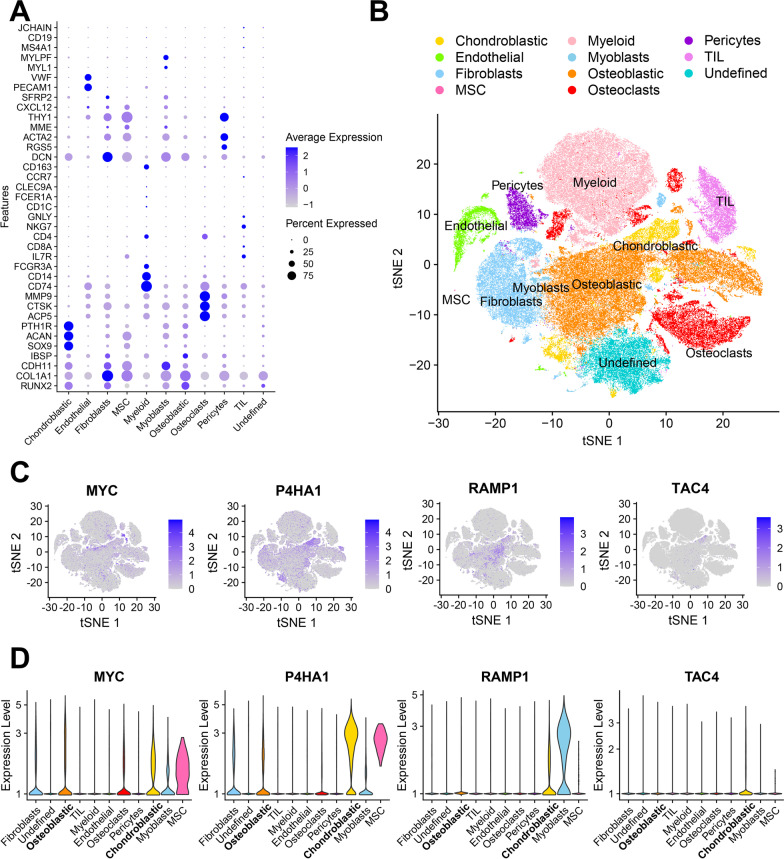
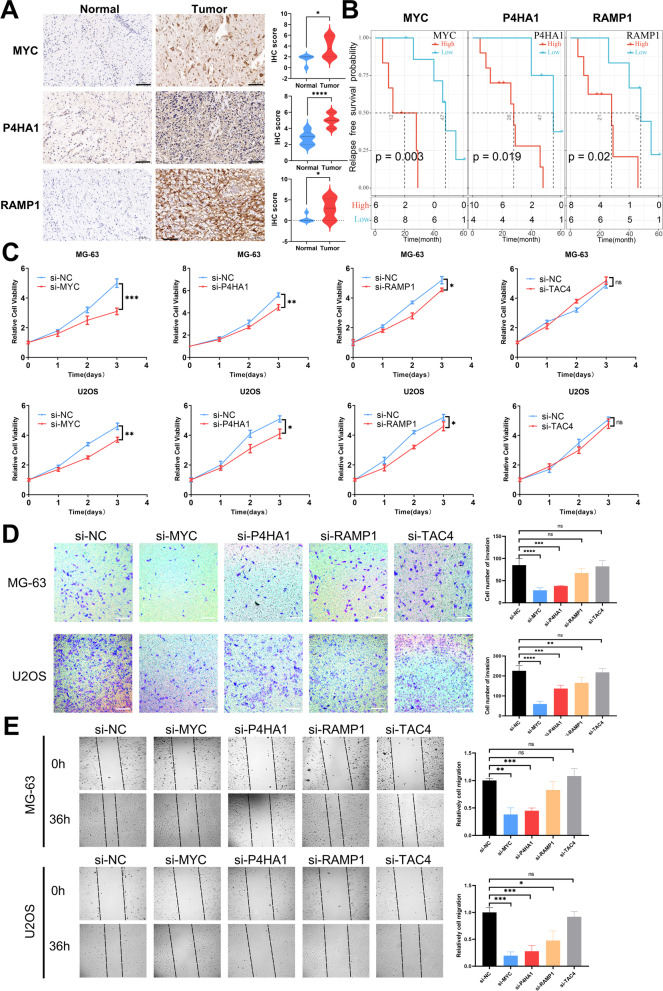
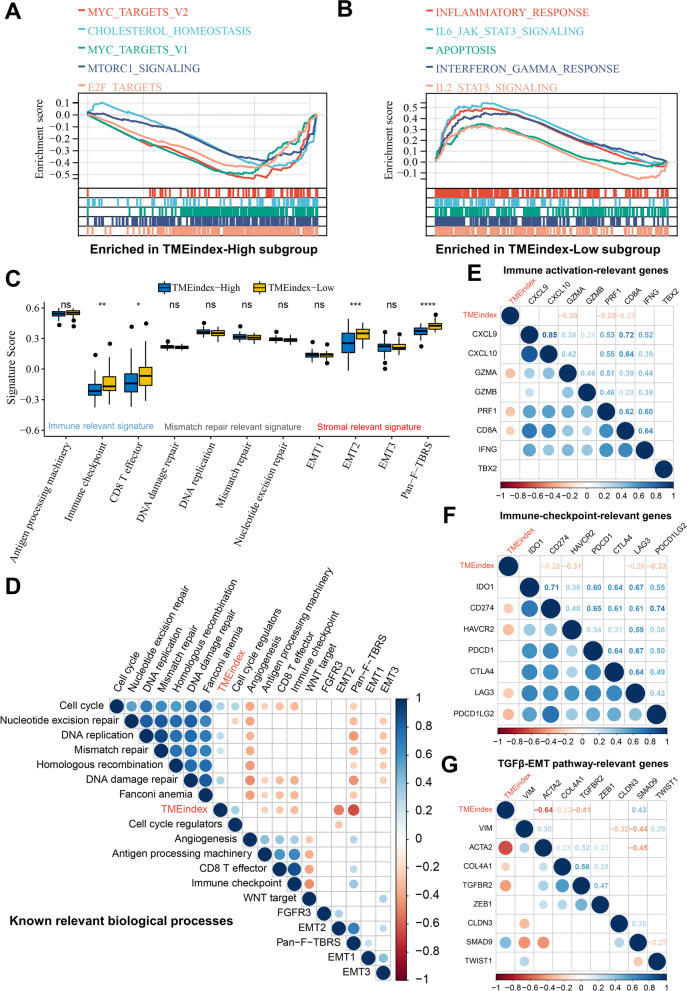
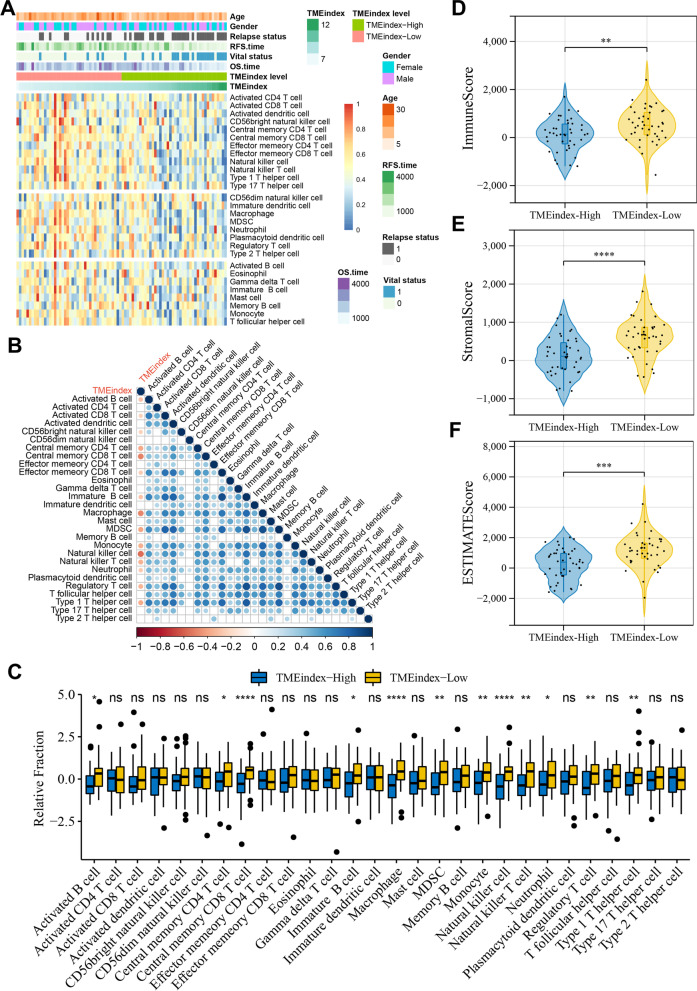
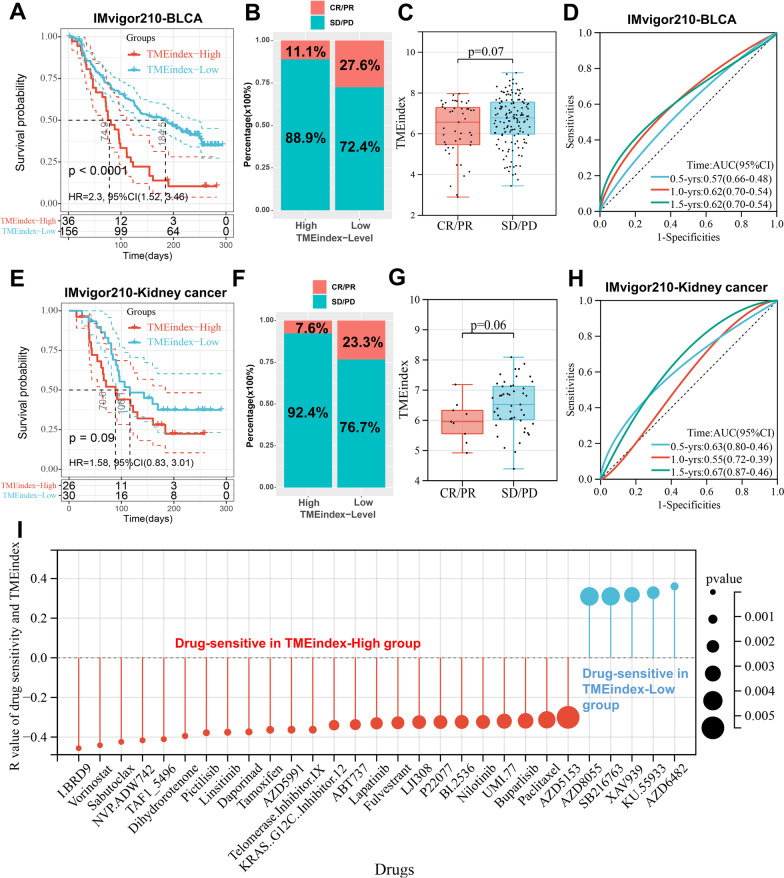
Results: Fundamental is the expression of MYC, P4HA1, RAMP1 and TAC4. Patients with high TMEindex had worse overall survival, recurrence-free survival, and metastasis-free survival. TMEindex is an independent prognostic factor in osteosarcoma. TMEindex genes were mainly expressed in malignant cells. The knockdown of MYC and P4HA1 significantly inhibited the proliferation, invasion and migration of osteosarcoma cells. A high TME index is related to the MYC, mTOR, and DNA replication-related pathways. In contrast, a low TME index is related to immune-related signaling pathways such as the inflammatory response. The TMEindex was negatively correlated with ImmuneScore, StromalScore, immune cell infiltration, and various immune-related signature scores. Patients with a higher TMEindex had an immune-cold TME and higher invasiveness. Patients with a low TME index were more likely to respond to ICI therapy and achieve clinical benefit. In addition, the TME index correlated with response to 29 oncologic drugs.

Conclusions: The TMEindex is a promising biomarker to predict the prognosis of patients with osteosarcoma and their response to ICI therapy, and to distinguish the molecular and immune characteristics.

Keywords: Big data; Checkpoint inhibitor therapy; Immune cell infiltration; Osteosarcoma; Prognostic index; Tumor microenvironment.


Conflict of interest statement

The authors declared no potential competing interests.

Figures

Fig. 1
Fig. 1
Construction of the TMEindex. A Volcano plot of differentially expressed genes between high-ImmuneScore group and low-ImmuneScore group. B Volcano plot of differentially expressed genes between high-StromalScore group and low-StromalScore group. C Gene modules identified by WGCNA. D Correlation analysis between gene modules and ImmuneScore/ StromalScore. Strongly correlated modules (|correlation coefficients|> 0.6, P < 0.05) are marked with black frames. E LASSO regression and stepwise regression for determining the final model. Venn plot shows the number of intersection genes between WGCNA and DEG analysis. These genes were further input into LASSO regression. The Y-axis shows LASSO coefficients and the X-axis is − log2(lambda). The genes obtained from LASSO regression downscaling were further input into stepwise regression to determine the TMEindex
Fig. 2
Fig. 2
Prognostic predictive role of TMEindex. A The distribution of TMEindex and survival status and the heatmap of 4 genes of the TMEindex in the TARGET cohort. B Kaplan–Meier curve depicts the OS difference between TMEindex-high and TMEindex-low groups (log-rank P < 0.0001) in the TARGET cohort. Red representing the TMEindex-high group and blue representing the TMEindex-low group. C ROC curve showing the OS prediction efficiency of the TMEindex in the TARGET cohort. D Kaplan–Meier curve depicts the RFS difference between TMEindex-high and TMEindex-low groups (log-rank P < 0.0001) in the TARGET cohort. Red representing the TMEindex-high group and blue representing the TMEindex-low group. E ROC curve showing the RFS prediction efficiency of the TMEindex in the TARGET cohort
Fig. 3
Fig. 3
Validation of the prognostic predictive power of TMEindex in independent cohorts. A Kaplan–Meier curve depicts the OS difference between TMEindex-high and TMEindex-low groups (log-rank P = 0.00081) in the GSE21257 cohort. B ROC curve showing the OS prediction efficiency of the TMEindex in the GSE21257 cohort. C Kaplan–Meier curve depicts the MFS difference between TMEindex-high and TMEindex-low groups (log-rank P = 0.0029) in the GSE21257 cohort. D ROC curve showing the MFS prediction efficiency of the TMEindex in the GSE21257 cohort. E Kaplan–Meier curve depicts the OS difference between TMEindex-high and TMEindex-low groups (log-rank P = 0.00023) in the GSE16091 cohort. F ROC curve showing the OS prediction efficiency of the TMEindex in the GSE16091 cohort
Fig. 4
Fig. 4
The scRNA-seq analysis of TMEindex genes. A The dot plot shows the expression of 37 signature genes in 11 cell clusters. The size of the dots indicates the proportion of cells expressing a specific marker, and the color indicates the average expression level of the markers. B The t-SNE plot of the 11 main cell types in osteosarcoma. C Feature plots for MYC, P4HA1, RAMP1 and TAC4. The color legend shows the normalized expression levels of the genes. D Violin plots showing the normalized expression levels of MYC, P4HA1, RAMP1 and TAC4 across the 11 cell types
Fig. 5
Fig. 5
Protein expression of TMEindex genes in osteosarcoma tissues and their effects on proliferation, invasion and migration of osteosarcoma cells. A IHC staining images of MYC, P4HA1 and RAMP1 in osteosarcoma tissues and corresponding normal tissues. The IHC scores indicated that the protein expression of MYC, P4HA1 and RAMP1 was higher in tumor tissues. B Kaplan–Meier curves depict the RFS difference between high and low TMEindex proteins (MYC, P4HA1 and RAMP1) groups (all log-rank P < 0.0001) in the external cohort. Red representing the high TMEindex proteins group and blue representing the low TMEindex proteins group. C Folded line plots showing the effect of MYC, P4HA1, RAMP1 and TAC4 knockdown on the proliferation of MG-63 and U2OS cells. The blue line represents the control group and the red line represents the knockdown group. D Transwell chamber experiment showing the effect of MYC, P4HA1, RAMP1 and TAC4 knockdown on the invasion of MG-63 and U2OS cells. Scale bar: 100 μm. E Scratch assay showing the effect of MYC, P4HA1, RAMP1 and TAC4 knockdown on the migration of MG-63 and U2OS cells. Data are represented as mean ± SEM. *P < 0.05, **P < 0.01, ***P < 0.001, ****P < 0.0001
Fig. 6
Fig. 6
Molecular characteristics of the TMEindex. A, B GSEA enrichment plots base on HALLMARK gene set showing the relatively enriched pathways in TMEindex-high (A) and TMEindex-low (B) groups. C Differences in different signatures (immune relevant signature, mismatch repair relevant signature, and stromal relevant signature as indicated) between TMEindex-high and TMEindex-low groups. The upper and lower ends of the boxes represented interquartile range of values. The lines in the boxes represented median value, and black dots showed outliers. *P < 0.05, **P < 0.01, ***P < 0.001, ****P < 0.0001. D Correlations between TMEindex and known core biological processes signature scores. E Correlations between TMEindex and immune activation-relevant genes expression. F Correlations between TMEindex and immune-checkpoint-relevant genes expression. G Correlations between TMEindex and TGFβ/EMT pathway-relevant genes expression. Correlation coefficients are calculated by Spearman’s correlation analysis, with red representing negative correlations and blue representing positive correlations. Blank represents a correlation P-value > 0.05
Fig. 7
Fig. 7
Immune and stromal cell infiltration characteristics of TMEindex. A Heatmap of the relationship between TMEindex and 28 immune and stromal cells. Age, gender, vital status, OS time, relapse status and RFS time are shown as patient annotations. B Correlations of TMEindex with abundance of 28 immune and stromal cells. Correlation coefficients are calculated by Spearman’s correlation analysis, with red representing negative correlations and blue representing positive correlations. Blank represents a correlation P-value > 0.05. C Differences in 28 immune and stromal cells between TMEindex-high and TMEindex-low groups. The upper and lower ends of the boxes represented interquartile range of values. The lines in the boxes represented median value, and black dots showed outliers. D–F Differences in ImmuneScore (D), StromalScore (E) and ESTIMATEScore (F) between TMEindex-high and TMEindex-low groups. The blue represents the TMEindex-high group and the yellow represents TMEindex-low group. *P < 0.05, **P < 0.01, ***P < 0.001, ****P < 0.0001
Fig. 8
Fig. 8
The relationship between TMEindex and efficacy of immunotherapy and drug sensitivity. A, E Kaplan–Meier curves depict the OS difference between TMEindex-high and TMEindex-low groups after anti-PD-L1 immunotherapy in the IMvigor210-BLCA (A, log-rank P < 0.0001) and IMvigor210-Kidney cancer (B, log-rank P = 0.09) cohorts. B, F Rate of clinical response (complete response [CR]/partial response [PR] and stable disease [SD]/progressive disease [PD]) to anti–PD-L1 immunotherapy in TMEindex-high and TMEindex-low groups in the IMvigor210-BLCA (B) and IMvigor210-Kidney cancer (F) cohorts. C, G TMEindex in groups with different anti–PD-L1 clinical response status in the IMvigor210-BLCA (C) and IMvigor210-Kidney cancer (G) cohorts. The red represents CR/PR patients and the blue represents SD/PD patients. D, H ROC curves showing the OS prediction efficiency of the TMEindex in the IMvigor210-BLCA (D) and IMvigor210-Kidney cancer (H) cohorts. I The correlation between TMEindex and drug sensitivity (IC50 value). Each column represents a drug. The height of the column represents the correlation coefficient. The red represents drugs sensitive in TMEindex-high group and the blue represents drugs sensitive in TMEindex-low group

Similar articles

Cited by

References

    1. Watson MLJ, Vignali PDA, Mullett SJ, Overacre-Delgoffe AE, Peralta RM, Grebinoski S, et al. Metabolic support of tumour-infiltrating regulatory T cells by lactic acid. Nature. 2021;591:645–651. doi: 10.1038/s41586-020-03045-2. - DOI - PMC - PubMed
    1. Whelan J, McTiernan A, Cooper N, Wong YK, Francis M, Vernon S, et al. Incidence and survival of malignant bone sarcomas in England 1979–2007. Int J Cancer. 2012;131:E508. doi: 10.1002/ijc.26426. - DOI - PubMed
    1. Smeland S, Bielack SS, Whelan J, Bernstein M, Hogendoorn P, Krailo MD, et al. Survival and prognosis with osteosarcoma: outcomes in more than 2000 patients in the EURAMOS-1 (European and American Osteosarcoma Study) cohort. Eur J Cancer. 2019;109:36–50. doi: 10.1016/j.ejca.2018.11.027. - DOI - PMC - PubMed
    1. Meltzer PS, Helman LJ. New horizons in the treatment of osteosarcoma. N Engl J Med. 2021;385:2066–2076. doi: 10.1056/NEJMra2103423. - DOI - PubMed
    1. Gorlick R, Janeway K, Lessnick S, Randall RL, Marina N. Children’s oncology group’s 2013 blueprint for research: Bone tumors. Pediatr Blood Cancer. 2013;60:1009–1015. doi: 10.1002/pbc.24429. - DOI - PMC - PubMed