. 2023 Oct;18(10):2229-2236.
doi: 10.4103/1673-5374.369117.

Reperfusion after hypoxia-ischemia exacerbates brain injury with compensatory activation of the anti- ferroptosis system: based on a novel rat model

Affiliations

Reperfusion after hypoxia-ischemia exacerbates brain injury with compensatory activation of the anti- ferroptosis system: based on a novel rat model

Tian-Lei Zhang et al. Neural Regen Res. 2023 Oct.

Abstract

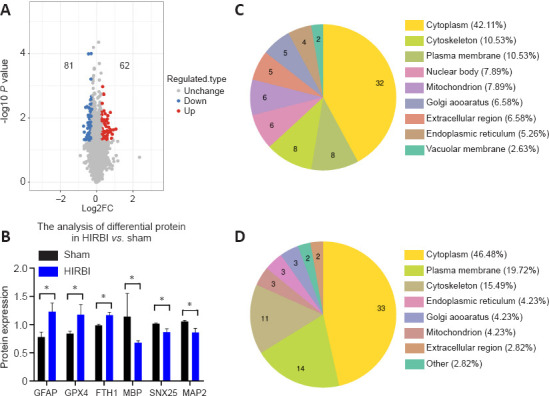
Hypoxic-ischemic encephalopathy, which predisposes to neonatal death and neurological sequelae, has a high morbidity, but there is still a lack of effective prevention and treatment in clinical practice. To better understand the pathophysiological mechanism underlying hypoxic-ischemic encephalopathy, in this study we compared hypoxic-ischemic reperfusion brain injury and simple hypoxic-ischemic brain injury in neonatal rats. First, based on the conventional Rice-Vannucci model of hypoxic-ischemic encephalopathy, we established a rat model of hypoxic-ischemic reperfusion brain injury by creating a common carotid artery muscle bridge. Then we performed tandem mass tag-based proteomic analysis to identify differentially expressed proteins between the hypoxic-ischemic reperfusion brain injury model and the conventional Rice-Vannucci model and found that the majority were mitochondrial proteins. We also performed transmission electron microscopy and found typical characteristics of ferroptosis, including mitochondrial shrinkage, ruptured mitochondrial membranes, and reduced or absent mitochondrial cristae. Further, both rat models showed high levels of glial fibrillary acidic protein and low levels of myelin basic protein, which are biological indicators of hypoxic-ischemic brain injury and indicate similar degrees of damage. Finally, we found that ferroptosis-related Ferritin (Fth1) and glutathione peroxidase 4 were expressed at higher levels in the brain tissue of rats with hypoxic-ischemic reperfusion brain injury than in rats with simple hypoxic-ischemic brain injury. Based on these results, it appears that the rat model of hypoxic-ischemic reperfusion brain injury is more closely related to the pathophysiology of clinical reperfusion. Reperfusion not only aggravates hypoxic-ischemic brain injury but also activates the anti-ferroptosis system.

Keywords: Rice-Vannucci; ferroptosis; hypoxic-ischemic brain injury; hypoxic-ischemic encephalopathy; hypoxic-ischemic reperfusion brain injury; mitochondria; model; proteomic analysis; reperfusion; transmission electron microscopy.


Conflict of interest statement

None

Figures

Figure 1
Figure 1
Animal model establishment and laser speckle imaging of the brain. (A) Animal modeling groups. (B) Photographs of brains from the different groups. (C) Laser speckle imaging (LSI) of the different groups. (D) Pseudo-color LSI images of the different groups. HIRBI: Hypoxia ischemia reperfusion brain injury.
Figure 2
Figure 2
Proteomics analysis of brain tissue from the Rice-Vannucci vs. Sham groups, performed using OmicStudio tools. (A) Volcano map of differentially expressed proteins between the Rice-Vannucci and Sham groups. (B) Analysis of significantly differentially expressed proteins between the Rice-Vannucci and Sham groups. The Y-axis shows the signal strength ratio of the labeled protein from the tandem mass spectrometry data (mean ± SD, n = 3). *P < 0.05 (Student’s t-test). (C) Subcellular structure annotation classification of proteins that were significantly up-regulated in the Rice-Vannucci group compared with the Sham group. (D) Subcellular structure annotation classification of proteins that were significantly down-regulated in the Rice-Vannucci compared with the Sham group.
Figure 3
Figure 3
Proteomic analysis of brain tissue from the HIRBI vs. Sham groups, performed using OmicStudio tools. (A) Volcano map of differentially expressed proteins between the hypoxic-ischemic reperfusion brain injury (HIRBI) and Sham groups. The Y-axis shows the signal strength ratio of the labeled protein from the tandem mass spectrometry data. (B) Significantly differentially expressed proteins between the HIRBI and Sham groups. (C) Subcellular structure annotation classification of proteins that were significantly up-regulated in the HIRBI group compared with the Sham group. (D) Subcellular structure annotation classification of proteins that were significantly down-regulated in the HIRBI groups compared with the Sham group (mean ± SD, n = 3). *P < 0.05 (Student’s t-test).
Figure 4
Figure 4
Proteomics analysis of brain tissue from the HIRBI vs. Rice-Vannucci groups, performed using OmicStudio tools. (A) Volcano map of differentially expressed proteins between the hypoxic-ischemic reperfusion brain injury (HIRBI) and Rice-Vannucci groups. (B) Significantly differentially expressed proteins between the HIRBI and Rice-Vannucci groups. The Y-axis shows the signal strength ratio of the labeled protein from the tandem mass spectrometry data. (C) Subcellular structure annotation classification of proteins that were significantly up-regulated in the HIRBI group compared with the Rice-Vannucci group. (D) Subcellular structure annotation classification of proteins that were significantly down-regulated in the HIRBI group compared with the Rice-Vannucci group (mean ± SD, n = 3). *P < 0.05 (Student’s t-test).
Figure 5
Figure 5
Venn diagram analysis of co-upregulated or co-downregulated proteins among the proteins that were significantly differentially expressed between the Rice-Vannucci vs. HIRBI groups. (A) Venn diagram of co-upregulated significantly differentially expressed proteins. (B) Venn diagram analysis of co-downregulated significantly differentially expressed proteins. (C) Analysis of co-upregulated significantly differentially expressed proteins in the hypoxic-ischemic reperfusion brain injury (HIRBI) vs. Sham groups and the HIRBI vs. Rice-Vannucci groups. (D) Analysis of co-upregulated significantly differentially expressed proteins in the HIRBI vs. Sham groups and Rice-Vannucci vs. Sham groups. (E) Analysis of co-downregulated significantly differentially expressed proteins in the HIRBI vs. Sham groups and HIRBI vs. Rice-Vannucci groups. (F) Analysis of co-downregulated significantly differentially expressed proteins in the HIRBI vs. Sham groups and the Rice-Vannucci vs. Sham groups. Data are expressed as mean ± SD (n = 3). *P < 0.05 (one-way analysis of variance followed by Tukey’s honestly significant difference test).
Figure 6
Figure 6
Transmission electron microscopy (TEM) analysis of mitochondrial structures in the hippocampal CA1 region. (A) TEM of mitochondrial structures in the Sham group. (B) TEM of mitochondrial structures in the Rice-Vannucci group. (C) TEM of mitochondrial structures in HIRBI group. Mitochondria in the hippocampal CA1 region were destroyed in the Rice-Vannucci and HIRBI groups. The arrows point to mitochondria. Scale bars: 3 µm (upper), 10 µm (lower).
Figure 7
Figure 7
Immunofluorescence staining and Western blot analysis of the different groups. (A, B) Immunofluorescence staining for glial fibrillary acidic protein (GFAP, FITC) and myelin basic protein (MBP, Cy3) expression in the different groups. Higher GFAP expression and lower MBP expression were observed in the HIRBI group compared to Sham group. Scale bars: 100 μm. (C) Detection of microtubule-associated protein 2 (MAP2), GFAP, MBP, Ferritin, and glutathione peroxidase 4 (GPX4) expression by western blot assay. (D) Quantification of western blot bands (normalized to β-actin). Higher GFAP, GPX4, and Ferritin expression and lower MAP2 and MBP expression were observed in the HIRBI group compared to Rice-Vannucci group. Data are expressed as mean ± SD (n = 3). *P < 0.05 (one-way analysis of variance followed by Tukey’s honestly significant difference test).

References

    1. Azzopardi DV, Strohm B, Edwards AD, Dyet L, Halliday HL, Juszczak E, Kapellou O, Levene M, Marlow N, Porter E, Thoresen M, Whitelaw A, Brocklehurst P. Moderate hypothermia to treat perinatal asphyxial encephalopathy. N Engl J Med. 2009;361:1349–1358. - PubMed
    1. Bae SH, Yoo MR, Kim YY, Hong IK, Kim MH, Lee SH, Kim DY. Brain-derived neurotrophic factor mediates macrophage migration inhibitory factor to protect neurons against oxygen-glucose deprivation. Neural Regen Res. 2020;15:1483–1489. - PMC - PubMed
    1. Barry DM, Koo Y, Norden PR, Wylie LA, Xu K, Wichaidit C, Azizoglu DB, Zheng Y, Cobb MH, Davis GE, Cleaver O. Rasip1-mediated rho GTPase signaling regulates blood vessel tubulogenesis via nonmuscle myosin II. Circ Res. 2016;119:810–826. - PMC - PubMed
    1. Bharat V, Hsieh CH, Wang X. Mitochondrial defects in fibroblasts of pathogenic MAPT patients. Front Cell Dev Biol. 2021;9:765408. - PMC - PubMed
    1. Boggs JM. Myelin basic protein: a multifunctional protein. Cell Mol Life Sci. 2006;63:1945–1961. - PMC - PubMed