. 2023 Mar 7;3(3):100418.
doi: 10.1016/j.crmeth.2023.100418. eCollection 2023 Mar 27.

A flexible and versatile system for multi-color fiber photometry and optogenetic manipulation

Affiliations

A flexible and versatile system for multi-color fiber photometry and optogenetic manipulation

Andrey Formozov et al. Cell Rep Methods. .

Abstract

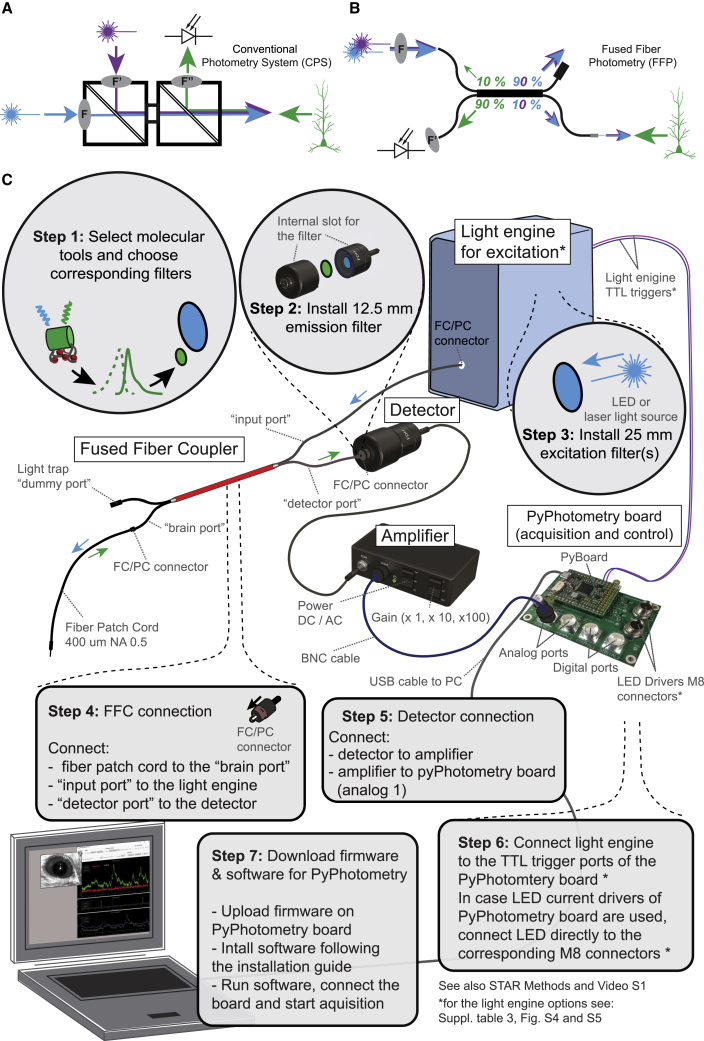
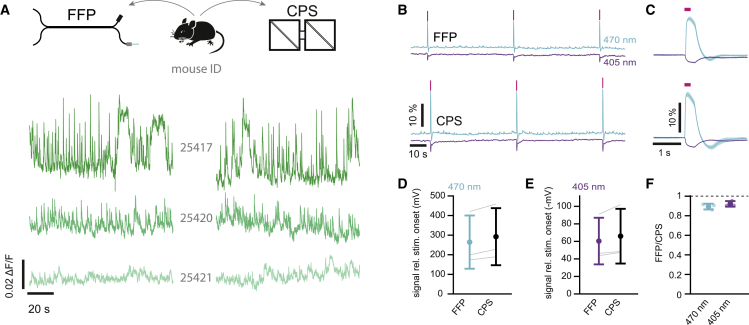
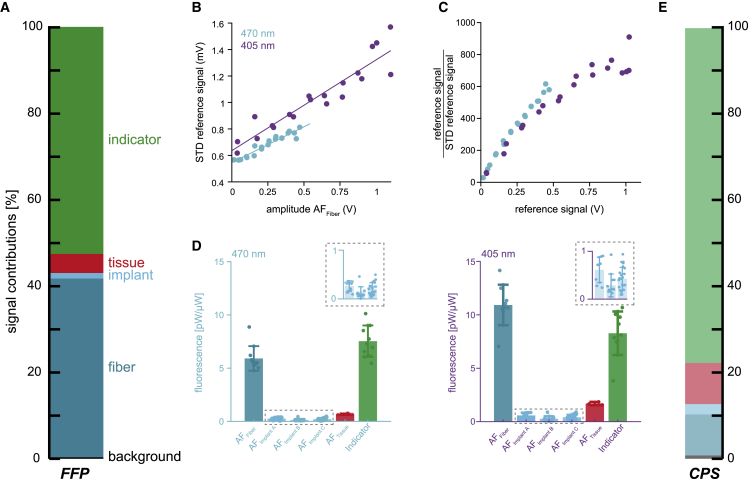
Here, we present simultaneous fiber photometry recordings and optogenetic stimulation based on a multimode fused fiber coupler for both light delivery and collection without the need for dichroic beam splitters. In combination with a multi-color light source and appropriate optical filters, our approach offers remarkable flexibility in experimental design and facilitates the exploration of new molecular tools in vivo at minimal cost. We demonstrate straightforward re-configuration of the setup to operate with green, red, and near-infrared calcium indicators with or without simultaneous optogenetic stimulation and further explore the multi-color photometry capabilities of the system. The ease of assembly, operation, characterization, and customization of this platform holds the potential to foster the development of experimental strategies for multi-color fused fiber photometry combined with optogenetics far beyond its current state.

Keywords: all-optical; fiber photometry; fused fiber coupler; genetically encoded indicators; hippocampus; in vivo; mouse brain; neuroscience; open source; optogenetics.


Conflict of interest statement

The authors have a patent application pending for the use of fused fiber optics for bidirectional communication with electrically excitable cells (50%/25%/25% by A.F./A.D./J.S.W.).

Figures

None
Graphical abstract
Figure 1
Figure 1
Fiber photometry recordings realized with a fused fiber photometry (FFP) system (A) Scheme of a conventional photometry system (CPS) based on excitation and emission filters F as well as dichroic mirrors (diagonal lines). (B) Customized fused fiber coupler for FFP: excitation light delivered in one branch of the coupler (top left) is split into two branches: ∼10% is used for the excitation of biosensors, while 90% is dissipated (top right). Emission light from the indicator is collected by the same fiber, 90% of which is guided to the photodetector (bottom left) and cleaned by the optical filter F’. (C) Detailed schematic of a complete FFP system, including assembly instructions.
Figure 2
Figure 2
FFP enables flexible photometry recordings in different spectral ranges (A) Excitation and emission spectrum of jGCaMP6s (top) and properties of excitation (purple and blue) and emission filters (black; bottom). (B) Top to bottom: representative raw data traces for 470- and 405-nm excitation, corrected calcium signal (ΔF/F), pupil size, and running speed (top to bottom). (C) Correlation matrix indicating positive correlations between hippocampal calcium activity, pupil size, and running. (D) Excitation and emission spectrum of jRGECO1a (top) and properties of excitation (purple and green) and emission filters (black; bottom). (E) Top to bottom: representative raw data traces for 548- and 405-nm excitation, corrected calcium signal (ΔF/F), pupil size, and running speed (top to bottom). (F) Correlation matrix indicating positive correlations between hippocampal calcium activity, pupil size, and running speed. r: Pearson's correlation coefficient; p: computed by transforming the correlation to create a t statistic to compare r against zero. ∗∗∗∗p < 0.0001.
Figure 3
Figure 3
FFP recordings combined with optogenetic stimulation (A) Spectra of jGCaMP8m and ChrimsonR (top) along with properties of filters for indicator excitation (purple and blue), optogenetic stimulation (magenta), and indicator emission (black; bottom). (B) Spectrogram indicating the absence of optical contamination by optogenetic stimulation. Transmittance of emission filter (black), spectrum of fiber auto-fluorescence with (magenta) and without (green) simultaneous optogenetic stimulation. (C) Recording of fiber auto-fluorescence during optogenetic stimulation (300 μW for 1 s: magenta line on top). Stimulation artifacts were not detectable at a gain of 1 (top) and only mildly pronounced at a gain of 100 (bottom). Mean ± standard deviation (STD) of 20 individual traces. (D) 470 (blue) and 405 nm (purple) excited fluorescence and ΔF/F (green) in response to optogenetic stimulation (500 μW for 0.2 s, stimulation rate 0.03 Hz), indicated by magenta bars. Inset: individual trial. (E) Mean ± STD of 405-nm excited (purple) and 470-nm excited (blue) fluorescence, as well as ΔF/F (green) of 20 trials of optogenetic stimulation, normalized to stimulus onset (magenta bar). (F) Average calcium transients in response to optogenetic stimulation with increasing stimulus intensity (20 trials per condition).
Figure 4
Figure 4
Comparison of FFP to conventional photometry recordings (A) Spontaneous signals (ΔF/F) in three mice are similar between the FFP (left) and the CPS approach (right). (B) 470 (blue) and 405 nm (purple) excited raw fluorescence in response to optogenetic stimulation (magenta), recorded with FFP (top) and CPS (bottom). (C) Mean ± standard deviation (STD) of optogenetically evoked activity when exciting jGCaMP8m at 470 (blue) and 405 (purple) nm recorded with FFP (top) and CPS (bottom). Twenty trials were averaged (solid lines) for each system. (D and E) The peak amplitude of averaged trials (n = 20) in three different mice (n = 3) when exciting jGCaMP8m at 470 nm (D) or 405 nm (E), recorded with FFP (blue, left) or CPS (black, right). Data is shown as Mean ± STD. (F) Ratios of FFP vs. CPS-recorded signals when excited at 470 (blue) and 405 nm (purple). Data is shown as Mean ± STD.
Figure 5
Figure 5
Characterization of signal contributions (A) Bar graph indicating the relative signal contributions of ambient background light (black), fiber fluorescence (blue), implant fluorescence (light blue), brain tissue (red), and jGCaMP8m (green) to the FFP signal. (B) Standard deviation (STD) of fiber auto-fluorescence (reference signal) as a function of signal amplitude, exciting the fiber at 470 (blue) and 405 nm (purple). (C) Amplitude of reference signal divided by its STD as a function of reference signal amplitude. (D) Fluorescence of different FFP signal components (fiber, implants, native brain tissue, and jGCaMP8m) (from left to right) with excitation light of 470 (blue, left) and 405 nm (purple, right). Inset: zoom in of implant auto-fluorescence by different distributors. Individual data points show independent measurements. Bars show mean ± STD. (E) Same as (A), but for photometry signals recorded with the CPS.
Figure 6
Figure 6
ChrimsonR-evoked calcium responses with fiber photometry recordings of NIR-GECO2 (A) Spectra of NIR-GECO2 and ChrimsonR (top) along with filter properties of excitation (magenta and brown) and emission filters (black; bottom). (B) Histological verification of NIR-GECO2 expression (magenta) in CA1 hippocampal neurons (cyan: DAPI staining). (C) Chrimson-evoked (magenta) calcium transients of NIR-GECO2 (bleach-corrected 650 nm functional channel). (D) ΔF/F0 of 60 individual trials of stimulation in an animal injected with NIR-GECO2 and ChrimsonR (left), NIR-GECO2 only (center), or without any injection (right). (E) Mean ± standard error of the mean (SEM) of the traces shown in (D). For the wild-type condition, two additional animals were measured. Gray traces indicate the mean ± SEM of control trials starting at randomly selected time points of the same recording. (F) In vitro experiments in organotypic slice cultures expressing the same constructs as in (E). In these experiments, 595-nm stimulation light was supplied by a separate optical fiber to excite ChrimsonR in the entire slice.
Figure 7
Figure 7
Experimental design and validation of temporally interleaved multi-color FFP recordings (A) Spectra of GrabNE1h and jRGECO1a (top) along with transmittance of excitation and emission filters (bottom). (B) Excitation and acquisition scheme: blue and green light pulses are temporally interleaved for respective excitation of a green and a red indicator (top two traces). The fluorescence of the indicator is detected by the same photodetector (third row from top) and digitized by an analog-digital converter in temporally interleaved manner (bottom). For each sampling point, a baseline measurement is taken before the onset of the excitation light (smaller peaks in the bottom trace), which is subtracted from the measurement of the excited state (larger peaks) to correct for background illumination. (C) Viral transduction of organotypic hippocampal slices with grabNE1h and jRGECO1a. (D) Bicuculline-induced calcium transients (red), together with the response of grabNE1h to the subsequent application of norepinephrine. (E) Spectra of Alexa fluorophores, along with transmittance of excitation and emission filters (bottom) for the recording of three spectrally separated signals. (F) Spectrogram of the triple-color configuration (excitation light of 490, 548, and 650 nm, from top to bottom) using three Alexa fluorophores. Auto-fluorescence spectra (gray lines) are subtracted from the raw spectra (colored thin line) to derive the actual signal of the indicator (corrected spectrum; colored line). Indicator spectra are plotted in black. (G) The relative intensity of temporally interleaved photometry recordings was achieved with different excitation lights (490, 550, and 650 nm; top to bottom) when pointing the fiber on microscopy slides with Alexa fluorophores.

Comment in

  • Fused fiber couplers for fiber photometry.
    Legaria AA, Kravitz AV. Legaria AA, et al. Cell Rep Methods. 2023 Mar 27;3(3):100439. doi: 10.1016/j.crmeth.2023.100439. eCollection 2023 Mar 27. Cell Rep Methods. 2023. PMID: 37056372 Free PMC article.

Similar articles

Cited by

References

    1. Adelsberger H., Garaschuk O., Konnerth A. Cortical calcium waves in resting newborn mice. Nat. Neurosci. 2005;8:988–990. doi: 10.1038/nn1502. - DOI - PubMed
    1. Girven K.S., Sparta D.R. Probing deep brain circuitry: new advances in in vivo calcium measurement strategies. ACS Chem. Neurosci. 2017;8:243–251. doi: 10.1021/acschemneuro.6b00307. - DOI - PubMed
    1. Wang Y., DeMarco E.M., Witzel L.S., Keighron J.D. A selected review of recent advances in the study of neuronal circuits using fiber photometry. Pharmacol. Biochem. Behav. 2021;201:173113. doi: 10.1016/j.pbb.2021.173113. - DOI - PubMed
    1. Ziv Y., Burns L.D., Cocker E.D., Hamel E.O., Ghosh K.K., Kitch L.J., El Gamal A., Schnitzer M.J. Long-term dynamics of CA1 hippocampal place codes. Nat. Neurosci. 2013;16:264–266. doi: 10.1038/nn.3329. - DOI - PMC - PubMed
    1. Resendez S.L., Stuber G.D. In vivo calcium imaging to illuminate neurocircuit activity dynamics underlying naturalistic behavior. Neuropsychopharmacology. 2015;40:238–239. doi: 10.1038/npp.2014.206. - DOI - PMC - PubMed

Publication types

LinkOut - more resources