. 2023 Mar 6;3(3):100420.
doi: 10.1016/j.crmeth.2023.100420. eCollection 2023 Mar 27.

SEQUIN is an R/Shiny framework for rapid and reproducible analysis of RNA-seq data

Affiliations

SEQUIN is an R/Shiny framework for rapid and reproducible analysis of RNA-seq data

Claire Weber et al. Cell Rep Methods. .

Abstract

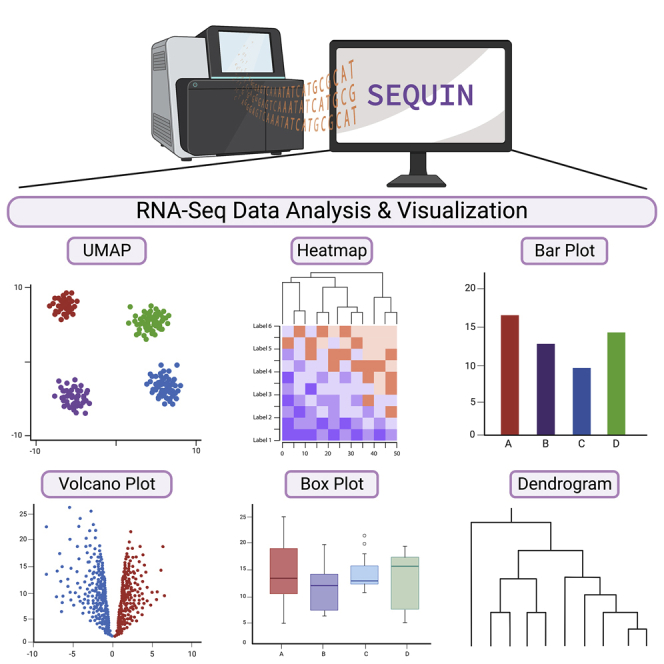
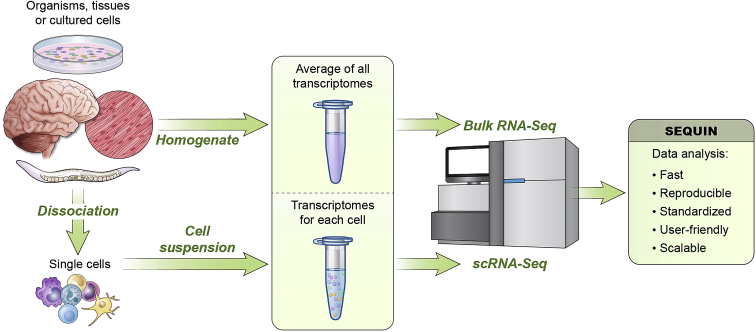
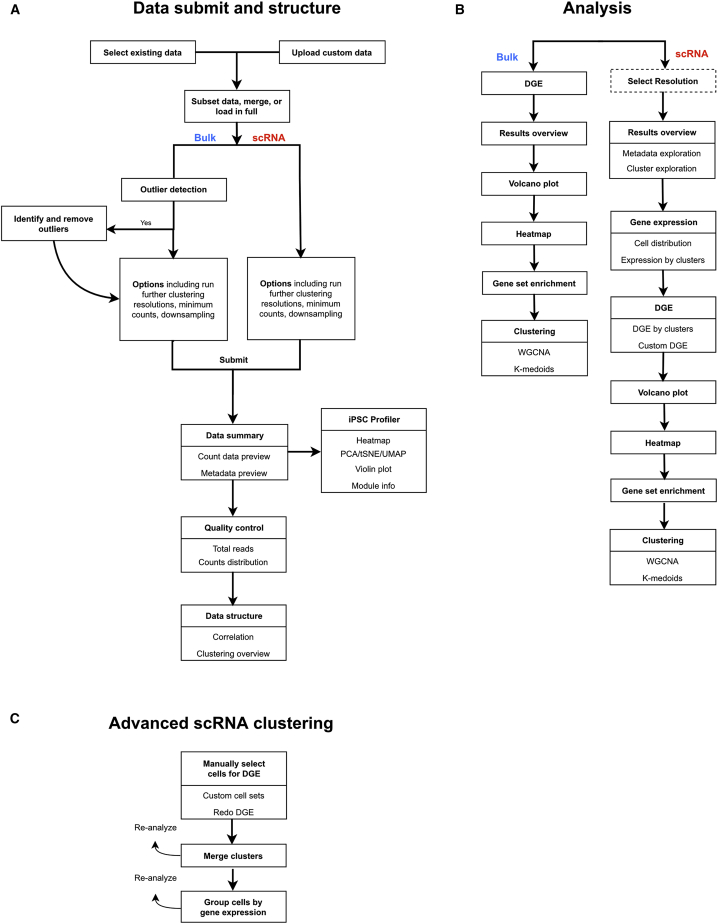
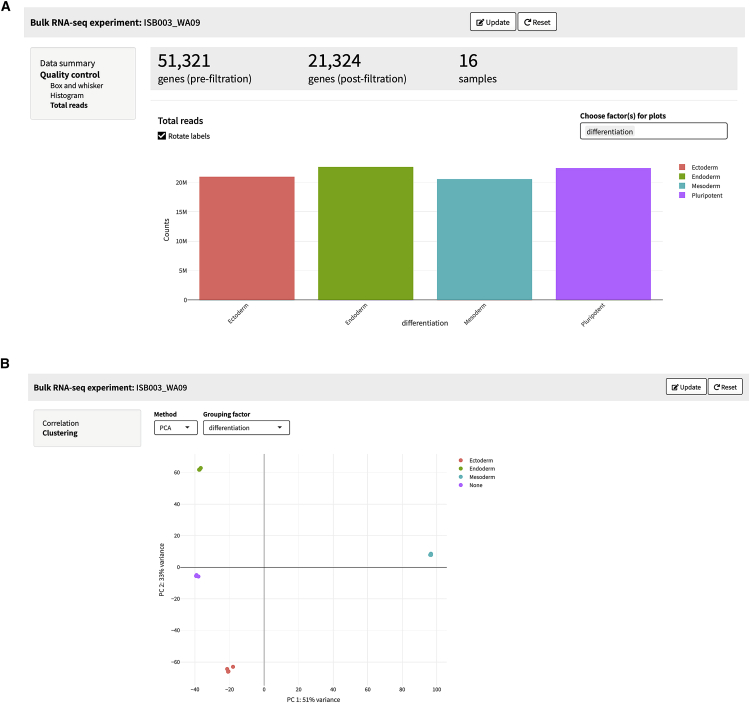
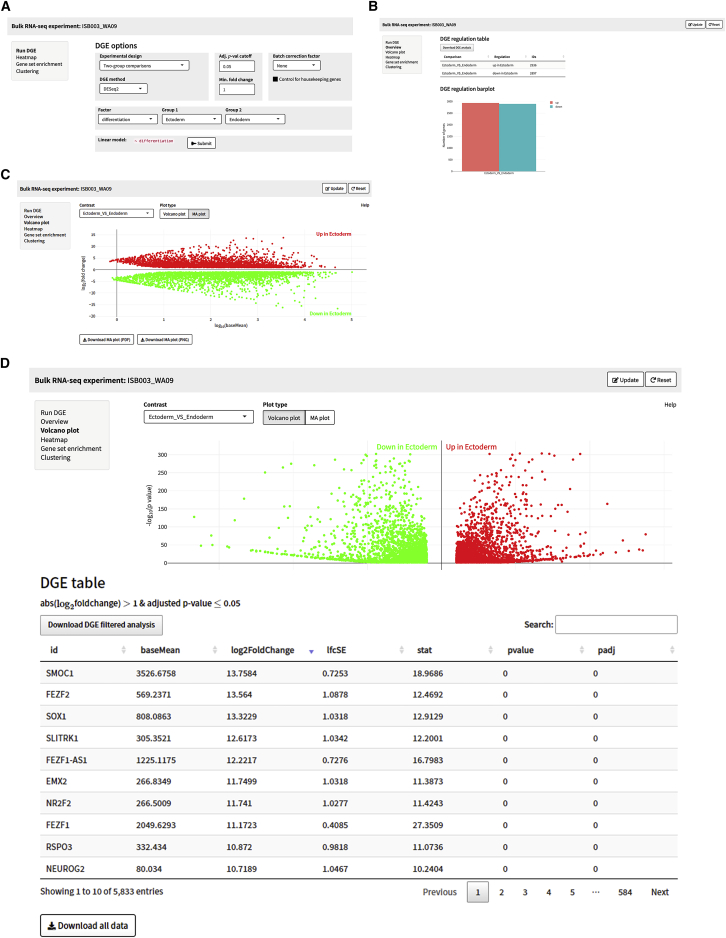
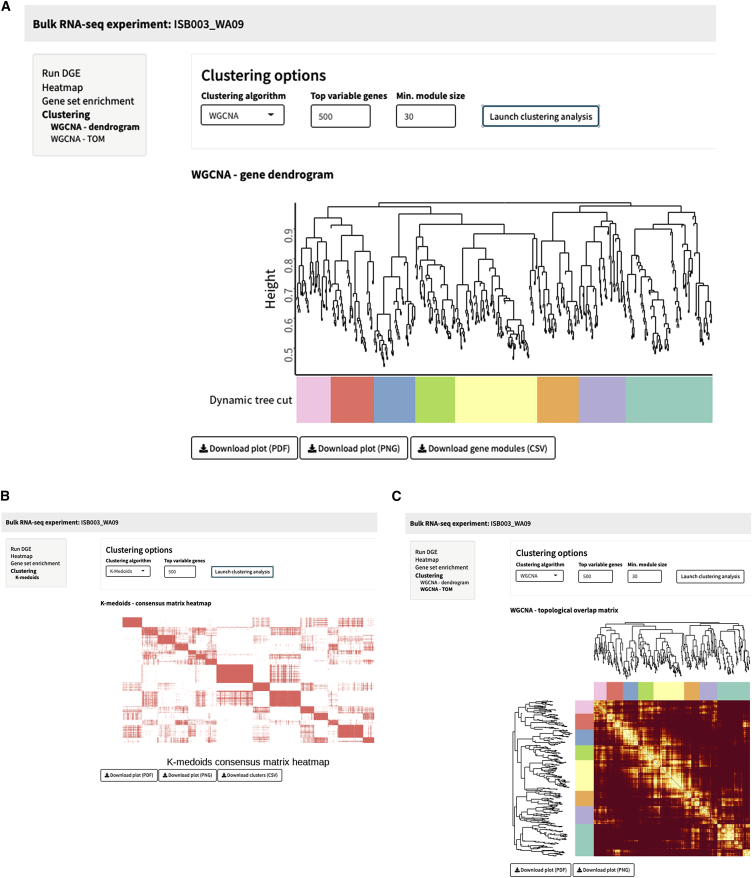
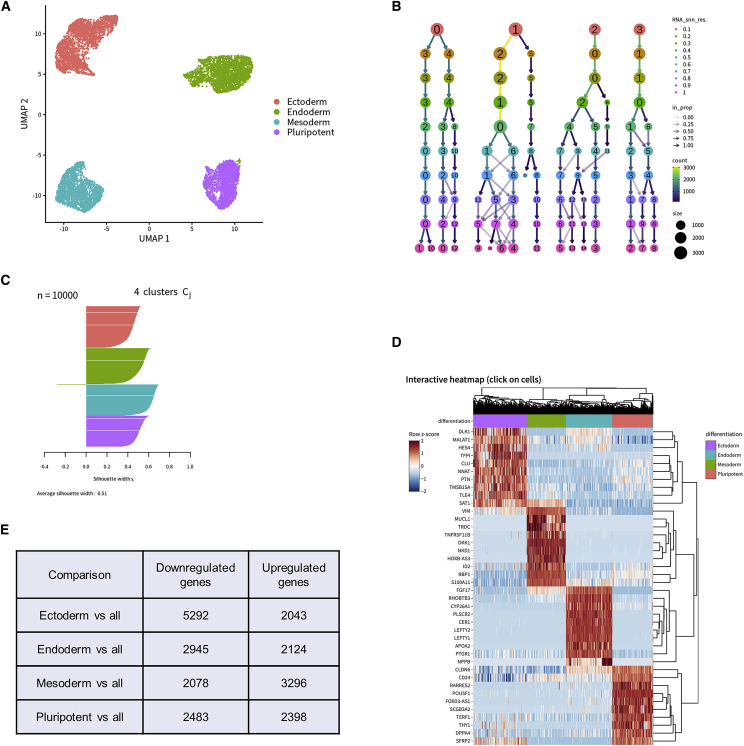
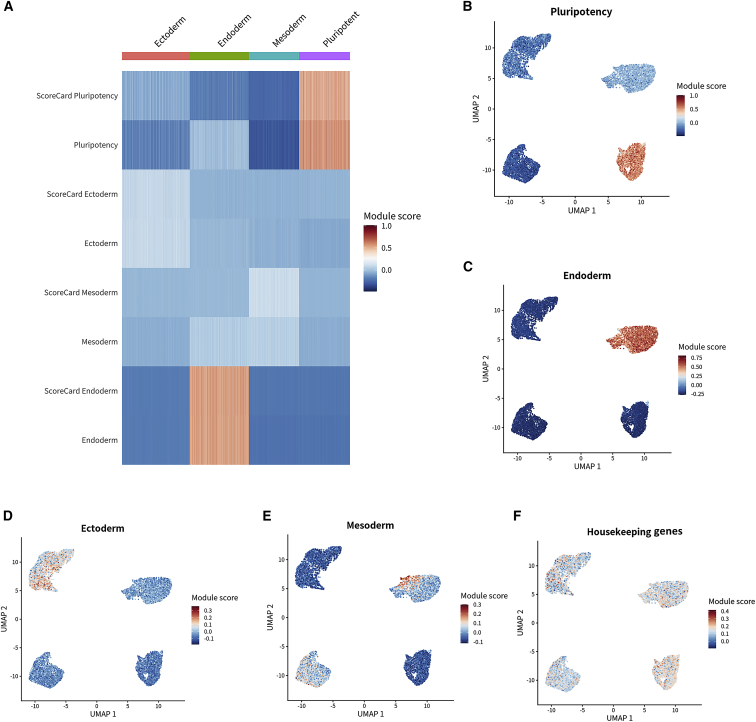
SEQUIN is a web-based application (app) that allows fast and intuitive analysis of RNA sequencing data derived for model organisms, tissues, and single cells. Integrated app functions enable uploading datasets, quality control, gene set enrichment, data visualization, and differential gene expression analysis. We also developed the iPSC Profiler, a practical gene module scoring tool that helps measure and compare pluripotent and differentiated cell types. Benchmarking to other commercial and non-commercial products underscored several advantages of SEQUIN. Freely available to the public, SEQUIN empowers scientists using interdisciplinary methods to investigate and present transcriptome data firsthand with state-of-the-art statistical methods. Hence, SEQUIN helps democratize and increase the throughput of interrogating biological questions using next-generation sequencing data with single-cell resolution.

Keywords: R/Shiny app; RNA sequencing; UMAP; data visualization; dimensionality reduction; gene expression; iPSC profiler; single-cell analysis; t-SNE; transcriptome analysis.


Conflict of interest statement

The authors declare no conflicts of interest.

Figures

None
Graphical abstract
Figure 1
Figure 1
Versatility of SEQUIN for bulk and single-cell RNA-seq Overview of experimental models and next-generation sequencing that generate transcriptomic datasets. Two paths of data generation are shown: “bulk” populations of cells from homogenized organisms, tissues, or cultured cells or single-cell suspension after dissociation. The first path leads to averaged gene expression values of the transcriptomes, while the second creates a transcriptome library of each cell. Either sequencing data format can be input to SEQUIN for analysis, which is a free and fully featured R/Shiny application for both types of data.
Figure 2
Figure 2
Overview of workflows describing SEQUIN (A) Diagram depicting the workflow for the bulk and single-cell RNA (scRNA) sequencing data submit options, data summary, quality control and data structure sections of the app. (B) Workflow for analysis sections specific to bulk or scRNA. The select resolution (in dashed box) is only available when the user selects “Run multiple resolutions using Seurat.” (C) Workflow for advanced scRNA clustering with key features and options.
Figure 3
Figure 3
Bulk RNA-seq analysis (A) Quality control step showing total reads by differentiation stage, which are consistently on average 21 million total reads by differentiation stage of dataset ISB003 (WA09). (B) PCA plot of samples and replicates showing that PC1 accounts for 51% and PC2 33% of the variance in the data, respectively. Samples and replicates separate strongly by PC1 and PC2 clustering depending on lineage specification.
Figure 4
Figure 4
Example analyses of DE genes (A) DGE analysis options for the bulk RNA-seq analysis of ISB003 (WA09) showing two-group comparisons by differentiation using DESeq2. The adjusted p value cutoff is 0.05, with a minimum fold change of 1 and the linear model ∼differentiation. (B) Total DE genes by linear model showing the total number of genes up- and downregulated in the ectoderm versus endoderm comparison. (C) MA plot of total up- and downregulation DE genes for the ectoderm versus endoderm comparison. (D) Volcano plot of total up- and downregulation DE genes for the ectoderm and endoderm comparison. Test p values and adjusted p values come from DESeq2 default statistical methods, which are the Wald test and Benjamini-Hochberg multiple test correction.
Figure 5
Figure 5
WGCNA and k-medoid clustering (A and B) Weighted gene co-expression network analysis (WGCNA) clustering of ISB003 (WA09). The WGCNA gene dendrogram for ISB003 (WA09) is based on the hierarchical clustering of all genes. Colors below the row and column dendrograms are dynamic tree cuts, which indicate size (total number of cells per cluster). The WGCNA topological matrix plot is the correlation between pairs of genes and pairs of gene modules. A k-medoids consensus matrix heatmap based on all genes and samples from the same dataset (B). (C) k-medoids heatmap reflects an estimate of the similarity between pairs of genes.
Figure 6
Figure 6
Analysis of iPSC differentiation into embryonic germ layers (A) UMAP clearly separates clusters by differentiation stage. (B) Clustree flowchart identifies how cells sort into clusters at various resolutions. (C) Silhouette plot cleanly separates clusters at 0.1 resolution. (D) Interactive heatmap with a custom set of lineage-specific genes. (E) Total up- and downregulated DE genes by differentiation stage compared with the rest of the clusters.
Figure 7
Figure 7
iPSC Profiler module scores (A) Heatmap module scores from both ScoreCard and iPSC Profiler indicating similar scores for pluripotency, ectoderm, mesoderm, and endoderm. (B) UMAP plot colored by pluripotency module scores reveals high scores in hESCs (WA09). (C–E) Endoderm module scores are highest in the endoderm cluster. Similarly, the ectoderm and mesoderm clusters are represented by their respective modules. (F) Module for housekeeping genes yields comparable results across all cell clusters analyzed.

References

    1. Wang Y.J., Schug J., Lin J., Wang Z., Kossenkov A., Kaestner K.H. Comparative analysis of commercially available single-cell RNA sequencing platforms for their performance in complex human tissues. bioRxiv. 2019 doi: 10.1101/541433. Preprint at. - DOI
    1. Adossa N., Khan S., Rytkönen K.T., Elo L.L. Computational strategies for single-cell multi-omics integration. Comput. Struct. Biotechnol. J. 2021;19:2588–2596. doi: 10.1016/j.csbj.2021.04.060. - DOI - PMC - PubMed
    1. Simoneau J., Dumontier S., Gosselin R., Scott M.S. Current RNA-seq methodology reporting limits reproducibility. Brief. Bioinform. 2021;22:140–145. doi: 10.1093/bib/bbz124. - DOI - PMC - PubMed
    1. Stupple A., Singerman D., Celi L.A. The reproducibility crisis in the age of digital medicine. NPJ Digit. Med. 2019;2:2. doi: 10.1038/s41746-019-0079-z. - DOI - PMC - PubMed
    1. Jeng S.L., Chi Y.C., Ma M.C., Chan S.H., Sun H.S. Gene expression analysis of combined RNA-seq experiments using a receiver operating characteristic calibrated procedure. Comput. Biol. Chem. 2021;93:107515. doi: 10.1016/j.compbiolchem.2021.107515. - DOI - PubMed

Publication types

LinkOut - more resources