. 2023 Mar 5;13(5):1470-1489.
doi: 10.7150/thno.77597. eCollection 2023.

Xeno-free cultured mesenchymal stromal cells release extracellular vesicles with a "therapeutic" miRNA cargo ameliorating cartilage inflammation in vitro

Affiliations

Xeno-free cultured mesenchymal stromal cells release extracellular vesicles with a "therapeutic" miRNA cargo ameliorating cartilage inflammation in vitro

Maria Elisabetta F Palamà et al. Theranostics. .

Abstract

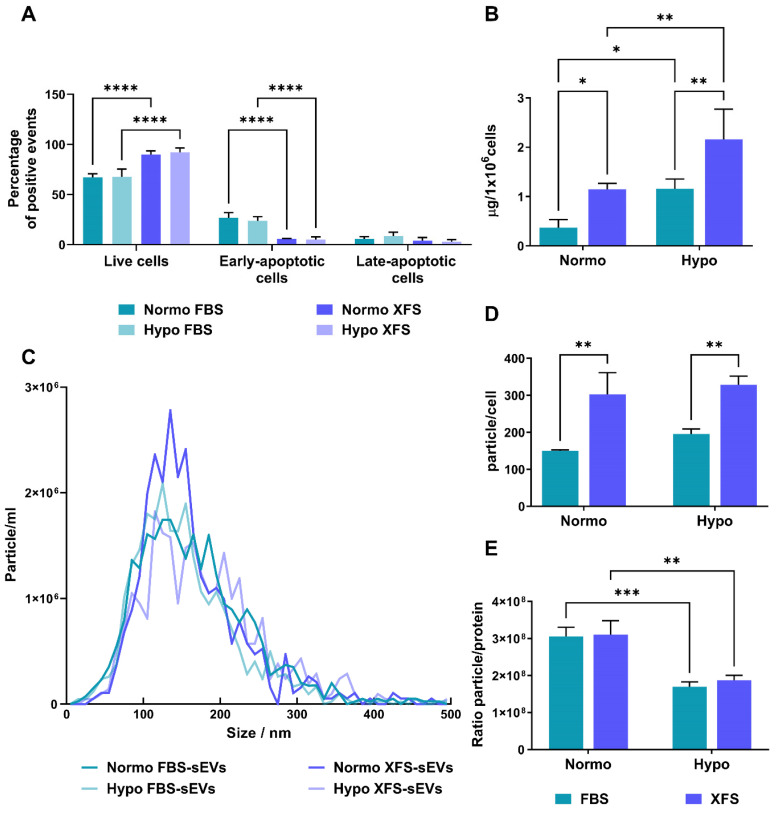
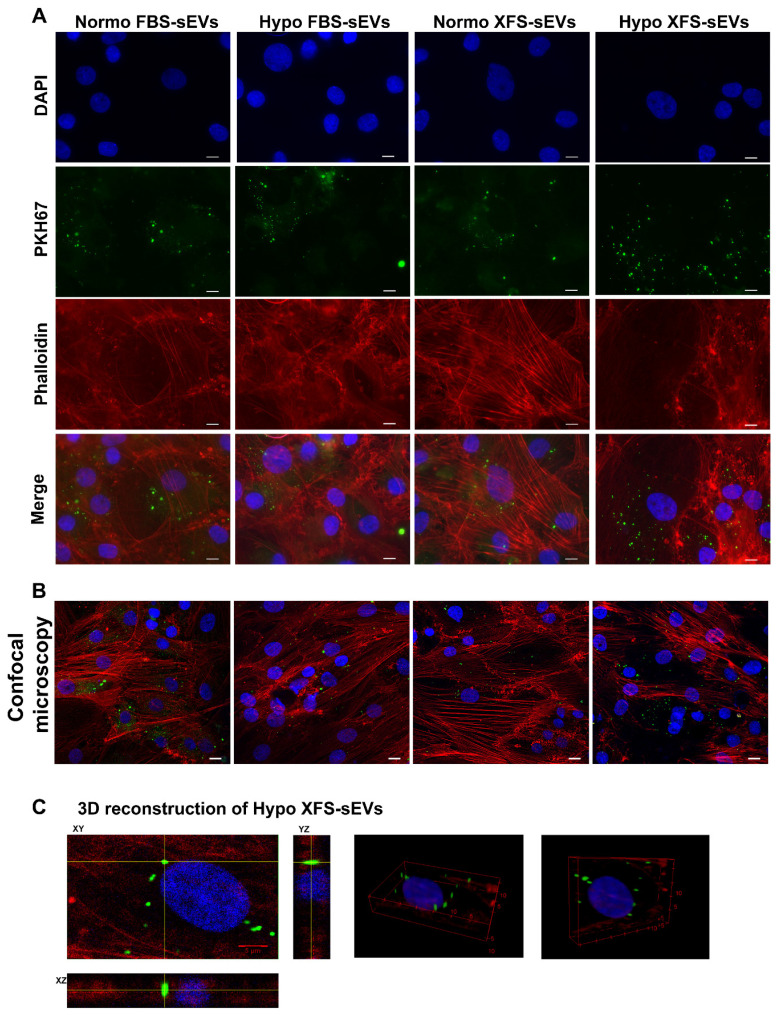
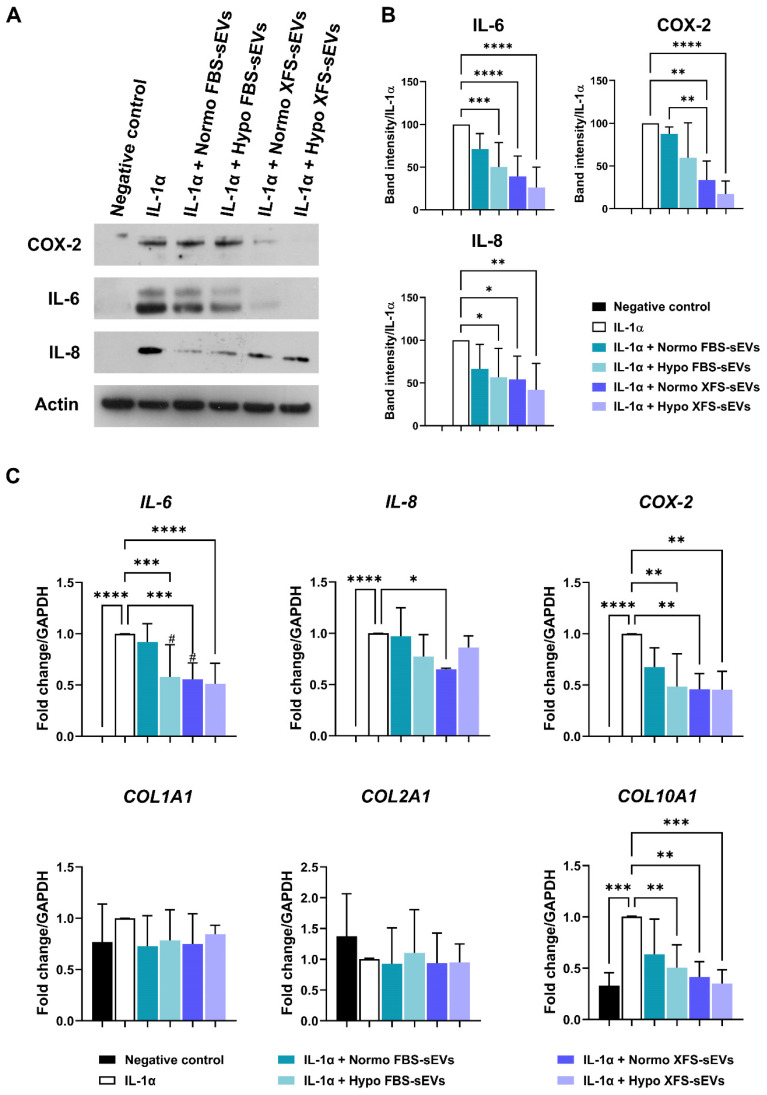
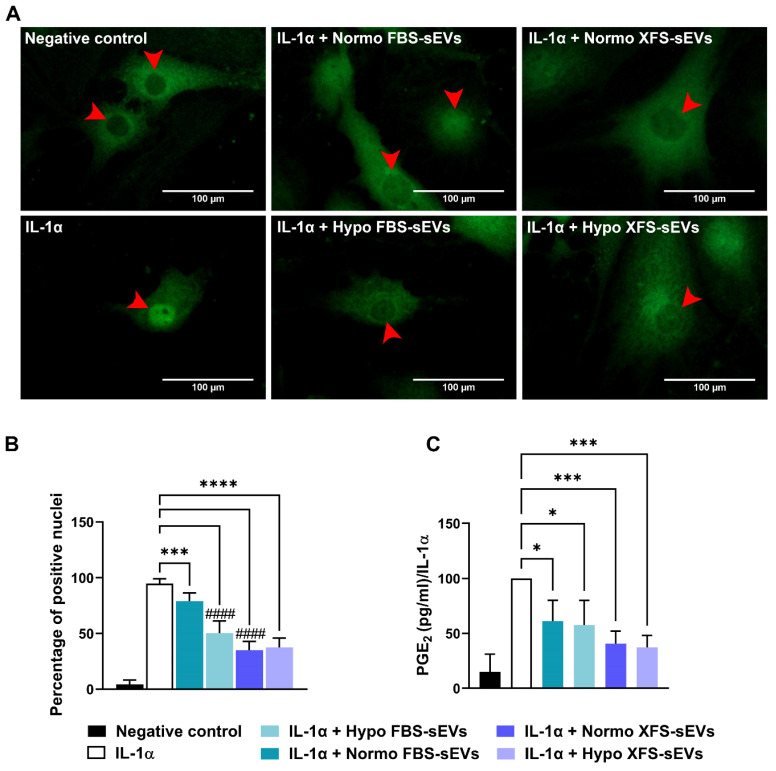
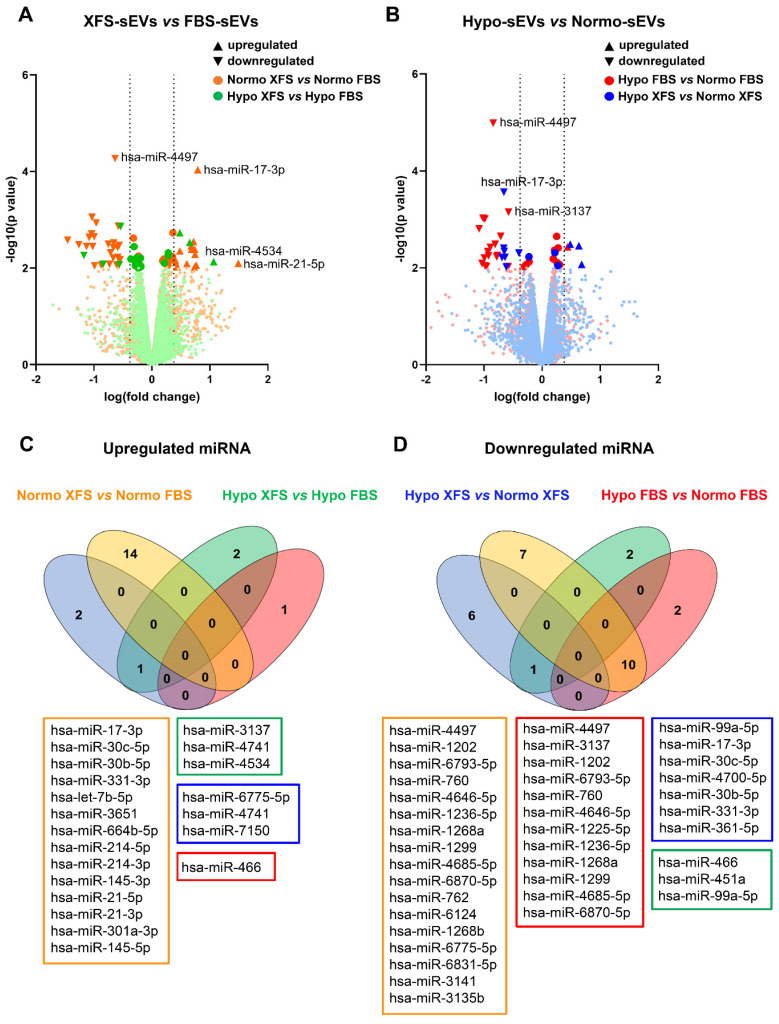
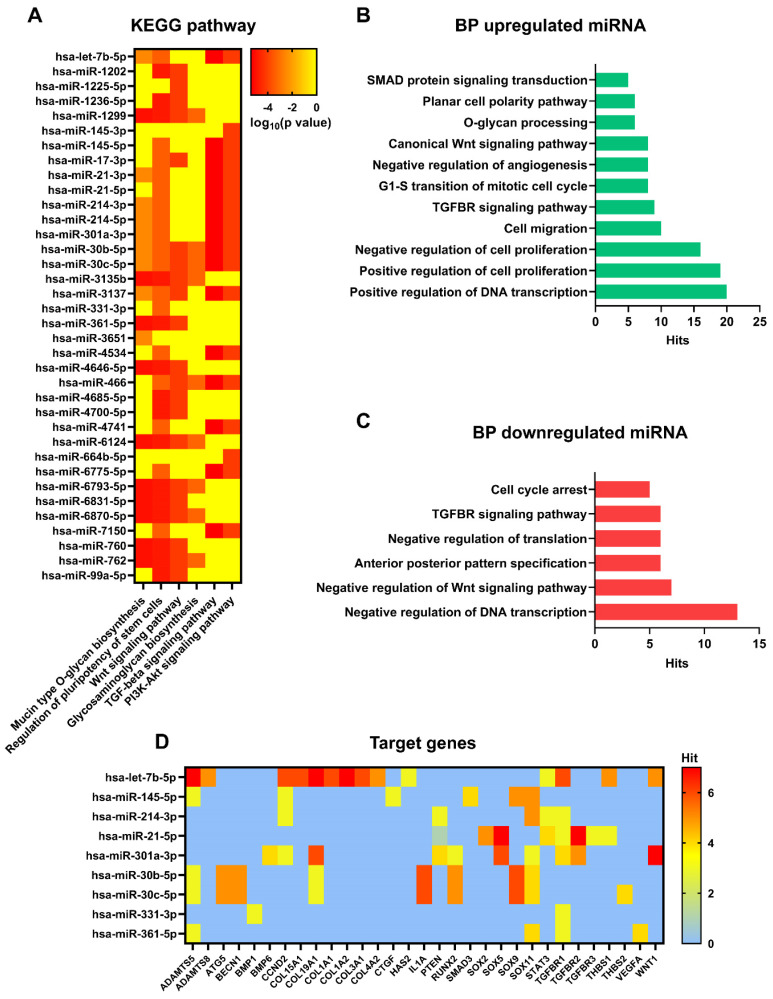
Rationale: Mesenchymal stromal cells (MSCs)-derived extracellular vesicles (EVs) emerged as an innovative strategy for the treatment of chronic disorders such as osteoarthritis (OA). Biological activity of EVs is generally driven by their cargo, which might be influenced by microenvironment. Therefore, pre-conditioning strategies, including modifications in culture conditions or oxygen tension could directly impact on MSCs paracrine activity. In this study we selected an appropriate preconditioning system to induce cells to perform the most suitable therapeutic response by EV-encapsulated bioactive factors. Methods: A xeno-free supplement (XFS) was used for isolation and expansion of MSCs and compared to conventional fetal bovine serum (FBS) culture. Bone Marrow-derived MSCs (BMSCs) were pre-conditioned under normoxia (20% O2) or under hypoxia (1% O2) and EVs production was evaluated. Anti-OA activity was evaluated by using an in vitro inflammatory model. miRNA content was also explored, to select putative miRNA that could be involved in a biological function. Results: Modulation of IL-6, IL-8, COX-2 and PGE2 was evaluated on hACs simultaneously treated with IL-1α and BMSC-derived EVs. FBS-sEVs exerted a blunt inhibitory effect, while a strong anti-inflammatory outcome was achieved by XFS-sEVs. Interestingly, in both cases hypoxia pre-conditioning allowed to increase EVs effectiveness. Analysis of miRNA content showed the upregulation in XFS-hBMSC-derived EVs of miRNA known to have a chondroprotective role, such as let-7b-5p, miR-17, miR-145, miR-21-5p, miR-214-3p, miR-30b-5p, miR-30c-5p. Activated pathways and target genes were investigated in silico and upregulated miRNAs functionally validated in target cells. MiR-145 and miR-214 were found to protect chondrocytes from IL-1α-induced inflammation and to reduce production of pro-inflammatory cytokines. Conclusions: XFS medium was found to be suitable for isolation and expansion of MSCs, secreting EVs with a therapeutic cargo. The application of cells cultured exclusively in XFS overcomes issues of safety associated with serum-containing media and makes ready-to-use clinical therapies more accessible.

Keywords: extracellular vesicles; mesenchymal stromal cells; microRNA; osteoarthritis; xeno free medium.


Conflict of interest statement

Competing Interests: The authors have declared that no competing interest exists.

Figures

Figure 1
Figure 1
Characterization of secreting cells and quantification of sEVs. (A) Evaluation of apoptosis on secreting cells by flow cytometry on both FBS and XFS-hBMSCs after 72 hours pre-conditioning in both normoxic (20% O2) and hypoxic (1% O2) culture conditions. Concurrent staining with FITC-anti-annexin V and PI was used. Error bars represent S.D. (****) p < 0.0001, two-way ANOVA. (B) Quantification of protein content on Normo and Hypo FBS-sEVs and Normo and Hypo XFS-sEVs by BCA assay. Data are normalized on cell number (μg/106 cells). Error bars represent S.D. (*) p < 0.05, (**) p < 0.01, two-way ANOVA. (C) Nanoparticle Tracking Analysis (NTA) measuring size distribution of FBS- (green) and XFS-sEVs (blue) under normoxia ad hypoxia. (D) Comparison of particle number expressed as particles/cell. Error bars represent S.D. (**) p < 0.01, two-way ANOVA. (E) Ratio particle/protein. Error bars represent S.D. (**) p < 0.01, two-way ANOVA. Data are representative of at least three independent experiments.
Figure 2
Figure 2
Characterization of sEVs. (A) TEM micrographs of isolated sEVs. Scale bar: 500 nm. (B) Western blot analysis on Normo and Hypo FBS- and XFS-sEVs. Control cell lysates were also loaded. Specific expressions of CD63, CD81, flotillin, syntenin and calnexin were investigated.
Figure 3
Figure 3
Non-conventional flow cytometry strategy used to characterize sEVs. (A) CFDA-SE staining for identification of intact vesicles. Red areas identify CFDA-SE positive events. EVs were stained with CFDA-SE at 4 °C as "blank tube" (left), useful to define the appropriate dimensional gate when considering EVs stained with CFDA-SE at room temperature (right). (B) Size distribution of EV subtypes. Three dimensional gates were considered: EVs ≤100 nm (orange), 100 nm ≤ EVs ≤ 160 nm (blue) and 160 nm ≤ EVs ≤ 900 nm (red). (C) Quantification of CD9-, CD63- and CD81- positive events falling within the CFDA-SE gate. Data are presented as ratio between mean fluorescence intensity (MFI) of sEVs stained with a specific antibody and MFI of correspondent isotype control (relative MFI). Data are representative of at least three independent experiments.
Figure 4
Figure 4
Uptake of EVs on OA-hACs. (A) Representative images of PKH67-stained sEVs internalized by OA-hACs. From the top, pictures show the nuclei (DAPI), sEVs (PKH67), actin cytoskeleton (Phalloidin) and merge. Scale bar: 20 μm. (B) Confocal microscopy. (C) 3D reconstruction.
Figure 5
Figure 5
Biological effect of sEVs on OA-hACs. (A) Representative images of western blot of secreted IL-6 and IL-8 on conditioned media and COX-2 and actin of cell lysates of hACs treated with IL-1α ± Normo or Hypo FBS- or XFS-sEVs. (B) Quantification of band intensity of IL-6, IL-8 and COX-2. Intensity values were normalized to actin protein expression of the same experiment. Data are reported as normalized intensity on IL-1α positive control. Error bars represent S.D. (*) p < 0.05, (**) p < 0.01, (***) p < 0.001, (****) p < 0.0001, one-way ANOVA. Data are representative of four independent experiments. (C) Expression levels of IL-6, IL-8, COX-2, COLL-I, COLL-II and COLL-X quantified by real time-PCR of hACs treated with IL-1α ± Normo or Hypo FBS- or XFS-sEVs. Error bars represent S.D. (*) p < 0.05, (**) p < 0.01, (***) p < 0.001, (****) p < 0.0001, (#) p < 0.05 vs. Normo FBS-sEVs, one-way ANOVA. Data are representative of four independent experiments.
Figure 6
Figure 6
Mechanism of action of sEVs on OA-hACs. (A) NF-kB nuclear translocation in OA hACs in response to sEVs treatment. Red arrows show the nucleus of the cells. Images are representative of four independent experiments. Scale bar: 100μm. (B) Quantification of NF-kB nuclear translocation, calculated as number of cells with positive nuclei on total cell number. Error bars represent S.D. (***) p < 0.001, (****) p < 0.0001, comparison vs. IL-1a, (####) p < 0.0001, comparison vs. IL-1a + Normo FBS-sEVs, one-way ANOVA. (C) PGE2 ELISA quantification, expressed as percentage of positive control (IL-1α). Error bars represent S.D. (*) p < 0.05, (***) p < 0.001, one-way ANOVA.
Figure 7
Figure 7
Characterization of miRNA content of sEVs. (A) Volcano plot showing differentially expressed miRNA in XFS- compared to FBS-sEVs, both in normoxia (orange) and hypoxia (green). (B) Volcano plot showing differentially expressed miRNA in Hypo- compared to Normo-sEVs, both in FBS (red) and XFS (blue). (C) Venn diagram showing upregulated miRNA in Normo XFS-sEVs vs. Normo FBS-sEVs (orange), Hypo XFS-sEVs vs. Hypo FBS-sEVs (green), Hypo XFS-sEVs vs. Normo XFS-sEVs (blue), Hypo FBS-sEVs vs. Normo FBS-sEVs (red). (D) Venn diagram showing downregulated miRNA in Normo XFS-sEVs vs. Normo FBS-sEVs (orange), Hypo XFS-sEVs vs. Hypo FBS-sEVs (green), Hypo XFS-sEVs vs. Normo XFS-sEVs (blue), Hypo FBS-sEVs vs. Normo FBS-sEVs (red).
Figure 8
Figure 8
Pathway, biological processes, and target genes of expressed miRNA. (A) Heat map showing main pathways regulated by expressed miRNA, analysed with DIANA myRPath 3.0. Colour scale is representative of log10 (p value). (B) Biological processes of upregulated miRNA, analysed with DIANA myRPath 3.0. (C) Biological processes of downregulated miRNA, analysed with DIANA myRPath 3.0. (D) Heat map showing target genes regulated by expressed miRNA, analysed with miRsystem. Colour scale is representative of hits number.
Figure 9
Figure 9
Functional study of selected miRNA in OA-hACs. Human articular chondrocytes were transfected with 100nM hsa-miR301a, hsa-let-7b, hsa-miR145, hsa-miR214, hsa-miR21, hsa-miR30b, hsa-miR30c or with a scramble control. Graphs show the relative expression of target genes IL-6, IL-8, COX-2, COLL-I, COLL-II, COLL-X, SOX9 and RUNX-2. Error bars represent S.D. (*) p < 0.05, (**) p < 0.01, (****) p < 0.0001, one-way ANOVA. Data are representative of five independent experiments.

Similar articles

Cited by

References

    1. Toh WS, Lai RC, Hui JHP, Lim SK. MSC exosome as a cell-free MSC therapy for cartilage regeneration: Implications for osteoarthritis treatment. Semin Cell Dev Biol. 2017;67:56–64. - PubMed
    1. Kraus VB, Blanco FJ, Englund M, Karsdal MA, Lohmander LS. Call for standardized definitions of osteoarthritis and risk stratification for clinical trials and clinical use. Osteoarthr. Cartil. 2015;23:1233–41. - PMC - PubMed
    1. Mianehsaz E, Mirzaei HR, Mahjoubin-Tehran M, Mesenchymal stem cell-derived exosomes: a new therapeutic approach to osteoarthritis? Stem Cell Res Ther. 2019. 10. - PMC - PubMed
    1. Fuggle NR, Cooper C, Oreffo ROC. et al. Alternative and complementary therapies in osteoarthritis and cartilage repair. Aging Clin Exp Res. 2020;32:547. - PMC - PubMed
    1. de Bari C, Roelofs AJ. Stem cell-based therapeutic strategies for cartilage defects and osteoarthritis. Curr Opin Pharmacol. 2018;40:74–80. - PubMed

Publication types