

Dual fluorescent hollow silica nanofibers for in situ pH monitoring using an optical fiber
- PMID: 37056611
- PMCID: PMC10089112
- DOI: 10.1039/d2na00943a
Dual fluorescent hollow silica nanofibers for in situ pH monitoring using an optical fiber
Abstract
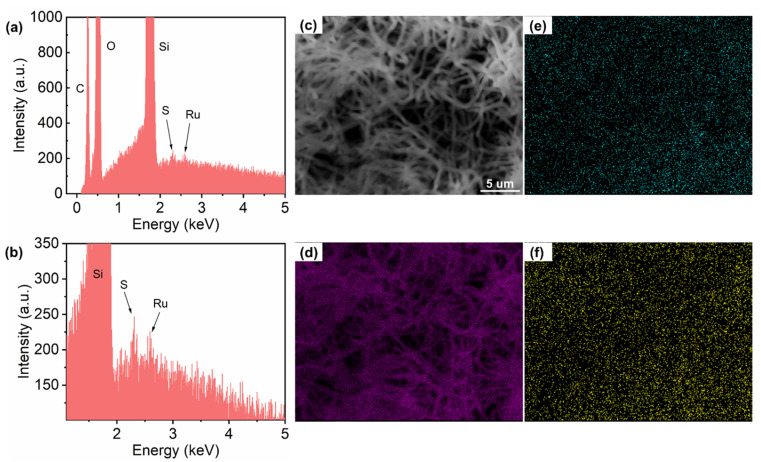
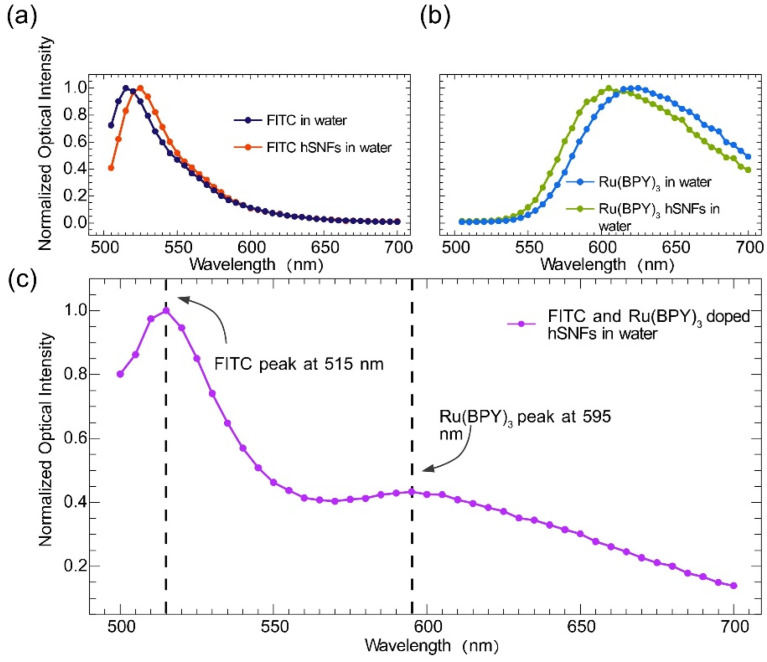
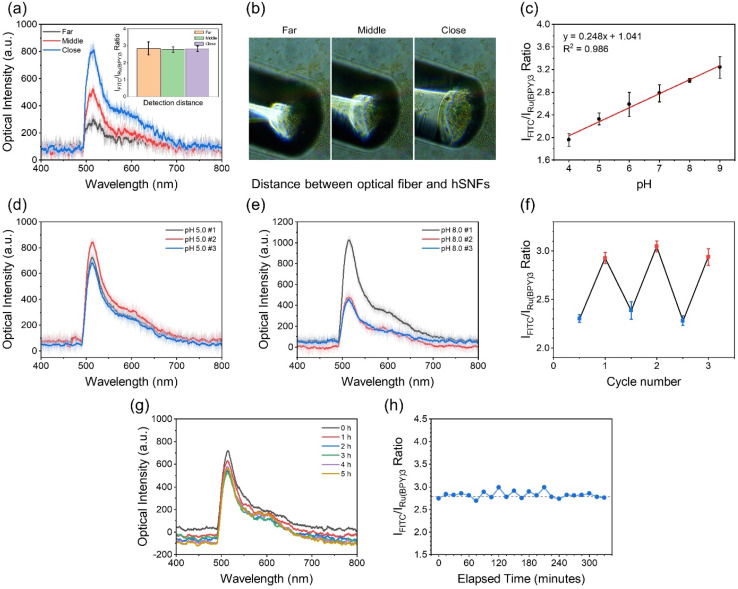
This study reports a sensitive and robust pH sensor based on dual fluorescent doped hollow silica nanofibers (hSNFs) for in situ and real-time pH monitoring. Fluorescein isothiocyanate (FITC) and tris(2,2'-bipyridyl)dichlororuthenium(ii) hexahydrate (Ru(BPY)3) were chosen as a pH sensitive dye and reference dye, respectively. hSNFs were synthesized using a two-step method in a reverse micelle system and were shown to have an average length of 6.20 μm and average diameter of 410 nm. The peak intensity ratio of FITC/Ru(BPY)3 was used to calibrate to solution pH changes. An optical-fiber-based fluorescence detection system was developed that enabled feasible and highly efficient near-field fluorescence detection. The developed system enables fully automated fluorescence detection, where components including the light source, detector, and data acquisition unit are all controlled by a computer. The results show that the developed pH sensor works in a linear range of pH 4.0-9.0 with a fast response time of less than 10 s and minimal sample volume of 50 μL, and can be stored under dark conditions for one month without failure. In addition, the as-prepared hSNF-based pH sensors also have excellent long-term durability. Experimental results from ratiometric sensing confirm the high feasibility, accuracy, stability and simplicity of the dual fluorescent hSNF sensors for the detection of pH in real samples.
This journal is © The Royal Society of Chemistry.
Conflict of interest statement
The authors declare that they have no known competing financial interests or personal relationships that could have appeared to influence the work reported in this paper.
Figures


Similar articles
-
Fabrication of dual dye-doped silica nanotube as a fluorescent ratiometric pH sensor.J Nanosci Nanotechnol. 2014 Nov;14(11):8719-23. doi: 10.1166/jnn.2014.9974. J Nanosci Nanotechnol. 2014. PMID: 25958591
-
A fluorescence ratiometric nano-pH sensor based on dual-fluorophore-doped silica nanoparticles.Spectrochim Acta A Mol Biomol Spectrosc. 2007 Jun;67(2):517-21. doi: 10.1016/j.saa.2006.08.009. Epub 2006 Aug 12. Spectrochim Acta A Mol Biomol Spectrosc. 2007. PMID: 16965933
-
Noninvasive monitoring of intracellular pH change induced by drug stimulation using silica nanoparticle sensors.Anal Bioanal Chem. 2007 Jun;388(3):645-54. doi: 10.1007/s00216-007-1244-9. Epub 2007 Apr 18. Anal Bioanal Chem. 2007. PMID: 17440714
-
Ultrasonic atomizer based development of pH sensor for real time analysis.Sci Rep. 2020 Jul 2;10(1):10910. doi: 10.1038/s41598-020-68005-2. Sci Rep. 2020. PMID: 32616901 Free PMC article.
-
[In-site electrophoretic elution of excessive fluorescein isothiocyanate from fluorescent particles in gel for image analysis].Se Pu. 2022 Jul;40(7):610-615. doi: 10.3724/SP.J.1123.2022.04023. Se Pu. 2022. PMID: 35791599 Free PMC article. Chinese.
Cited by
-
Advancements in Optical Fiber Sensors for pH Measurement: Technologies and Applications.Sensors (Basel). 2025 Jul 9;25(14):4275. doi: 10.3390/s25144275. Sensors (Basel). 2025. PMID: 40732404 Free PMC article. Review.
-
A Ratiometric Fluorescence Nano pH Biosensor for Live-Cell Imaging Using Cerasome.Biosensors (Basel). 2025 Feb 16;15(2):114. doi: 10.3390/bios15020114. Biosensors (Basel). 2025. PMID: 39997016 Free PMC article.
References
-
- Kurkdjian A. Guern J. Annu. Rev. Plant Physiol. Plant Mol. Biol. 1989;40:271–303. doi: 10.1146/annurev.pp.40.060189.001415. - DOI
Grants and funding
LinkOut - more resources
Full Text Sources