. 2023 Mar 28:10:1066804.
doi: 10.3389/fmed.2023.1066804. eCollection 2023.

Global, regional, and national burden of chronic respiratory diseases and associated risk factors, 1990-2019: Results from the Global Burden of Disease Study 2019

Affiliations

Global, regional, and national burden of chronic respiratory diseases and associated risk factors, 1990-2019: Results from the Global Burden of Disease Study 2019

Xiang Chen et al. Front Med (Lausanne). .

Abstract

Background: The burden of chronic respiratory diseases has changed over the three decades. This study aims to describe the spatiotemporal trends of prevalence, mortality, and disability-adjusted life years (DALY) due to chronic respiratory diseases (CRDs) worldwide during 1990-2019 using data from the Global Burden of Disease Study 2019 (GBD 2019).

Methods: The prevalence, mortality, and DALY attributable to CRDs and risk factors from 1990 to 2019 were estimated. We also assessed the driving factors and potentiality for improvement with decomposition and frontier analyses, respectively.

Results: In 2019, 454.56 [95% uncertainty interval (UI): 417.35-499.14] million individuals worldwide had a CRD, showing a 39·8% increase compared with 1990. Deaths due to CRDs were 3.97 (95%UI: 3.58-4.30) million, and DALY in 2019 was 103.53 (95%UI: 94.79-112.27) million. Declines by average annual percent change (AAPC) were observed in age-standardized prevalence rates (ASPR) (0.64% decrease), age-standardized mortality rates (ASMR) (1.92%), and age-standardized DALY rates (ASDR) (1.72%) globally and in 5 socio-demographic index (SDI) regions. Decomposition analyses represented that the increase in overall CRDs DALY was driven by aging and population growth. However, chronic obstructive pulmonary disease (COPD) was the leading driver of increased DALY worldwide. Frontier analyses witnessed significant improvement opportunities at all levels of the development spectrum. Smoking remained a leading risk factor (RF) for mortality and DALY, although it showed a downward trend. Air pollution, a growing factor especially in relatively low SDI regions, deserves our attention.

Conclusion: Our study clarified that CRDs remain the leading causes of prevalence, mortality, and DALY worldwide, with growth in absolute numbers but declines in several age-standardized estimators since 1990. The estimated contribution of risk factors to mortality and DALY demands the need for urgent measures to improve them.

Systematic review registration: http://ghdx.healthdata.org/gbd-results-tool.

Keywords: Global Burden of Diseases; Injuries; and Risk Factors Study; chronic respiratory diseases; epidemiology; risk factor; sociodemographic index.


Conflict of interest statement

The authors declare that the research was conducted in the absence of any commercial or financial relationships that could be construed as a potential conflict of interest.

Figures
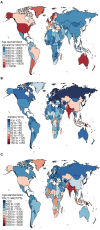
Figure 1
Figure 1
Global ASPR (A), ASMR (B), and ASDR (C) of CRDs in 204 countries and territories in 2019. ASPR, age-standardized prevalence rate; ASMR, age-standardized mortality rate; ASDR, age-standardized DALY rate; DALY, disability-adjusted life year; CRDs, chronic respiratory diseases.
Figure 2
Figure 2
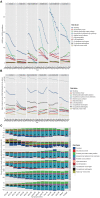
Changes in CRDs DALYs according to global population-level determinants (A) and 5 causes (B), by SDI (1990–2019). (A) Changes in CRDs DALYs according to global population-level determinants and by SDI (1990–2019). Global population-level determinants include aging, population growth, and epidemiological change. The black dot represents the overall value of change contributed by all 3 components. For each component, the magnitude of a positive value indicates a corresponding increase in CRDs DALYs attributed to the component; the magnitude of a negative value indicates a corresponding decrease in CRDs DALYs attributed to the related component. (B) Changes in CRDs DALYs according to the global 5 causes and by SDI (1990–2019). The black dot represents the overall value of change contributed by all 5 causes. For each component, the magnitude of a positive value indicates a corresponding increase in CRDs DALYs attributed to the component; the magnitude of a negative value indicates a corresponding decrease in CRDs DALYs attributed to the related component. CRDs, chronic respiratory diseases; COPD, chronic obstructive pulmonary disease; ILD and PS, interstitial lung disease and pulmonary sarcoidosis; SDI, sociodemographic index; DALY, disability-adjusted life year.
Figure 3
Figure 3
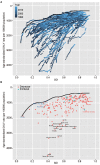
Frontier analysis based upon CRDs ASDR and SDI over decades (1990–2019) and in 2019. (A) Frontier analysis based upon CRDs ASDR and SDI (1990–2019). The color scale showed the years from 1990 (dark blue) to 2019 (light blue). The solid black color was used to delineate the frontier. (B) Frontier analysis based upon CRDs ASDR and SDI in 2019. The solid black color was used to delineate the frontier, and dots were used to represent countries and territories. The top 15 countries with the largest effective difference were labeled in black; examples of frontier countries with low SDI (< 0.5) and low effective difference are labeled in blue (e.g., Somalia, Burkina, Ethiopia, Mozambique, Liberia), and examples of countries and territories with high SDI (>0.85) and relatively high effective difference were labeled in red (e.g., the USA, Ireland, the Netherlands, Denmark, the UAE). Red dots showed a decrease in CRDs ASDR; blue dots showed an increase in CRDs ASDR from 1990 to 2019.
Figure 4
Figure 4
Prominent contribution of RFs to CRDs-related deaths by SDI, sex, and age groups. (A) The ASMR attributable to main risk factors by SDI region (1990–2019). (B) Male-to-female ratios of ASMR attributable to RFs (1990–2019). (C) The percentage changes in mortality attributable to RFs by age group and SDI region (1990–2019). The black dot represents the overall value of change contributed by all RFs. RF, risk factor; CRDs, chronic respiratory diseases; ASMR, age-standardized mortality rate; SDI, sociodemographic index.

References

    1. Collaborators GCRD . Prevalence and attributable health burden of chronic respiratory diseases, 1990–2017: a systematic analysis for the Global Burden of Disease Study 2017. Lancet Respiratory Med. (2020) 8:585–96. 10.1016/S2213-2600(20)30105-3 - DOI - PMC - PubMed
    1. Mak I, Wan E, Wong T, Lee W, Chan E, Choi E, et al. . The spill-over impact of the novel coronavirus-19 pandemic on medical care and disease outcomes in non-communicable diseases: a narrative review. Public Health Rev. (2022) 43:1604121. 10.3389/phrs.2022.1604121 - DOI - PMC - PubMed
    1. The Lancet . GBD 2017: a fragile world. Lancet. (2018) 392:1683. 10.1016/S0140-6736(18)32858-7 - DOI - PubMed
    1. Partridge L, Deelen J, Slagboom PE. Facing up to the global challenges of ageing. Nature. (2018) 561:45–56. 10.1038/s41586-018-0457-8 - DOI - PubMed
    1. Li X, Cao X, Guo M, Xie M, Liu X. Trends and risk factors of mortality and disability adjusted life years for chronic respiratory diseases from 1990 to 2017: systematic analysis for the Global Burden of Disease Study 2017. BMJ. (2020) 368:m234. 10.1136/bmj.m234 - DOI - PMC - PubMed

Publication types

LinkOut - more resources