. 2023 Mar 5;19(5):1579-1596.
doi: 10.7150/ijbs.80125. eCollection 2023.

Tectorigenin targets PKACα to promote GLUT4 expression in skeletal muscle and improve insulin resistance in vitro and in vivo

Affiliations

Tectorigenin targets PKACα to promote GLUT4 expression in skeletal muscle and improve insulin resistance in vitro and in vivo

Xinlei Yao et al. Int J Biol Sci. .

Abstract

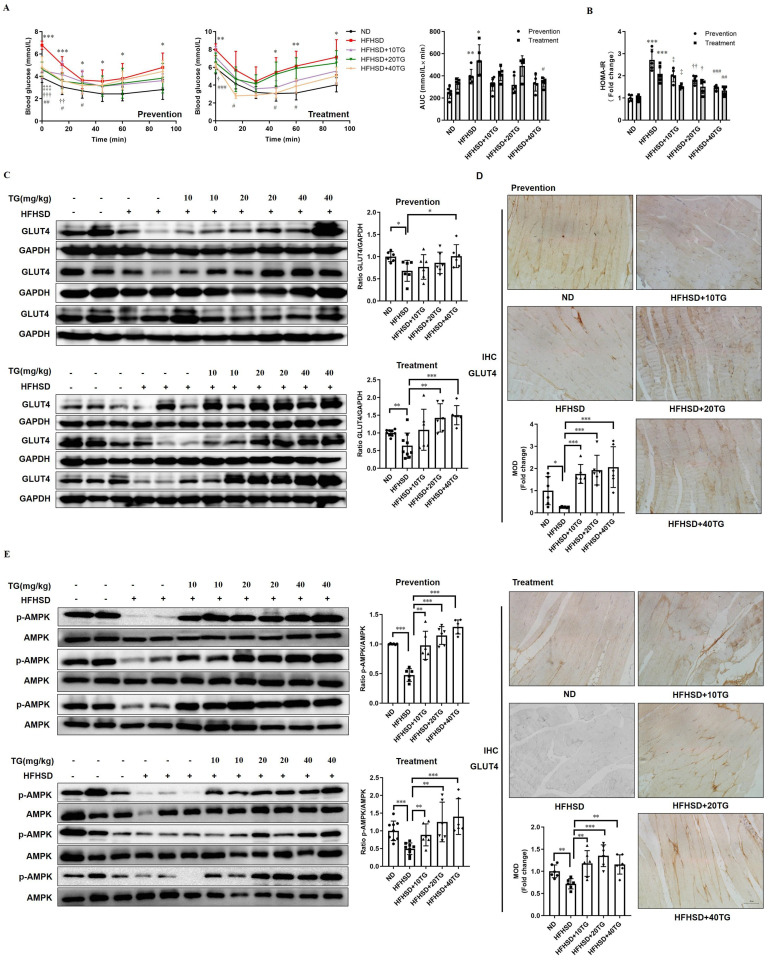
The decreased expression and dysfunction of glucose transporter 4 (GLUT4), the insulin-responsive glucose transporter, are closely related to the occurrence of insulin resistance (IR). To improve the expression of GLUT4 may represent a promising strategy to prevent and treat IR and type 2 diabetes (T2DM). Here, we demonstrate that the natural compound tectorigenin (TG) enhances GLUT4 expression, glucose uptake and insulin responsiveness via activating AMP-activated protein kinase (AMPK)/myocyte enhancer factor 2 (MEF2) signaling in both normal and IR skeletal muscle cells and tissues. Accordingly, prophylactic and therapeutic uses of TG can significantly ameliorate IR and hyperglycemia in T2DM mice. Mechanistically, we identify protein kinase A catalytic subunit α (PKACα) as the target of TG to increase GLUT4 expression and TG-PKACα binding promotes the dissociation of PKACα from the regulatory subunits, leading to the activation of PKA/AMPK signaling. PKACα knockdown in local quadriceps muscles almost completely abolished the therapeutic effects of TG on IR and T2DM, as well as the enhancement on AMPK signaling and GLUT4 expression in skeletal muscle. This study supports TG as a new drug candidate to treat IR and its related diseases, but also enriches our knowledge of PKA signaling in glucose metabolism in skeletal muscle.

Keywords: AMPK; GLUT4; PKACα; insulin resistance; tectorigenin.


Conflict of interest statement

Competing Interests: The authors have declared that no competing interest exists.

Figures

Figure 1
Figure 1
TG increases GLUT4 expression in C2C12 cells. (A) The chemical structure of TG. (B) Luciferase activity of PGL3-GLUT4-luc-transfected C2C12 cells treated with or without TG (10 μg/mL) for 24 h. Results are expressed as the fold-induction (over the activity of the control). (C) RT-qPCR analysis of mRNA levels of GLUT4 in C2C12 myotubes, untreated or treated with 10 μg/mL of TG for 24 h. (D) Western blot analysis of GLUT4 protein in C2C12 myotubes, untreated or treated with 10 μg/mL of TG for 24 h. ImageJ software was used for quantitative analysis. (E) Measurement of glucose uptake of C2C12 myotubes using 2-NBDG. C2C12 myotubes were pretreated with 400 μM PA for 24 h to induce IR before 10 μg/mL TG treatment for another 24 h. C2C12 myotubes were then incubated in KRPH buffer at 37 °C for 30 min, followed by incubation in KRPH buffer containing 2% BSA and 10 μM 2-NBDG with or without 100 nM insulin at 37 °C for 1 h. Results were determined based on 2-NBDG relative fluorescence intensity with respect to the normal control group. (F) Western blot analysis of the p-AKT and GLUT4 levels in normal- or PA-induced IR C2C12 myotubes treated with 10 μg/mL TG for 24 h. (G) Western blotting analysis of p-AKT and GLUT4 in PA-induced IR C2C12 myotubes stimulated with 100 nM insulin for 1 h with or without TG 24h-pretreatment. ImageJ was used for quantitative analysis. IR: insulin resistance; INS: insulin; PA: palmitic acid; TG: tectorigenin; ns: not significant; *, p < 0.05; **, p < 0.01; ***, p < 0.001; n ≥ 3.
Figure 2
Figure 2
TG increases GLUT4 expression by activating AMPK/MEF2 signaling. (A) Western blot analysis of p-AMPK and GLUT4 levels in C2C12 myotubes treated with 10 μg/mL TG, with or without 12.5 µM CC, for 30 min (for p-AMPK) or 24 h (for GLUT4), respectively. (B) C2C12 cells were transfected with AMPK siRNAs, followed by treatment with 10 µg/mL TG for 24 h. The indicated proteins were detected via Western blotting. ImageJ was used for quantification, as shown in the right-hand panels. (C) C2C12 cells were transfected with 3MEF2-luc luciferase reporter constructs before induction to differentiation. After 24 h of treatment of 10 µg/mL TG with or without 12.5 µM CC, C2C12 cells were harvested and subjected to the luciferase activity assay. Values shown represent the mean ± SEM. TG: tectorigenin; CC: compound C; ns: not significant; *, p < 0.05; **, p < 0.01; ***, p < 0.001; n = 3.
Figure 3
Figure 3
Prophylactic or therapeutic use of TG ameliorates insulin sensitivity and promotes the GLUT4 expression of muscle tissues in HFHSD-fed mice. For the prevention experiment, TG was administered every other day for 2 months via an intraperitoneal (i.p.) injection to HFHSD-fed mice starting 1 month after feeding. For the treatment experiment, TG was administered every other day for 1 month via an i.p. injection to mice with fasting blood glucose levels higher than 7mM/L after 4 months of HFHSD feeding. (A) IPITT was evaluated after 8 h fasting. Blood glucose levels of all groups at 0, 15, 30, 45, 60 and 90 min following insulin injection. The area under the curve (AUC) of the IPITT results was analyzed. (B) HOMA-IR of mice. (C) Western blot analysis of GLUT4 expression in muscle tissues from mice. ImageJ software was used for quantitative analysis. (D) Quantification and representative cases of IHC staining for GLUT4 in skeletal muscle in mice. The GLUT4 protein in mouse muscle sections was observed in brown dotted distribution. The mean optical density (MOD) was analyzed using Image-Pro Plus 5.0 software. Bar, 50 μm. (E) The levels of p-AMPK in skeletal muscle were examined via Western blotting. ImageJ software was used for quantitative analysis. ND: normal diet; HFHSD: high-fat and high-sucrose diet; 10TG: 10 mg/kg; TG; 20TG: 20 mg/kg TG; 40TG: 40 mg/kg TG. For Figures A and B: *, p < 0.05 ND versus HFHSD; **, p < 0.01 ND versus HFHSD; ***, p < 0.001 ND versus HFHSD; ‡, p < 0.05, 10TG versus HFHSD; ‡‡‡, p < 0.001, 10TG versus HFHSD; †, p < 0.05, 20TG versus HFHSD; ††, p < 0.01, 20TG versus HFHSD; †††, p < 0.001, 20TG versus HFHSD; #, p < 0.05, 40TG versus HFHSD; ##, p < 0.01, 40TG versus HFHSD; ###, p < 0.001, 40TG versus HFHSD. *, p < 0.05; **, p < 0.01; ***, p < 0.001; n ≥ 5.
Figure 4
Figure 4
The therapeutic use of TG ameliorates insulin sensitivity and promotes the GLUT4 expression of muscle tissues in STZ-induced T2DM mice. To establish STZ-induced diabetic mouse model, mice were fed a HFHSD for 1 month, and then were i.p. injected with STZ for 3 consecutive days at a dose of 30 mg/kg, while the normal control group was simultaneously injected with the same volume of vehicle solution. The diabetic mice were treated with TG or an identical volume of solvent via intragastric administration every two days for 1 months. (A) Fasting body weight of mice. (B) Fasting blood glucose levels. (C) Fasting blood insulin levels. (D) IPITT were evaluated after 8 h of fasting. Blood glucose levels of all groups at 0, 15, 30, 45, 60 and 90 min following insulin injection. The AUC was analyzed. (E) HOMA-IR of mice. (F) Glucose uptake assay of fresh ex vivo muscles treated with or without 100 nM insulin in vitro. (G) Western blotting analysis of GLUT4 expression in muscle tissues from each group of mice. ImageJ software was used for quantitative analysis. (H) Quantification and representative cases of IHC staining for GLUT4 in skeletal muscle from each group of mice. The MOD was analyzed using Image-Pro Plus 5.0 software. Bar, 50 μm. (I) Western blotting analysis of p-AMPK levels in muscle tissues from each group of mice. ImageJ software was used for quantitative analysis. HFHSD: High fat and high sucrose diet; 50TG: 50 mg/kg TG; 100TG: 100 mg/kg TG; 200TG: 200 mg/kg TG. For broken line graph, **, p < 0.01 normal versus STZ+HFHSD; ***, p < 0.001 normal versus STZ+HFHSD; ‡, p < 0.05, 50TG versus STZ+HFHSD; ‡‡, p < 0.01, 50TG versus STZ+HFHSD; ‡‡‡, p < 0.001, 50TG versus STZ+HFHSD; †, p < 0.05, 100TG versus STZ+HFHSD; ††, p < 0.01, 100TG versus STZ+HFHSD; †††, p < 0.001, 100TG versus STZ+HFHSD; #, p < 0.05, 200TG versus STZ+HFHSD; ##, p < 0.01, 200TG versus STZ+HFHSD; ###, p < 0.001, 200TG versus STZ+HFHSD. *, p < 0.05; **, p < 0.01; ***, p < 0.001; n ≥ 5.
Figure 5
Figure 5
PKACα is a potential target of TG. (A) Molecular docking results of the docking poses of TG (CID: 5281811) with the active site of PKACα (PDB: 5UZK). The middle stick model is the TG structure, which is surrounded by the active pocket of PKACα protein. The yellow dashed line is the hydrogen bond formed by TG and PKACα, which is connected to the PKACα-specific amino acid residue stick model. (B) The 2D docked conformation of molecular docking, with the hydrogen bonds represented by green dashed lines and the hydrophobic interaction by arcs using LigPlus. The middle structure is TG, which is surrounded by the amino acid residues that interact with TG. (C, D) Molecular dynamics analysis of the TG-PKACα complex. RMSD curve (C) and radius of gyrate (D). (E) Detection of the direct binding of TG to PKACα via capillary electrophoresis. The black wave line is resulted from the analysis of 0.1 mg/mL PKACα without TG. The red wave line is resulted from the analysis of 0.1 mg/mL PKACα with approximately 0.356 mg/mL TG. The peaks indicated by the blue arrows show that the migration time of the PKACα protein was obviously delayed when TG was added. The image on the top right is an enlarged image. (F) CO-IP analysis of the interaction between PKACα and PKAR in C2C12 cells with or without 10 μg/mL TG treatment.
Figure 6
Figure 6
PKACα is the target of TG, triggering GLUT4 expression and promoting glucose uptake in muscle cells via PKACα/AMPK/MEF2 signaling. (A) Western blot analysis of GLUT4 levels in C2C12 myotubes treated with 10 µg/mL TG for 24 h, and p-AMPK levels in C2C12 myotubes treated with 10 µg/mL of TG for 30 min, in the presence or absence of 20 µM H89. ImageJ was used for quantification. (B) Reporter assay of C2C12 cells transfected with 3MEF2-luc plasmids, followed by treatment with 10 µg/mL of TG with or without 20 µM H89 for 24 h. (C) Western blot analysis of PKACα in lentivirus-mediated stable PKACα knockdown or control C2C12 myotubes. (D, E) The glucose uptake of stable PKACα-knockdown or control C2C12 myotubes under normal (D) or IR (E) conditions. The C2C12 myotubes were processed in accordance with Figure 1E. (F) Western blot analysis of indicated proteins in the stable PKACα-knockdown or control C2C12 myotubes under insulin stimulation or not. TG: tectorigenin; shNC: C2C12 myotubes with control shRNA; shPKACα: C2C12 myotubes with PKACα knockdown; INS: insulin; IR: insulin resistance; ns: not significant; *, p < 0.05; **, p < 0.01; ***, p < 0.001; n ≥ 3.
Figure 7
Figure 7
Therapeutic use of TG ameliorates insulin sensitivity and promotes the GLUT4 expression of muscle tissues in T2DM mice. HFHSD-induced type 2 diabetic mice were multi-point intramuscularly injected into the quadriceps of the two hind legs with lentivirus-carrying shRNA targeting PKACα (Lv-shPKACα) or control shRNA (Lv-shNC) and then these mice received treatment of 40 mg/kg TG via an i.p. injection every two days for one month. (A) Body weight changes over time. *, p < 0.05, Lv-shNC versus Lv-shNC+40 mg/kg TG. (B) Fasting blood glucose levels. (C) Fasting blood insulin levels. (D) HOMA-IR of mice. (E) IPITT were evaluated after 8 h fasting. Blood glucose levels of all groups at 0, 15, 30, 45, 60 and 90 min following insulin injection. The AUC of IPITT was analyzed. *, p < 0.05, Lv-shNC versus Lv-shNC+40 mg/kg TG; **, p < 0.01, Lv-shNC versus Lv-shNC+40 mg/kg TG; ***, p < 0.001, Lv-shNC versus Lv-shNC+40 mg/kg TG; #, p < 0.05, Lv-shNC versus Lv-shPKACα; ##, p < 0.01, Lv-shNC versus Lv-shPKACα. (F) Glucose uptake of Lv-shNC- or Lv-shPKACα-injected quadriceps from each group of mice. (G) Western blot analysis of PKACα, p-AMPK and GLUT4 levels in Lv-shNC- or Lv-shPKACα-injected quadriceps from each group of mice. ImageJ software was used for quantitative analysis. (H) Representative IHC staining for PKACα and GLUT4 of Lv-shNC- or Lv-shPKACα-injected quadriceps from each group of mice. Notably, the most right-handed slide for PKACα or GLUT4 staining respectively include a strip of muscle (the field above the dotted line) which remained a normal level of PKACα (top) indicating without Lv-shPKACα infection in this strip of muscle, while the field below the dotted line showed a low level of PKACα as expected. (I) IHC quantification and the MOD was analyzed using Image-Pro Plus 5.0 software. Bar, 50 μm. ns: not significant. *, p < 0.05; **, p < 0.01; ***, p < 0.001; n = 3.

References

    1. Zheng Y, Ley SH, Hu FB. Global aetiology and epidemiology of type 2 diabetes mellitus and its complications. Nature reviews Endocrinology. 2018;14:88–98. - PubMed
    1. Abdul-Ghani MA, DeFronzo RA. Pathogenesis of insulin resistance in skeletal muscle. Journal of biomedicine & biotechnology. 2010;2010:476279. - PMC - PubMed
    1. Cheatham B. GLUT4 and company: SNAREing roles in insulin-regulated glucose uptake. Trends in endocrinology and metabolism: TEM. 2000;11:356–61. - PubMed
    1. Alam F, Islam MA, Khalil MI, Gan SH. Metabolic Control of Type 2 Diabetes by Targeting the GLUT4 Glucose Transporter: Intervention Approaches. Current pharmaceutical design. 2016;22:3034–49. - PubMed
    1. Zanquetta MM, Alves-Wagner AB, Mori RC, Campello RS, Machado UF. Recovery of insulin sensitivity and Slc2a4 mRNA expression depend on T3 hormone during refeeding. Metabolism: clinical and experimental. 2014;63:328–34. - PubMed

Publication types

MeSH terms