

Inhibition of STAT3 signaling as critical molecular event in HUC-MSCs suppressed Glioblastoma Cells
- PMID: 37057281
- PMCID: PMC10088538
- DOI: 10.7150/jca.77905
Inhibition of STAT3 signaling as critical molecular event in HUC-MSCs suppressed Glioblastoma Cells
Erratum in
-
Erratum: Inhibition of STAT3 signaling as critical molecular event in HUC-MSCs suppressed Glioblastoma Cells: Erratum.J Cancer. 2024 Nov 2;15(20):6808-6810. doi: 10.7150/jca.105504. eCollection 2024. J Cancer. 2024. PMID: 39668815 Free PMC article.
Abstract
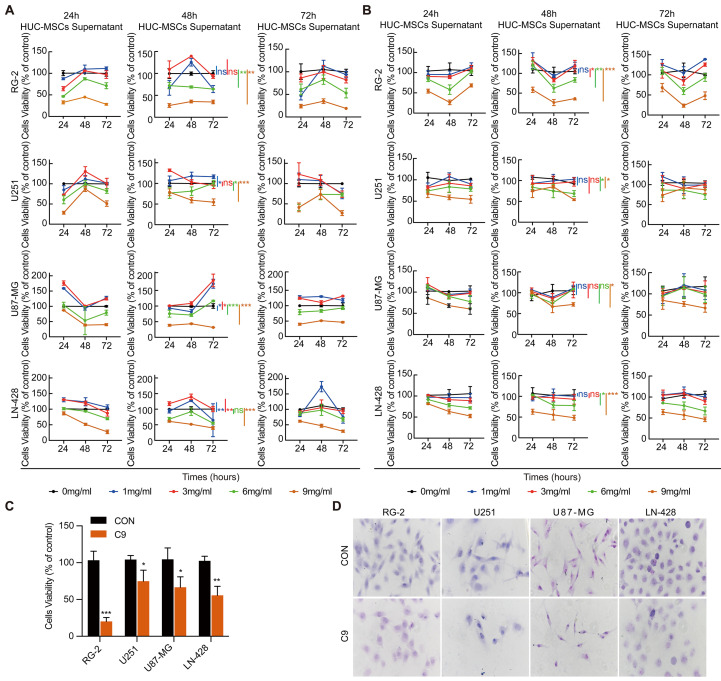
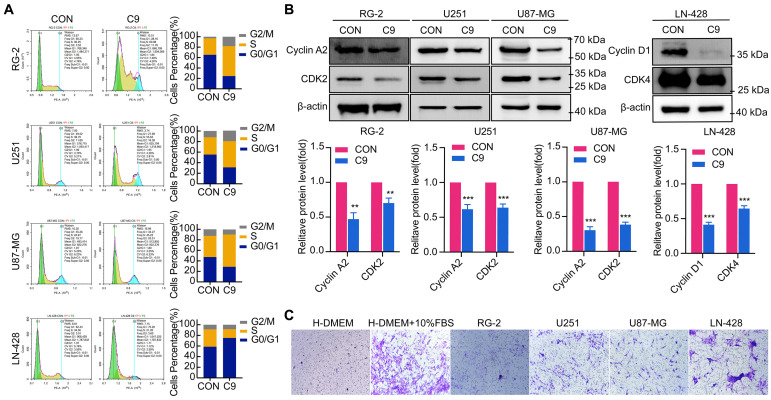
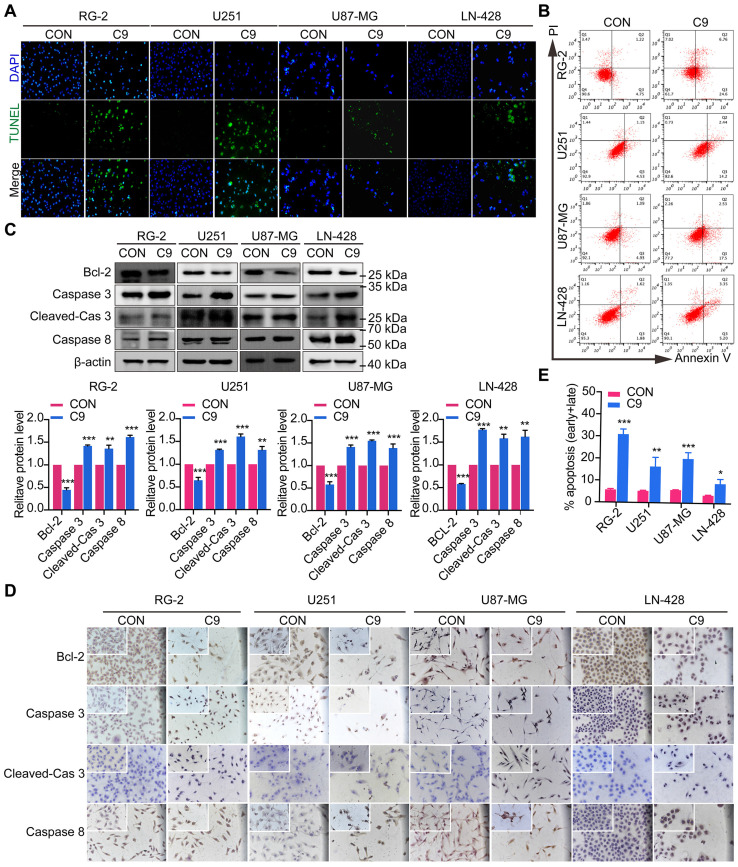
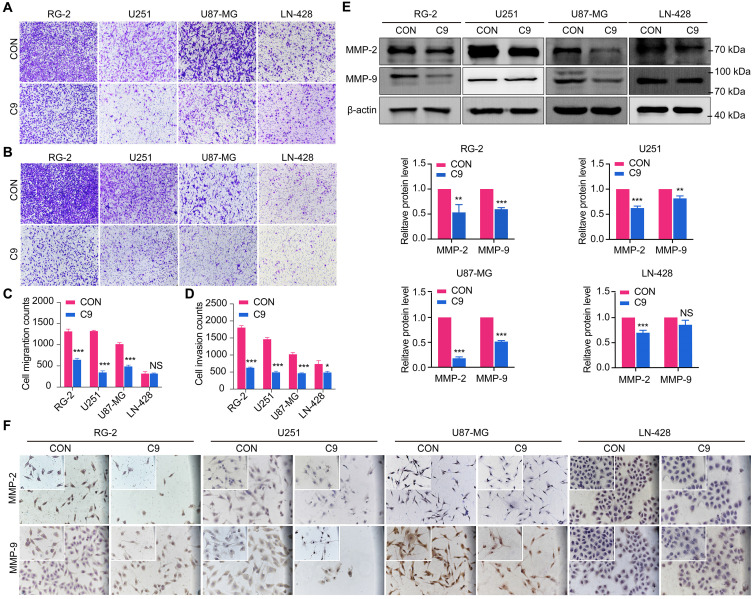
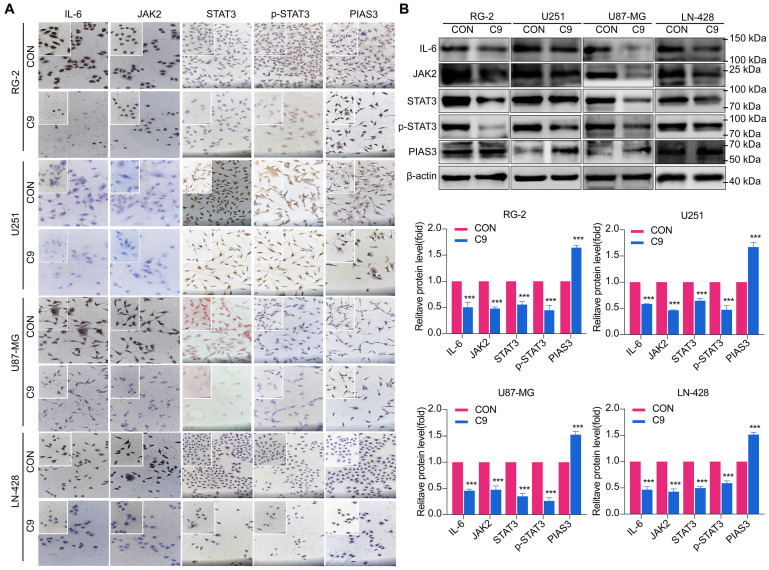
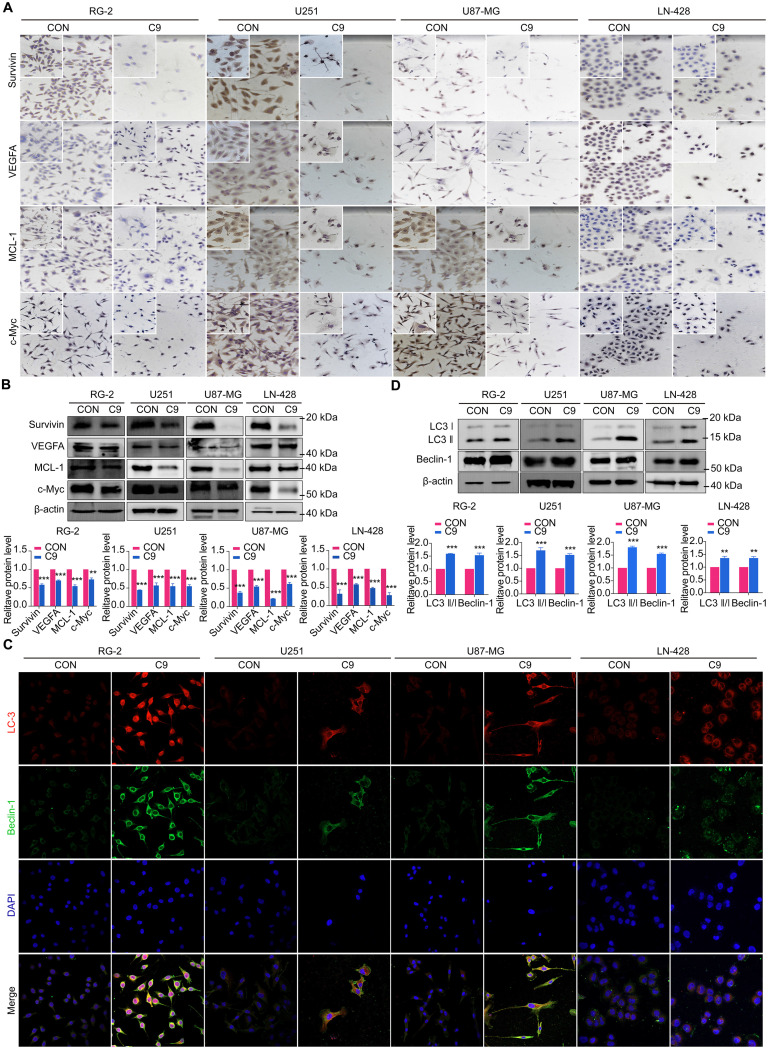
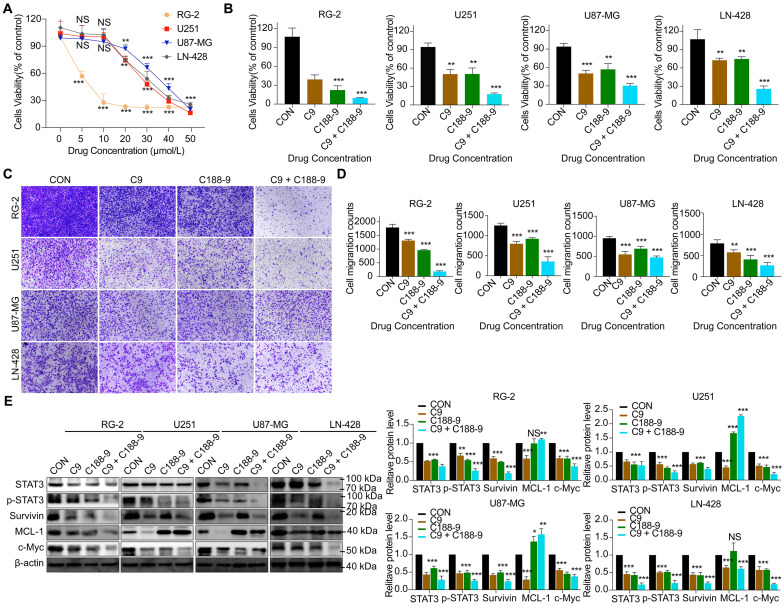
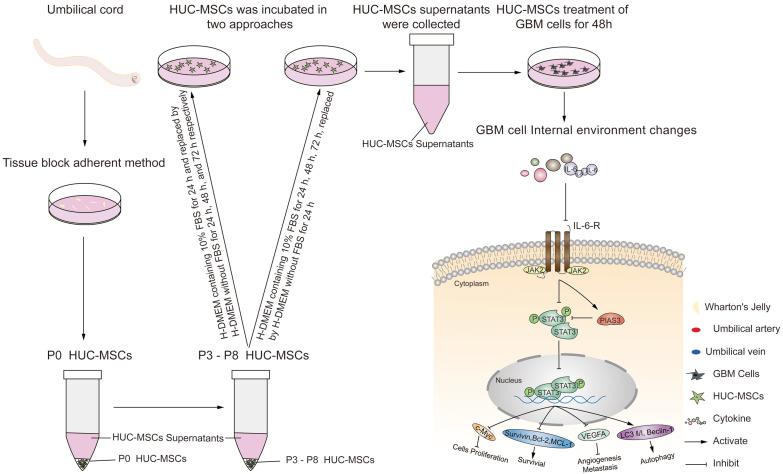
Objective: We investigated the effect of human umbilical cord mesenchymal stem cells (HUC-MSCs) supernatants on proliferation, migration, invasion, and apoptosis in glioblastoma (GBM) cell lines RG-2, U251, U87-MG, and LN-428, as well as their apoptosis and autophagy-mediated through IL-6/JAK2/STAT3 signaling pathway to explore the molecular mechanisms. Methods: In this study, RG-2, U251, U87-MG, and LN-428 cells were treated with 9 mg/ml HUC-MSCs supernatants. Their responses to HUC-MSCs supernatants treatment and the status of STAT3 signaling were analyzed by multiple experimental approaches to elucidate the importance of HUC-MSCs supernatants for GBM. Results: The results demonstrated that after treatment with HUC-MSCs supernatants, in vitro proliferation of RG-2, U251, U87-MG, and LN-428 cells were inhibited, and their sustained growth was also blocked. RG-2, U251, and U87-MG cells showed significant S phase accumulation, while LN-428 cells were blocked in G0/G1 phase. Their migratory invasive capacities were inhibited, and their apoptosis and autophagy ratios were increased. These effects were mediated through the IL-6/JAK2/STAT3 and its downstream signaling pathway. Conclusion: Our data showed that HUC-MSCs supernatants had anti-tumor effects on GBM cells. It inhibited the proliferation, migration, and invasion of GBM cells and promoted their apoptosis. Negative regulation of the IL-6/JAK2/STAT3 signaling pathway enhanced apoptosis and autophagy in tumor cells, thereby improving the therapeutic effect on GBM.
Keywords: IL-6/JAK2/STAT3 signaling pathway; glioblastoma; human umbilical cord mesenchymal stem cell supernatant.
© The author(s).
Conflict of interest statement
Competing Interests: The authors have declared that no competing interest exists.
Figures
Similar articles
-
Human umbilical cord-derived mesenchymal stem cells improve the function of liver in rats with acute-on-chronic liver failure via downregulating Notch and Stat1/Stat3 signaling.Stem Cell Res Ther. 2021 Jul 13;12(1):396. doi: 10.1186/s13287-021-02468-6. Stem Cell Res Ther. 2021. PMID: 34256837 Free PMC article.
-
Dimethyloxallyl Glycine Preconditioning Promotes the Anti-inflammatory and Anti-fibrotic Effects of Human Umbilical Cord Mesenchymal Stem Cells on Kidney Damage in Systemic Lupus Erythematosus Related to TGF-β/Smad Signaling Pathway.Inflammation. 2025 Apr;48(2):839-854. doi: 10.1007/s10753-024-02092-5. Epub 2024 Jul 24. Inflammation. 2025. PMID: 39044003
-
Human umbilical cord-derived mesenchymal stem cells (hUC-MSCs) alleviate excessive autophagy of ovarian granular cells through VEGFA/PI3K/AKT/mTOR pathway in premature ovarian failure rat model.J Ovarian Res. 2023 Sep 30;16(1):198. doi: 10.1186/s13048-023-01278-z. J Ovarian Res. 2023. PMID: 37777781 Free PMC article.
-
Human Umbilical Cord Mesenchymal Stem Cells Alleviate Rat Knee Osteoarthritis via Activating Wnt/ β-catenin Signaling Pathway.Curr Stem Cell Res Ther. 2024;19(2):234-244. doi: 10.2174/1574888X18666230428094400. Curr Stem Cell Res Ther. 2024. PMID: 37132309
-
What is the impact of human umbilical cord mesenchymal stem cell transplantation on clinical treatment?Stem Cell Res Ther. 2020 Dec 1;11(1):519. doi: 10.1186/s13287-020-02011-z. Stem Cell Res Ther. 2020. PMID: 33261658 Free PMC article. Review.
Cited by
-
Mesenchymal stem/stromal cells- a principal element for tumour microenvironment heterogeneity.Front Immunol. 2023 Oct 9;14:1274379. doi: 10.3389/fimmu.2023.1274379. eCollection 2023. Front Immunol. 2023. PMID: 37885883 Free PMC article. Review.
-
Chinese medicine monomers for hepatocellular carcinoma: New ideas related to autophagy.World J Gastroenterol. 2025 Jul 14;31(26):106113. doi: 10.3748/wjg.v31.i26.106113. World J Gastroenterol. 2025. PMID: 40678709 Free PMC article. Review.
-
Synergistic Effect of Conditioned Medium from Amniotic Membrane Mesenchymal Stromal Cells Combined with Paclitaxel on Ovarian Cancer Cell Viability and Migration in 2D and 3D In Vitro Models.Pharmaceutics. 2025 Mar 26;17(4):420. doi: 10.3390/pharmaceutics17040420. Pharmaceutics. 2025. PMID: 40284415 Free PMC article.
-
The Human Placental Amniotic Membrane Mesenchymal-Stromal-Cell-Derived Conditioned Medium Inhibits Growth and Promotes Apoptosis of Human Cholangiocarcinoma Cells In Vitro and In Vivo by Suppressing IL-6/JAK2/STAT3 Signaling.Cells. 2023 Dec 7;12(24):2788. doi: 10.3390/cells12242788. Cells. 2023. PMID: 38132108 Free PMC article.
-
Unlocking the Therapeutic Potential: Harnessing miR-125a-5p To Enhance Autophagy and Apoptosis in Pancreatic Cancer through Targeting STAT3.J Cancer. 2024 Jul 16;15(15):4955-4968. doi: 10.7150/jca.97102. eCollection 2024. J Cancer. 2024. PMID: 39132168 Free PMC article.
References
LinkOut - more resources
Full Text Sources
Miscellaneous
