

High-expression of Galactosidase alpha is correlated with poor prognosis and immune infiltration in low-grade glioma
- PMID: 37057282
- PMCID: PMC10088540
- DOI: 10.7150/jca.81975
High-expression of Galactosidase alpha is correlated with poor prognosis and immune infiltration in low-grade glioma
Abstract
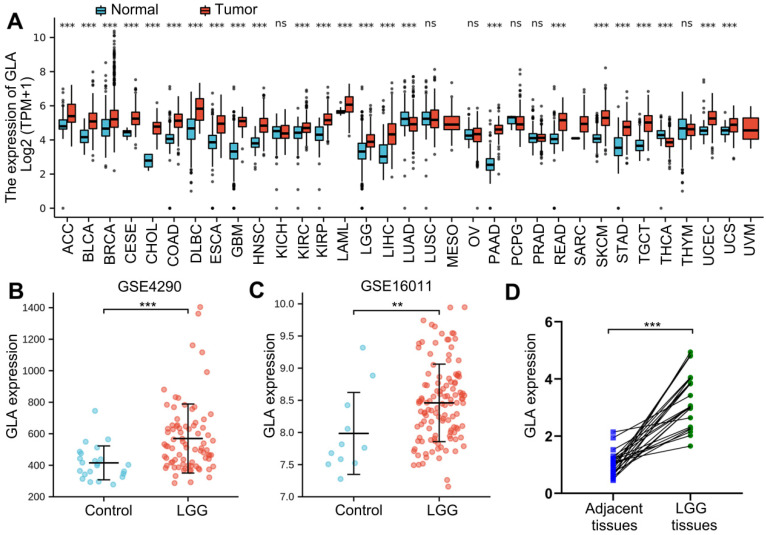
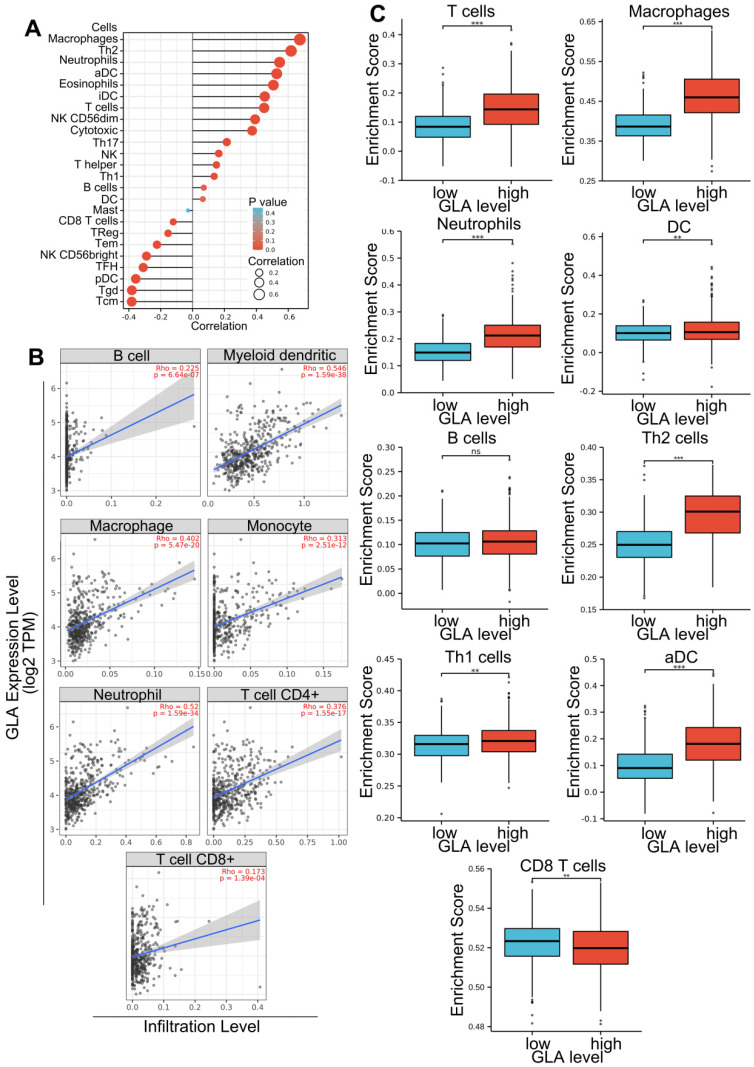
Background: Galactosidase alpha (GLA), a member of galactosidase (GAL) family, contributes to cancer diagnosis and targeted therapy. Up to now, neither prognosis nor immune infiltration has been demonstrated in cases with low-grade glioma (LGG). In LGG, we investigated the association between GLA expression and immune infiltration levels. Methods: GLA expression levels in pan-cancer were evaluated utilizing the Oncomine database. In addition, GLA level was screened via analyzing the gene expression omnibus (GEO) data and the Cancer Genome Atlas (TCGA) data, and evaluated in LGG tissues and adjacent tissues by using qPCR. TIMER database was utilized for evaluating the correlation between GLA level and LGG immune infiltrates. A correlation was found between GLA levels and LGG immune infiltrates utilizing the TIMER database. Moreover, we then assessed the TIMER data to explore clinical outcome in multiple immune cells and the correction between GLA expression and immune markers. Results: The mRNA levels of GLA were upregulated in LGG tissues. GLA expression was associated with a poor outcome of patients with LGG. Additionally, the infiltration levels of several immune cells were obviously enriched in LGG with a higher GLA level. Moreover, LGG prognosis was worsened with high GLA levels in immune cells. Conclusions: These results suggested that GLA levels in LGG might be more predictive of immune infiltration, with potential value for assessment of tumor development.
Keywords: Galactosidase alpha; Immune infiltration; Low-grade glioma; Prognosis.
© The author(s).
Conflict of interest statement
Competing Interests: The authors have declared that no competing interest exists.
Figures


References
-
- Reni M, Mazza E, Zanon S, Gatta G, Vecht CJ. Central nervous system gliomas. Crit Rev Oncol Hematol. 2017;113:213–34. - PubMed
-
- Cahill D, Turcan S. Origin of Gliomas. Semin Neurol. 2018;38:5–10. - PubMed
-
- Hu M, Yu B, Zhang B, Wang B, Qian D, Li H. et al. Human Cytomegalovirus Infection Activates Glioma Activating Transcription Factor 5 via microRNA in a Stress-Induced Manner. ACS Chem Neurosci. 2021;12:3947–56. - PubMed
-
- Hu M, Li H, Xie H, Fan M, Wang J, Zhang N. et al. ELF1 Transcription Factor Enhances the Progression of Glioma via ATF5 promoter. ACS Chem Neurosci. 2021;12:1252–61. - PubMed
LinkOut - more resources
Full Text Sources
