. 2023 Jul 5;83(13):2248-2261.
doi: 10.1158/0008-5472.CAN-22-3450.

Caffeine Supplementation and FOXM1 Inhibition Enhance the Antitumor Effect of Statins in Neuroblastoma

Affiliations

Caffeine Supplementation and FOXM1 Inhibition Enhance the Antitumor Effect of Statins in Neuroblastoma

Gia-Buu Tran et al. Cancer Res. .

Abstract

High-risk neuroblastoma exhibits transcriptional activation of the mevalonate pathway that produces cholesterol and nonsterol isoprenoids. A better understanding of how this metabolic reprogramming contributes to neuroblastoma development could help identify potential prevention and treatment strategies. Here, we report that both the cholesterol and nonsterol geranylgeranyl-pyrophosphate branches of the mevalonate pathway are critical to sustain neuroblastoma cell growth. Blocking the mevalonate pathway by simvastatin, a cholesterol-lowering drug, impeded neuroblastoma growth in neuroblastoma cell line xenograft, patient-derived xenograft (PDX), and TH-MYCN transgenic mouse models. Transcriptional profiling revealed that the mevalonate pathway was required to maintain the FOXM1-mediated transcriptional program that drives mitosis. High FOXM1 expression contributed to statin resistance and led to a therapeutic vulnerability to the combination of simvastatin and FOXM1 inhibition. Furthermore, caffeine synergized with simvastatin to inhibit the growth of neuroblastoma cells and PDX tumors by blocking statin-induced feedback activation of the mevalonate pathway. This function of caffeine depended on its activity as an adenosine receptor antagonist, and the A2A adenosine receptor antagonist istradefylline, an add-on drug for Parkinson's disease, could recapitulate the synergistic effect of caffeine with simvastatin. This study reveals that the FOXM1-mediated mitotic program is a molecular statin target in cancer and identifies classes of agents for maximizing the therapeutic efficacy of statins, with implications for treatment of high-risk neuroblastoma.

Significance: Caffeine treatment and FOXM1 inhibition can both enhance the antitumor effect of statins by blocking the molecular and metabolic processes that confer statin resistance, indicating potential combination therapeutic strategies for neuroblastoma. See related commentary by Stouth et al., p. 2091.


Figures

Figure 1. The mevalonate pathway is a therapeutic target in neuroblastoma. A, The mevalonate pathway with indicated key enzymes and their inhibitors. B, Kaplan–Meier survival curves for TH-MYCN mice treated with vehicle or simvastatin at 40 mg/kg by gavage every other day for 90 days (45 doses). Log-rank test P value is indicated. Treatment was started on postnatal day 31 and ended on day 120. C, Representative images of IHC staining of cleaved caspase-3 in tumors from TH-MYCN mice treated with vehicle or simvastatin. D, Violin plot of apoptosis levels quantified as areas of cleaved caspase-3–positive staining in 8 to 13 IHC images (200×) from tumors treated with vehicle (n = 3) or simvastatin (n = 2). P values were determined by one-way ANOVA. ****, P < 0.0001.
Figure 1.
The mevalonate pathway is a therapeutic target in neuroblastoma. A, The mevalonate pathway with indicated key enzymes and their inhibitors. B, Kaplan–Meier survival curves for TH-MYCN mice treated with vehicle or simvastatin at 40 mg/kg by gavage every other day for 90 days (45 doses). Log-rank test P value is indicated. Treatment was started on postnatal day 31 and ended on day 120. C, Representative images of IHC staining of cleaved caspase-3 in tumors from TH-MYCN mice treated with vehicle or simvastatin. D, Violin plot of apoptosis levels quantified as areas of cleaved caspase-3–positive staining in 8 to 13 IHC images (200×) from tumors treated with vehicle (n = 3) or simvastatin (n = 2). P values were determined by one-way ANOVA. ****, P < 0.0001.
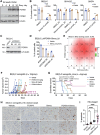
Figure 2. FOXM1 regulates the sensitivity of neuroblastoma cells to simvastatin. A, Immunoblot analysis of FOXM1 and its target cyclin B1 (CCNB1) in SK-N-DZ cells with inducible FOXM1 expression in the absence of doxycycline (Doxy-). β-actin levels are shown as loading control. B, Cell growth assays of neuroblastoma cell lines without or with FOXM1 induction that were treated with DMSO or simvastatin. FOXM1 induction conferred resistance to simvastatin. P values were determined by two-tailed Student t test. C, Immunoblot analysis of shRNA-mediated FOXM1 knockdown in BE(2)-C cells. α-Tubulin levels are shown as loading control. D, Cell growth assays of BE (2)-C cells without (shGFP) or with FOXM1 knockdown (shFOXM1) that were treated with DMSO or simvastatin. Synergistic effect determined by the Bliss reference model. E, Two-dimensional synergy plot showing additive or synergistic interaction between simvastatin and thiostrepton (FOXM1i), with indicated Bliss synergy scores: <10, additive effect; >10, synergistic effect. F and G, Tumor growth (F) and event-free survival (G) curves for NOD/SCID mice bearing BE (2)-C xenografts treated with vehicle, FOXM1i, simvastatin, or combination of simvastatin and FOXM1i. Treatment was started on the day of inoculation and ended on day 50 post-inoculation. Log-rank test P values are indicated for individual or combination of the drugs versus vehicle and drug combination versus FOXM1i. H, Representative images of IHC staining of cleaved caspase-3 from two xenografts treated with vehicle, FOXM1i, simvastatin, or combination of FOXM1i and simvastatin. I, Violin plot of apoptosis levels quantified as areas of cleaved caspase-3–positive staining in 8–10 IHC images (200×) from 2–3 xenografts per group. P values were determined by one-way ANOVA. *, P < 0.05; ***, P < 0.001; ****, P < 0.0001.
Figure 2.
FOXM1 regulates the sensitivity of neuroblastoma cells to simvastatin. A, Immunoblot analysis of FOXM1 and its target cyclin B1 (CCNB1) in SK-N-DZ cells with inducible FOXM1 expression in the absence of doxycycline (Doxy-). β-actin levels are shown as loading control. B, Cell growth assays of neuroblastoma cell lines without or with FOXM1 induction that were treated with DMSO or simvastatin. FOXM1 induction conferred resistance to simvastatin. P values were determined by two-tailed Student t test. C, Immunoblot analysis of shRNA-mediated FOXM1 knockdown in BE(2)-C cells. α-Tubulin levels are shown as loading control. D, Cell growth assays of BE (2)-C cells without (shGFP) or with FOXM1 knockdown (shFOXM1) that were treated with DMSO or simvastatin. Synergistic effect determined by the Bliss reference model. E, Two-dimensional synergy plot showing additive or synergistic interaction between simvastatin and thiostrepton (FOXM1i), with indicated Bliss synergy scores: <10, additive effect; >10, synergistic effect. F and G, Tumor growth (F) and event-free survival (G) curves for NOD/SCID mice bearing BE (2)-C xenografts treated with vehicle, FOXM1i, simvastatin, or combination of simvastatin and FOXM1i. Treatment was started on the day of inoculation and ended on day 50 post-inoculation. Log-rank test P values are indicated for individual or combination of the drugs versus vehicle and drug combination versus FOXM1i. H, Representative images of IHC staining of cleaved caspase-3 from two xenografts treated with vehicle, FOXM1i, simvastatin, or combination of FOXM1i and simvastatin. I, Violin plot of apoptosis levels quantified as areas of cleaved caspase-3–positive staining in 8–10 IHC images (200×) from 2–3 xenografts per group. P values were determined by one-way ANOVA. *, P < 0.05; ***, P < 0.001; ****, P < 0.0001.
Figure 3. Caffeine synergizes with simvastatin by blocking feedback activation of the mevalonate pathway. A, Immunoblot analysis of simvastatin-induced Srebp2 processing in CHO-K1 cells, which was blocked by caffeine (CAF). Srebp2-FL, full-length Srebp2 precursor; Srebp2-N, N-terminal Srebp2 with transcriptional activity. B and C, qRT-PCR (B) and immunoblot (C) analyses showing abrogation by caffeine of simvastatin-mediated upregulation of mevalonate pathway enzymes. Statistical significance was determined by two-tailed Student t test. D and E, Cell growth assays of PDX neuroblastoma cells (D) and MYCN-amplified neuroblastoma cell lines (E) treated with DMSO, caffeine, simvastatin, or combination of simvastatin and caffeine. Synergistic effect determined by the Bliss reference model. F and G, Two-dimensional synergy plots showing synergistic interaction between simvastatin and caffeine, with indicated Bliss (F) and HSA (G) synergy scores: > 10, synergistic. *, P < 0.05; **, P < 0.01; ***, P < 0.001.
Figure 3.
Caffeine synergizes with simvastatin by blocking feedback activation of the mevalonate pathway. A, Immunoblot analysis of simvastatin-induced Srebp2 processing in CHO-K1 cells, which was blocked by caffeine (CAF). Srebp2-FL, full-length Srebp2 precursor; Srebp2-N, N-terminal Srebp2 with transcriptional activity. B and C, qRT-PCR (B) and immunoblot (C) analyses showing abrogation by caffeine of simvastatin-mediated upregulation of mevalonate pathway enzymes. Statistical significance was determined by two-tailed Student t test. D and E, Cell growth assays of PDX neuroblastoma cells (D) and MYCN-amplified neuroblastoma cell lines (E) treated with DMSO, caffeine, simvastatin, or combination of simvastatin and caffeine. Synergistic effect determined by the Bliss reference model. F and G, Two-dimensional synergy plots showing synergistic interaction between simvastatin and caffeine, with indicated Bliss (F) and HSA (G) synergy scores: > 10, synergistic. *, P < 0.05; **, P < 0.01; ***, P < 0.001.
Figure 4. Caffeine synergizes with simvastatin to inhibit PDX growth. A and B, Tumor growth (A) and event-free survival (B) curves for NOD/SCID mice bearing COG-N-519x PDX treated with vehicle, caffeinated water (0.4 g/L), simvastatin, or caffeinated water (0.2 g/L or 0.4 g/L) in combination with simvastatin. Treatment was started on the day of inoculation and ended on day 38 postinoculation. Log-rank test P values are indicated for simvastatin vs. vehicle and caffeinated water (0.4 g/L) plus simvastatin vs. simvastatin. C, Representative images of IHC staining of cleaved caspase-3 from two PDXs treated with vehicle, caffeinated water (0.4 g/L), simvastatin, or caffeinated water (0.4 g/L) in combination with simvastatin. D, Violin plot of apoptosis levels quantified as areas of cleaved caspase-3–positive staining in 8–10 IHC images (200×) from 2–3 xenografts per group. P values were determined by one-way ANOVA. ns, nonsignificant; *, P < 0.05: ****, P < 0.0001. CAF, caffeine.
Figure 4.
Caffeine synergizes with simvastatin to inhibit PDX growth. A and B, Tumor growth (A) and event-free survival (B) curves for NOD/SCID mice bearing COG-N-519x PDX treated with vehicle, caffeinated water (0.4 g/L), simvastatin, or caffeinated water (0.2 g/L or 0.4 g/L) in combination with simvastatin. Treatment was started on the day of inoculation and ended on day 38 postinoculation. Log-rank test P values are indicated for simvastatin vs. vehicle and caffeinated water (0.4 g/L) plus simvastatin vs. simvastatin. C, Representative images of IHC staining of cleaved caspase-3 from two PDXs treated with vehicle, caffeinated water (0.4 g/L), simvastatin, or caffeinated water (0.4 g/L) in combination with simvastatin. D, Violin plot of apoptosis levels quantified as areas of cleaved caspase-3–positive staining in 8–10 IHC images (200×) from 2–3 xenografts per group. P values were determined by one-way ANOVA. ns, nonsignificant; *, P < 0.05: ****, P < 0.0001. CAF, caffeine.
Figure 5. Caffeine acts as an adenosine receptor antagonist to augment the effect of simvastatin. A and B, Supplemental adenosine (Ado), but not other compounds, abolishes the ability of caffeine to block simvastatin-induced mevalonate pathway enzymes (A) and to sensitize cells to simvastatin (B). Bac, Baclofen; TG, thapsigargin. P values were determined by two-tailed Student t test. C and D, Immunoblot analysis shows abrogation of simvastatin-induced Srebp2 processing in CHO-K1 cells (C) and upregulation of mevalonate pathway enzymes in IMR5 cells (D) by the adenosine receptor antagonist KW6002. E, Cell growth assays of neuroblastoma cell lines treated for 48 hours with DMSO, KW6002, caffeine, simvastatin, or simvastatin plus KW6002 or caffeine. Synergistic effect determined by the Bliss reference model. F, Two-dimensional synergy plots showing synergistic interaction between simvastatin and KW6002 in MYCN-amplified neuroblastoma cell lines, with indicated Bliss synergy scores: > 10, synergistic. G, Representative fluorescence images of neuroblastoma cells expressing the FRET-based ER Ca2+ sensor D1ER following treatment with vehicle (Ctrl), 0.2 mmol/L caffeine, or 5 μmol/L KW6002 for 24 hours. H, Violin plots of fluorescent intensity quantified from 5 to 15 fluorescent microscope images (200×) of at least three biological replicates. P values were determined by one-way ANOVA. *, P < 0.05; ***, P < 0.001; ****, P < 0.0001. CAF, caffeine.
Figure 5.
Caffeine acts as an adenosine receptor antagonist to augment the effect of simvastatin. A and B, Supplemental adenosine (Ado), but not other compounds, abolishes the ability of caffeine to block simvastatin-induced mevalonate pathway enzymes (A) and to sensitize cells to simvastatin (B). Bac, Baclofen; TG, thapsigargin. P values were determined by two-tailed Student t test. C and D, Immunoblot analysis shows abrogation of simvastatin-induced Srebp2 processing in CHO-K1 cells (C) and upregulation of mevalonate pathway enzymes in IMR5 cells (D) by the adenosine receptor antagonist KW6002. E, Cell growth assays of neuroblastoma cell lines treated for 48 hours with DMSO, KW6002, caffeine, simvastatin, or simvastatin plus KW6002 or caffeine. Synergistic effect determined by the Bliss reference model. F, Two-dimensional synergy plots showing synergistic interaction between simvastatin and KW6002 in MYCN-amplified neuroblastoma cell lines, with indicated Bliss synergy scores: > 10, synergistic. G, Representative fluorescence images of neuroblastoma cells expressing the FRET-based ER Ca2+ sensor D1ER following treatment with vehicle (Ctrl), 0.2 mmol/L caffeine, or 5 μmol/L KW6002 for 24 hours. H, Violin plots of fluorescent intensity quantified from 5 to 15 fluorescent microscope images (200×) of at least three biological replicates. P values were determined by one-way ANOVA. *, P < 0.05; ***, P < 0.001; ****, P < 0.0001. CAF, caffeine.

Comment in

References

    1. Goldstein JL, Brown MS. Regulation of the mevalonate pathway. Nature 1990;343:425–30. - PubMed
    1. Mullen PJ, Yu R, Longo J, Archer MC, Penn LZ. The interplay between cell signaling and the mevalonate pathway in cancer. Nat Rev Cancer 2016;16:718–31. - PubMed
    1. van Meer G, Voelker DR, Feigenson GW. Membrane lipids: where they are and how they behave. Nat Rev Mol Cell Biol 2008;9:112–24. - PMC - PubMed
    1. Longo J, van Leeuwen JE, Elbaz M, Branchard E, Penn LZ. Statins as anticancer agents in the era of precision medicine. Clin Cancer Res 2020;26:5791–800. - PubMed
    1. Juarez D, Fruman DA. Targeting the mevalonate pathway in cancer. Trends Cancer 2021;7:525–40. - PMC - PubMed

Publication types