. 2023 Jun 29:12:e85492.
doi: 10.7554/eLife.85492.

On the limits of fitting complex models of population history to f-statistics

Affiliations

On the limits of fitting complex models of population history to f-statistics

Robert Maier et al. Elife. .

Abstract

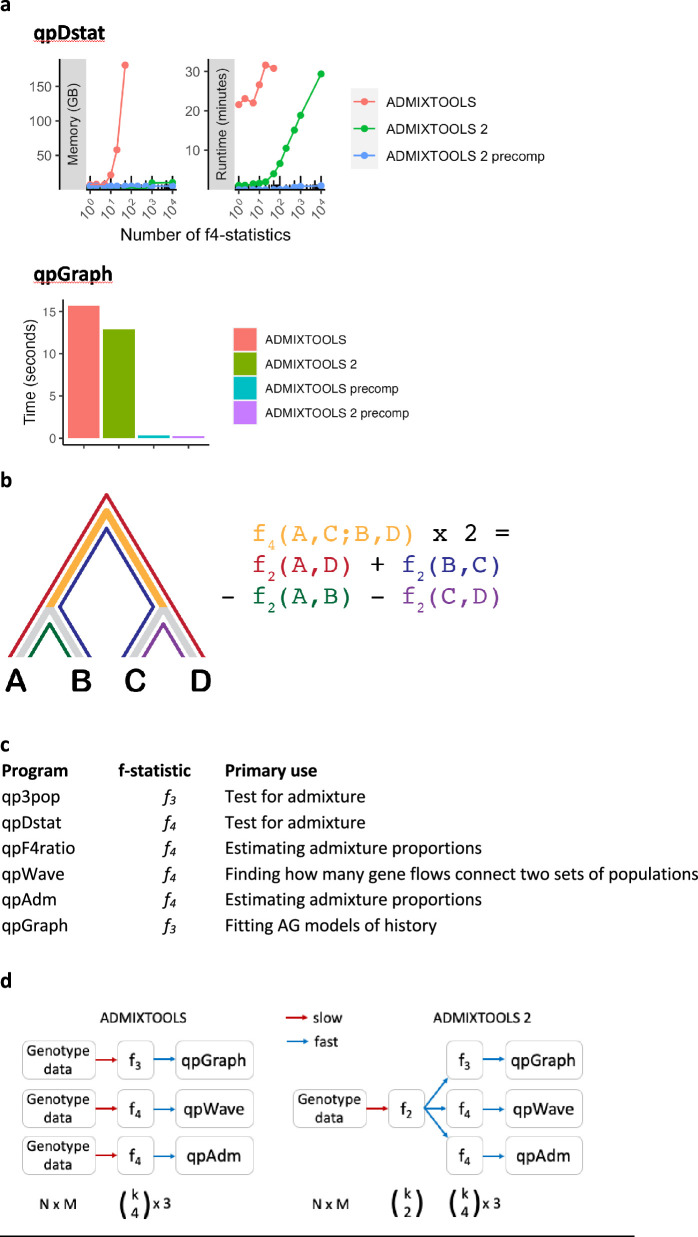
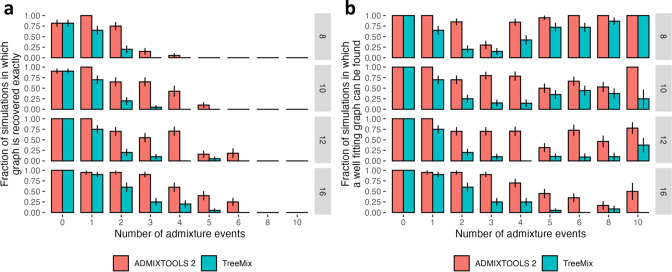
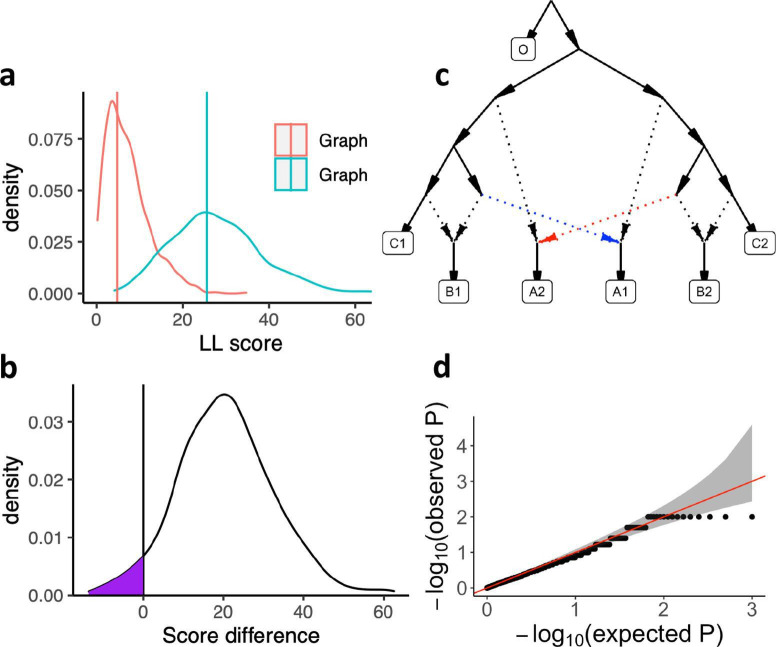
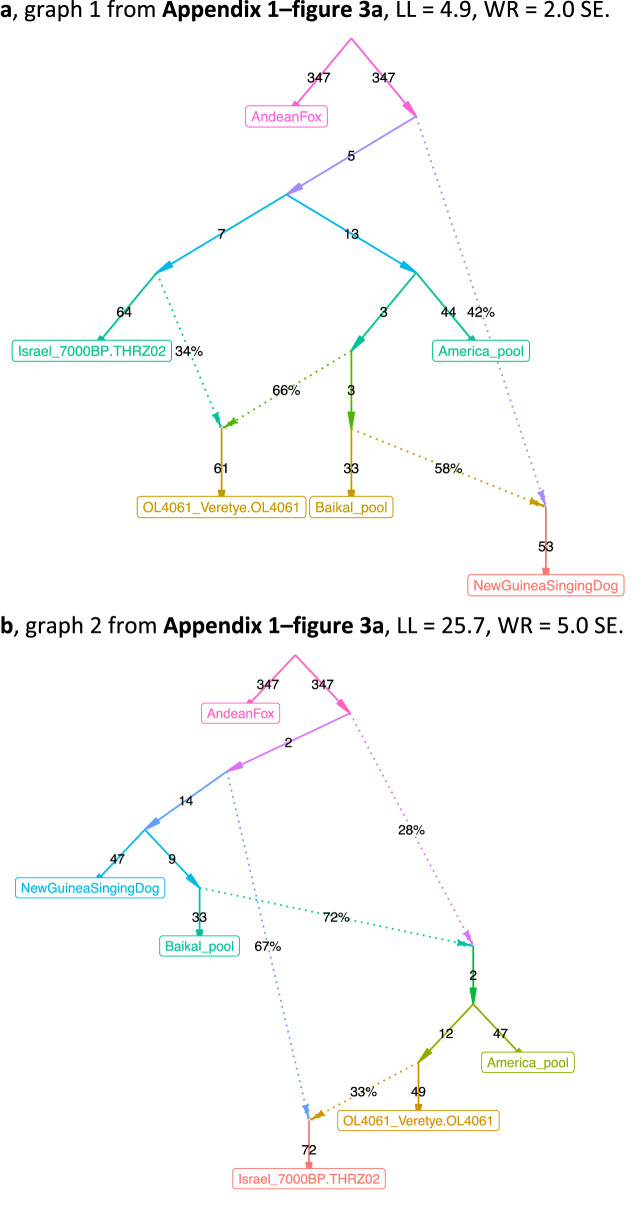
Our understanding of population history in deep time has been assisted by fitting admixture graphs (AGs) to data: models that specify the ordering of population splits and mixtures, which along with the amount of genetic drift and the proportions of mixture, is the only information needed to predict the patterns of allele frequency correlation among populations. The space of possible AGs relating populations is vast, and thus most published studies have identified fitting AGs through a manual process driven by prior hypotheses, leaving the majority of alternative models unexplored. Here, we develop a method for systematically searching the space of all AGs that can incorporate non-genetic information in the form of topology constraints. We implement this findGraphs tool within a software package, ADMIXTOOLS 2, which is a reimplementation of the ADMIXTOOLS software with new features and large performance gains. We apply this methodology to identify alternative models to AGs that played key roles in eight publications and find that in nearly all cases many alternative models fit nominally or significantly better than the published one. Our results suggest that strong claims about population history from AGs should only be made when all well-fitting and temporally plausible models share common topological features. Our re-evaluation of published data also provides insight into the population histories of humans, dogs, and horses, identifying features that are stable across the models we explored, as well as scenarios of populations relationships that differ in important ways from models that have been highlighted in the literature.

Keywords: admixture graphs; dogs; evolutionary biology; f-statistics; genetics; genomics; horses; human; humans; population genetics.


Conflict of interest statement

RM, PF, OF, UI, PC, DR No competing interests declared

Figures

Figure 1.
Figure 1.. Computer simulations show that when the true admixture graph (AG) topology is complex, findGraphs frequently finds AGs fitting the data better than the true AG.
(a) Fractions of distinct AGs found with findGraphs that fit the data nominally better than the true AG (according to log-likelihood [LL] scores). The simulated datasets are grouped by complexity class (eight or nine leaves, four or five admixture events) and by the number of admixture events allowed at the topology search stage (n − 1 on the left, n in the middle, and n + 1 on the right, where n is the true number of simulated admixture events). Each dot represents a simulated random history, and 20 such histories were simulated for each complexity class. (b) Fractions of distinct AGs found with findGraphs that fit the data significantly better than the true AG (two-tailed empirical p-value of the bootstrap model comparison method <0.05). (c) Fractions of distinct AGs found with findGraphs that fit the data well in absolute terms (WR < 3 SE). (d) Distinct AGs found for a particular simulated history (eight groups and four admixture events) in the LL and WR coordinates. Only best-fitting graphs with WR < 3 SE are shown. The fit of the true topology is shown in yellow, and topologies that fit the data significantly better than the true one are in purple. The true topology was not recovered by our findGraphs searches. (e) The true model from panel (d) and two alternative models found with findGraphs, both fitting significantly better than the true one (based on the bootstrap p-value) and very different topologically. This is presented as an example of very high topological diversity seen among well-fitting models. Model parameters (graph edges) that were inferred to be unidentifiable (see Appendix 1, Section 2.F) are plotted in red.
Figure 2.
Figure 2.. Log-likelihood (LL) scores of published graphs (those shown in Table 1) and automatically inferred graphs.
Each dot represents the LL score of a best-fitting graph from one findGraphs iteration (low values of the score indicate a better fit); only topologically distinct graphs are shown. LL scores for the published models and best-fitting alternative models found are shown by blue and pink x’s, respectively. Bootstrap distributions of LL scores for these models (vertical lines, 90% CI) and their medians (solid dots) are also shown. Lower scores of the fits obtained using all single-nucleotide polymorphisms (SNPs), relative to the bootstrap distribution, indicate overfitting. Green and red horizontal lines show the approximate locations where newly found models consistently have fits significantly better or worse, respectively, than those of the published model. In the case of the Bergström et al., Lazaridis et al., and Hajdinjak et al. studies, one or more worst-fitting models were removed for improving the visualization. The setups shown here (population composition, number of groups and admixture events, topology search constraints) match those shown in Table 1.
Figure 3.
Figure 3.. Published graphs and selected alternative models from three studies for which we explored alternative admixture graph (AG) fits.
In all cases, we selected a temporally plausible alternative model that fits nominally or significantly better than the published model and has important qualitative differences compared to the published model with respect to the interpretation about population relationships. In all but one case, the model has the same complexity as the published model shown on the left with respect to the number of admixture events; the exception is the re-analysis of the Librado et al., 2021 horse dataset since the published model with three admixture events is a poor fit (worst Z-score comparing the observed and expected f-statistics has an absolute value of 23.9 even when changing the composition of the population groups to increase their homogeneity and improve the fit relative to the composition used in the published study). For this case, we show an alternative model with 8 admixture events that fits well and has important qualitative differences from the point of view of population history interpretation. The existence of well-fitting AG models does not mean that the alternative models are the correct models; however, their identification is important because they prove that alternative reasonable scenarios exist that are qualitatively different from published models. Model parameters (graph edges) that were inferred to be unidentifiable (see Appendix 1, Section 2.F) are plotted in red. (a) The graph published by Bergström et al., 2020 (on the left) and a nominally better fitting graph for dogs that is more congruent to human history (on the right). For both species, Baikal and Native American groups are mixed between European- and East Asian-related lineages, and a ‘Basal Eurasian’ lineage contributes to West Asian groups; these features are all characteristic of human history but absent in the published dog graph. (b) The graph published by Librado et al., 2021 (modified population composition, on the left) and a significantly better fitting AG that is temporally and geographically plausible (on the right). In contrast to the published graph, in this graph with eight mixture events (the minimum necessary to obtain an acceptable statistical fit to the data), a lineage maximized in horses associated with Yamnaya steppe pastoralists or their Sintashta descendants (C-PONT, TURG, or DOM2) contributes a substantial proportion of ancestry to the horses from the Corded Ware Complex (CWC). Thus, in this model both CWC humans and horses are mixtures of Yamnaya and European farmer-associated lineages. This is qualitatively different from the suggestion that there was no Yamnaya-associated contribution to CWC horses which was a possibility raised in the paper. The AG with eight admixture events is also different from the published model in that it shows a fitting model where the Tarpan horse does not have the history claimed in the study (as an admixture of the CWC and DOM2 horses). (c) The graph published by Hajdinjak et al., 2021 (on the left) and a significantly better fitting AG, but without a specific lineage shared between the Bacho Kiro Initial Upper Paleolithic group and East Asians (on the right). In this model, all the lineages shared between Bacho Kiro IUP and East Asians contributed a large fraction of the ancestry of later European hunter–gatherers as well, and thus this graph does not imply distinctive shared ancestry between the earliest modern humans in Europe and later people in East Asia, and instead could be explained by a quite different and also archaeologically plausible scenario of a primary modern human expansion out of West Asia contributing serially to the major lineages leading to Bacho Kiro, then later East Asians, then Ust’-Ishim, then the primary ancestry in later European hunter–gatherers.
Figure 4.
Figure 4.. Published graphs and selected alternative models from three further studies for which we explored alternative admixture graph (AG) fits.
(a) The graph published by Lipson et al., 2020b (on the left) and a nominally better fitting AG (on the right). In contrast to the published graph, there is no single lineage specific to modern rainforest hunter–gatherers (Biaka and Mbuti) and Shum Laka (Cameroon_SMA). Rather, the primary ancestries in each group are separate deep-branching lineages (the deeper lineage they all share is also the source of the majority of ancestry in all anatomically modern humans modeled here). In contrast to the graph in the published paper, there is no West African-maximized ancestry present in mixed form in Biaka, Mbuti, and Shum Laka; archaic admixture is not limited to a subset of Africans but is present in all anatomically modern humans in various proportions; and there is no ghost modern human ancestry in Agaw, Biaka, Lemande, Mbuti, Mende, Mota, Shum Laka, and Yoruba. (b) The admixture graph published by Wang et al., 2021 (on the left) and a significantly better fitting AG meeting the constraints used to inform model building in the published paper (on the right). The finding of Onge-related admixture that is widespread in East Asia suggesting an early peopling via a coastal route is not a feature of this model. (c) The admixture graph published by Sikora et al., 2019 (simplified "Western" graph, on the left) and a nominally better fitting AG (on the right). The striking feature of the AG suggested in the paper whereby Mal’ta (MA1_ANE) derives some ancestry from a CHG-associated lineage is not a feature of this alternative model.
Appendix 1—figure 1.
Appendix 1—figure 1.. Performance comparison of f-statistic computation and AG fitting in Classic ADMIXTOOLS and ADMIXTOOLS 2 and an overview of the major ADMIXTOOLS programs.
(a) Performance comparison of f-statistic computation and AG fitting. Top: Memory usage and runtime for computing f-statistics using (1) the qpDstat program in ADMIXTOOLS v7.0.2 released in 06/2021, (2) the f4 function in ADMIXTOOLS 2 without precomputing f2-statistics, and (3) the f4 function in ADMIXTOOLS 2 with precomputed f2-statistics. (1) and (2) give identical results, whereas (3) only gives identical results in the absence of missing data, which limits its usefulness beyond a moderate number of populations. Bottom: Runtime comparison of qpGraph with and without precomputed f-statistics. (b) Illustration of f2- and f4-statistics. f2 measures the amount of drift separating any two populations, while f4 measures the amount of drift shared between two population pairs. Every f4-statistic is a linear combination of four f2-statistics. (c) Overview of the major ADMIXTOOLS programs, their primary use cases, and their associated f-statistics. (d) Schematic representation of the computations behind the ADMIXTOOLS programs qpGraph, qpWave, and qpAdm. ADMIXTOOLS 2 separates the computation of f2-statistics from the later steps in the pipeline. Shown below are the number of data points for N individuals, M SNPs, and k populations. The exact number of all possible non-redundant f2-, f3-, and f4-statistics for k populations are k2 , 12k3 , and 13(k4) . A small number of f2-statistics can be used to obtain a much larger number of f3- and f4-statistics and require much less storage space than the raw genotype data.
Appendix 1—figure 2.
Appendix 1—figure 2.. Comparison of accuracy of automated search for optimal topology in the findGraphs function of ADMIXTOOLS 2 and in TreeMix using simulated graphs with 8, 10, 12, and 16 populations, and 0–10 admixture events.
Error bars show standard errors calculated as SE2 = p (1 – p) / n, where p is the fraction on the y-axis and n is the number of simulations in each group (typically 20). In the case of ADMIXTOOLS 2, we applied findGraphs three times on each simulated dataset and picked a result with the best fit score. More details are provided in Methods. (a) Fraction of simulations where the simulated graph is recovered exactly. (b) Fraction of simulations where the simulated graph is either recovered exactly, or the score is at least as good as the score of the simulated graph, when both graphs are evaluated by ADMIXTOOLS 2. More admixture edges greatly increase the search space and make it more difficult to recover the simulated graph, but they do make it easier to find alternative graphs with good fits.
Appendix 1—figure 3.
Appendix 1—figure 3.. Calibrating the bootstrap model comparison approach.
(a) Bootstrap sampling distributions of the log-likelihood scores for two AGs (shown in Appendix 1—figure 3—Figure supplement 1) for the same populations fitted using real data. Vertical lines show the log-likelihood scores computed on all SNP blocks. (b) Distribution of differences of the bootstrap log-likelihood scores for both graphs (same data as in a). The purple area shows the proportion of resamplings in which the first graph has a higher score than the second graph. The two-sided p-value for the hypothesis of no difference is equivalent to twice that area (or one over the number of bootstrap iterations if all values fall on one side of zero). In this case it is 0.078. (c) The AG which was used to evaluate our method for testing the significance of the difference of two graph fits on simulated data. We simulated under the full graph and fitted two graphs that result from deleting either the red admixture edge or the blue admixture edge. These two graphs have the same expected fit score but can have different scores in any one simulation iteration. (d) QQ plot of p-values testing for a score difference between the two graphs (on simulated data) under the hypothesis of no difference, confirming that the method is well calibrated.
Appendix 1—figure 3—figure supplement 1.
Appendix 1—figure 3—figure supplement 1.. The admixture graphs compared in (Appendix 1—figure 3).
(a) Graph 1, LL = 4.9, WR = 2.0 SE. (b) Graph 2, LL = 25.7, WR = 5.0 SE.

Update of

  • doi: 10.1101/2022.05.08.491072

References

    1. Baumdicker F, Bisschop G, Goldstein D, Gower G, Ragsdale AP, Tsambos G, Zhu S, Eldon B, Ellerman EC, Galloway JG, Gladstein AL, Gorjanc G, Guo B, Jeffery B, Kretzschumar WW, Lohse K, Matschiner M, Nelson D, Pope NS, Quinto-Cortés CD, Rodrigues MF, Saunack K, Sellinger T, Thornton K, van Kemenade H, Wohns AW, Wong Y, Gravel S, Kern AD, Koskela J, Ralph PL, Kelleher J. Efficient ancestry and mutation simulation with msprime 1.0. Genetics. 2022;220:iyab229. doi: 10.1093/genetics/iyab229. - DOI - PMC - PubMed
    1. Bellwood P. The checkered prehistory of rice movement southwards as a domesticated cereal—from the yangzi to the equator. Rice. 2011;4:93–103. doi: 10.1007/s12284-011-9068-9. - DOI
    1. Bergström A, Frantz L, Schmidt R, Ersmark E, Lebrasseur O, Girdland-Flink L, Lin AT, Storå J, Sjögren KG, Anthony D, Antipina E, Amiri S, Bar-Oz G, Bazaliiskii VI, Bulatović J, Brown D, Carmagnini A, Davy T, Fedorov S, Fiore I, Fulton D, Germonpré M, Haile J, Irving-Pease EK, Jamieson A, Janssens L, Kirillova I, Horwitz LK, Kuzmanovic-Cvetković J, Kuzmin Y, Losey RJ, Dizdar DL, Mashkour M, Novak M, Onar V, Orton D, Pasarić M, Radivojević M, Rajković D, Roberts B, Ryan H, Sablin M, Shidlovskiy F, Stojanović I, Tagliacozzo A, Trantalidou K, Ullén I, Villaluenga A, Wapnish P, Dobney K, Götherström A, Linderholm A, Dalén L, Pinhasi R, Larson G, Skoglund P. Origins and genetic legacy of prehistoric dogs. Science. 2020;370:557–564. doi: 10.1126/science.aba9572. - DOI - PMC - PubMed
    1. Bergström A, Stanton DWG, Taron UH, Frantz L, Sinding M-HS, Ersmark E, Pfrengle S, Cassatt-Johnstone M, Lebrasseur O, Girdland-Flink L, Fernandes DM, Ollivier M, Speidel L, Gopalakrishnan S, Westbury MV, Ramos-Madrigal J, Feuerborn TR, Reiter E, Gretzinger J, Münzel SC, Swali P, Conard NJ, Carøe C, Haile J, Linderholm A, Androsov S, Barnes I, Baumann C, Benecke N, Bocherens H, Brace S, Carden RF, Drucker DG, Fedorov S, Gasparik M, Germonpré M, Grigoriev S, Groves P, Hertwig ST, Ivanova VV, Janssens L, Jennings RP, Kasparov AK, Kirillova IV, Kurmaniyazov I, Kuzmin YV, Kosintsev PA, Lázničková-Galetová M, Leduc C, Nikolskiy P, Nussbaumer M, O’Drisceoil C, Orlando L, Outram A, Pavlova EY, Perri AR, Pilot M, Pitulko VV, Plotnikov VV, Protopopov AV, Rehazek A, Sablin M, Seguin-Orlando A, Storå J, Verjux C, Zaibert VF, Zazula G, Crombé P, Hansen AJ, Willerslev E, Leonard JA, Götherström A, Pinhasi R, Schuenemann VJ, Hofreiter M, Gilbert MTP, Shapiro B, Larson G, Krause J, Dalén L, Skoglund P. Grey wolf genomic history reveals a dual ancestry of dogs. Nature. 2022;607:313–320. doi: 10.1038/s41586-022-04824-9. - DOI - PMC - PubMed
    1. Boos DD. Introduction to the bootstrap world. Statistical Science. 2003;18:168–174. doi: 10.1214/ss/1063994971. - DOI

Publication types