. 2023 Jul 3;220(7):e20221654.
doi: 10.1084/jem.20221654. Epub 2023 Apr 14.

A cell-free antigen processing system informs HIV-1 epitope selection and vaccine design

Affiliations

A cell-free antigen processing system informs HIV-1 epitope selection and vaccine design

Srona Sengupta et al. J Exp Med. .

Abstract

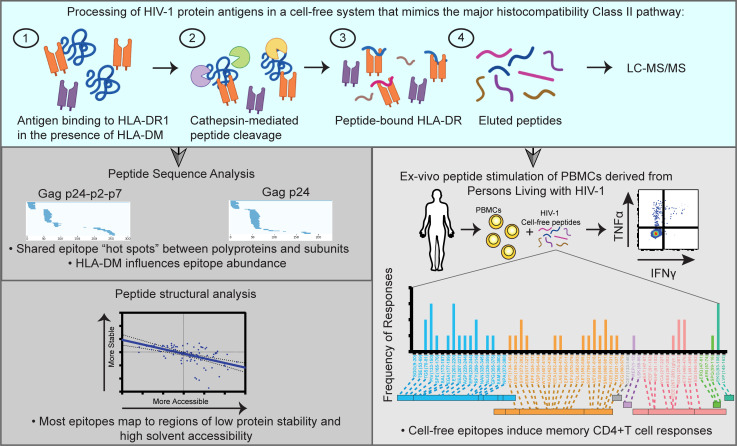
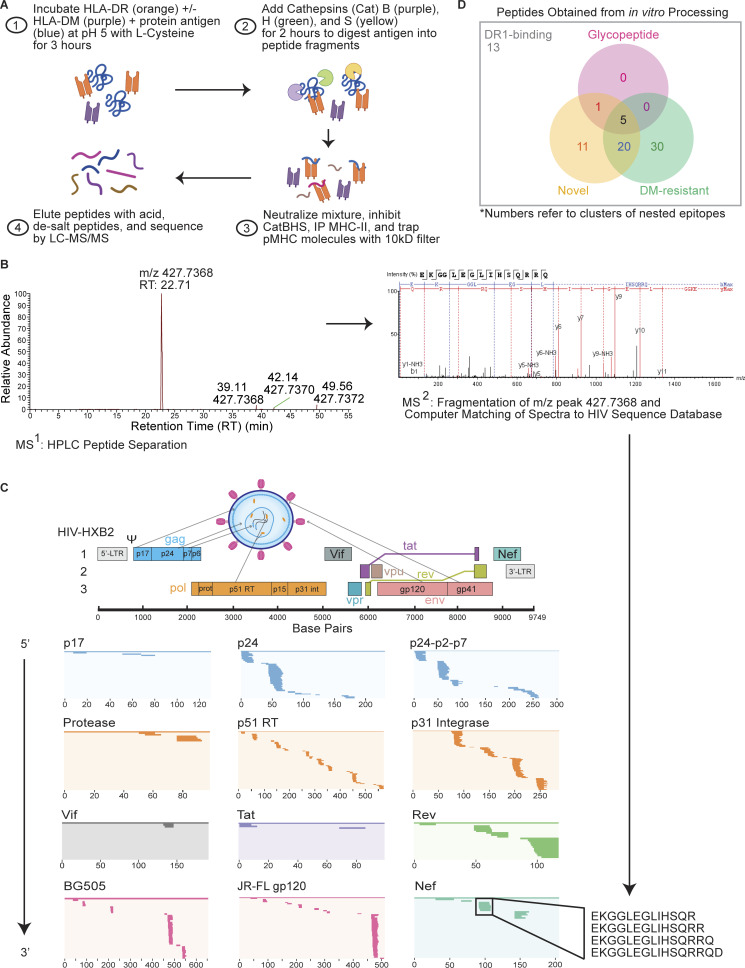
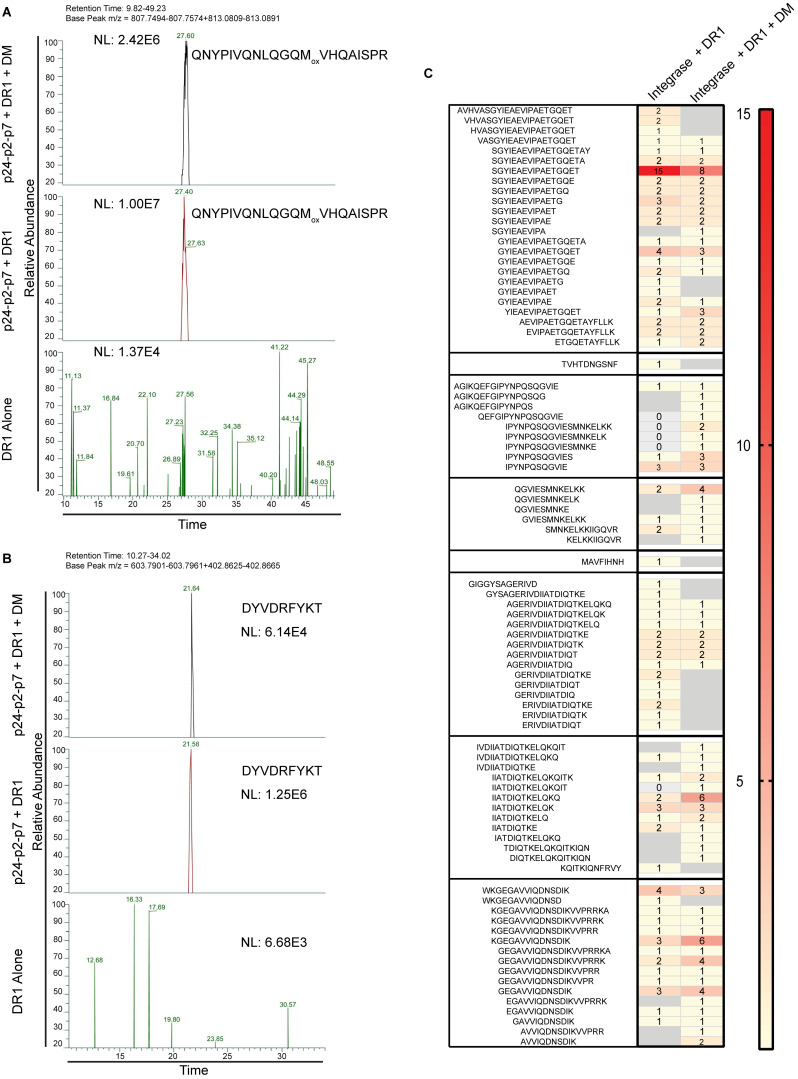
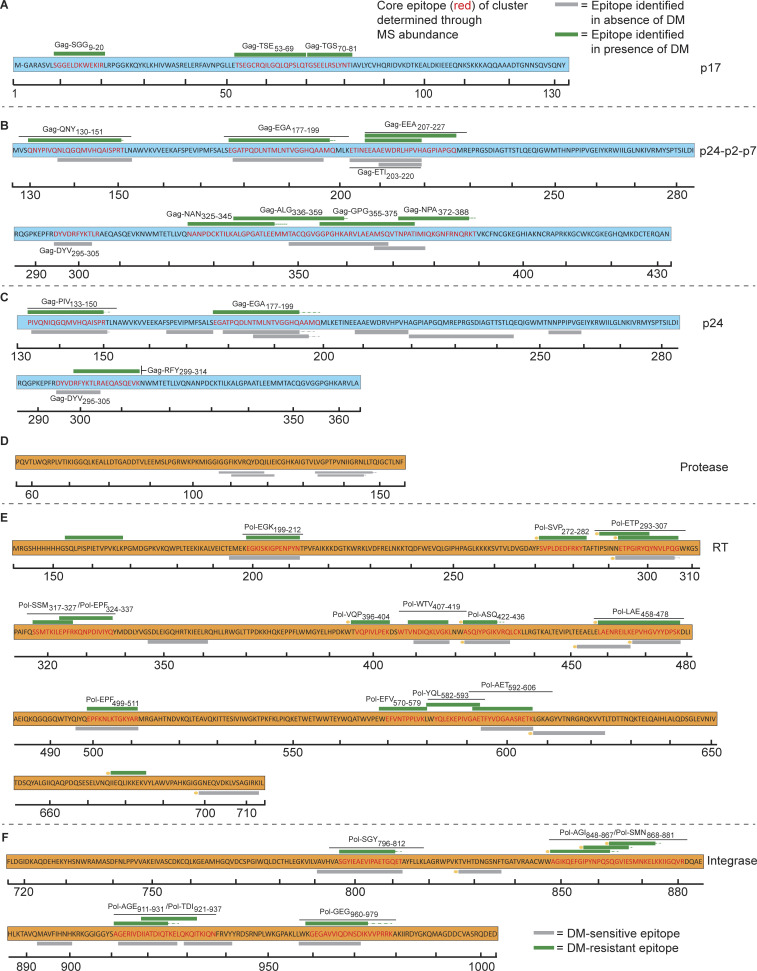
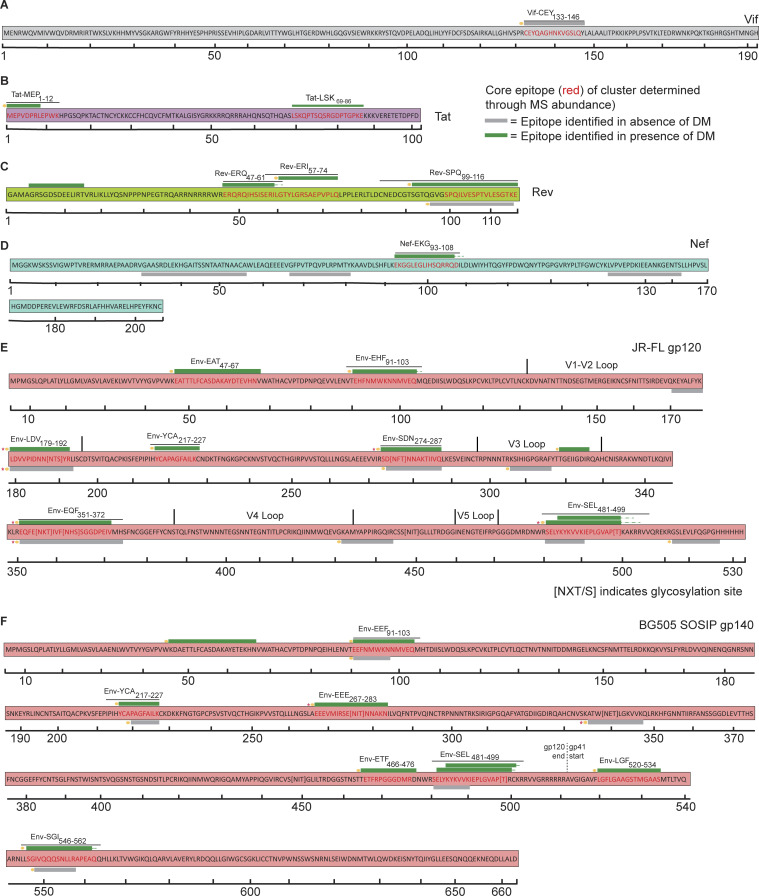
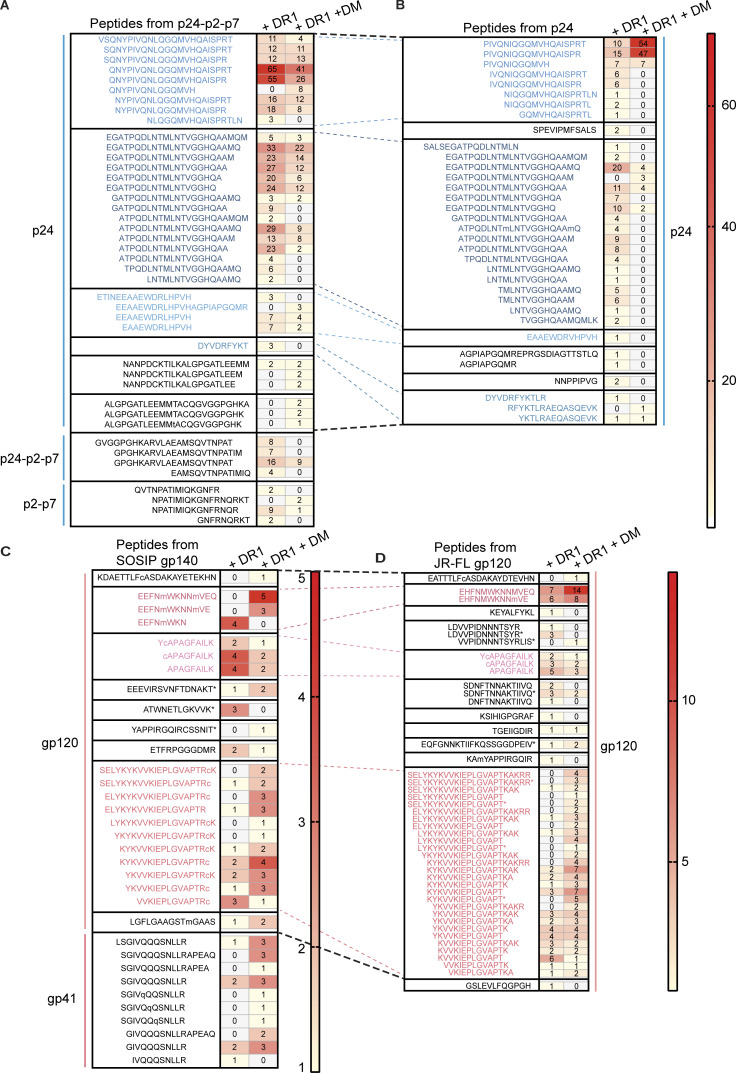
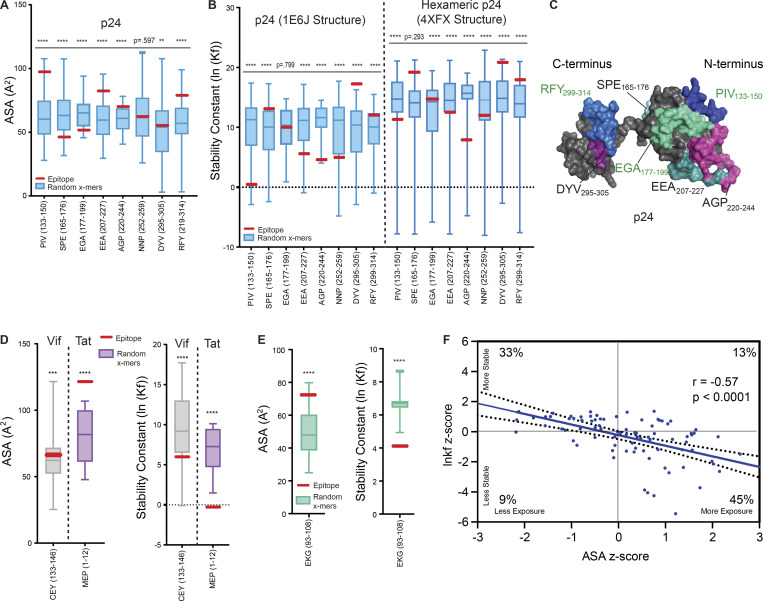
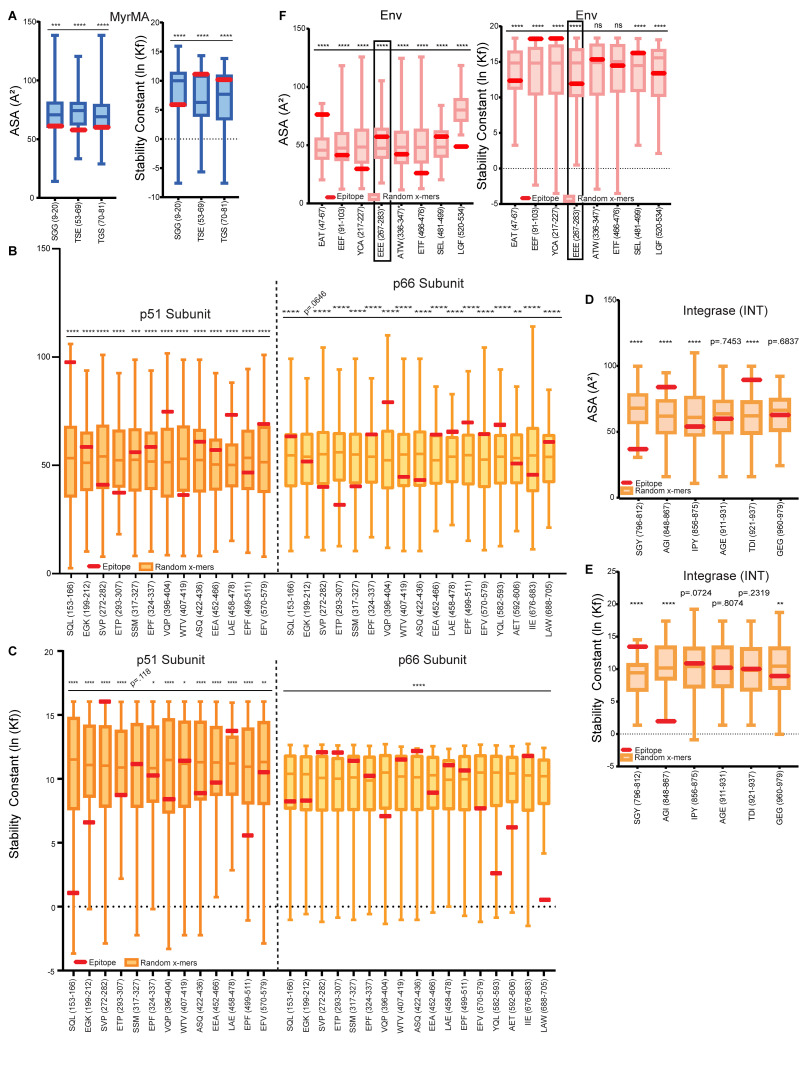
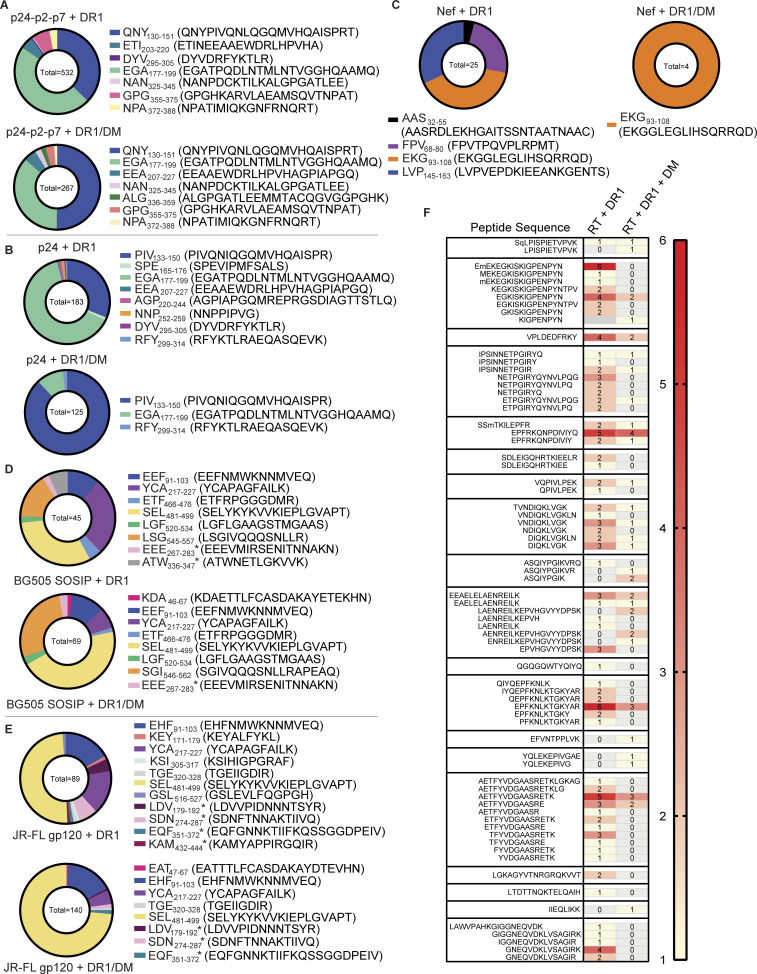
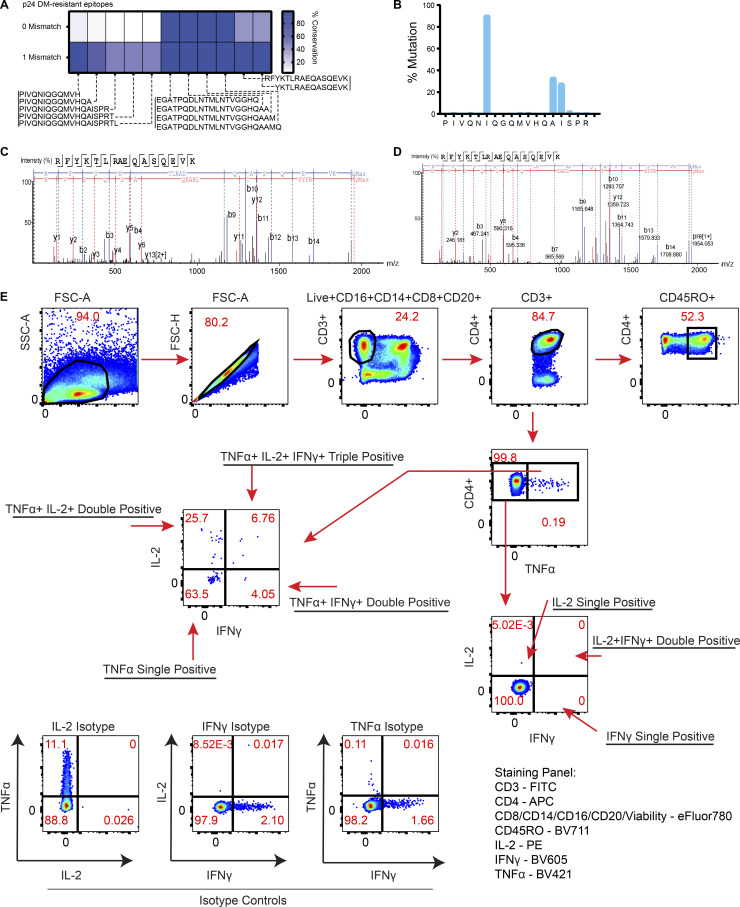
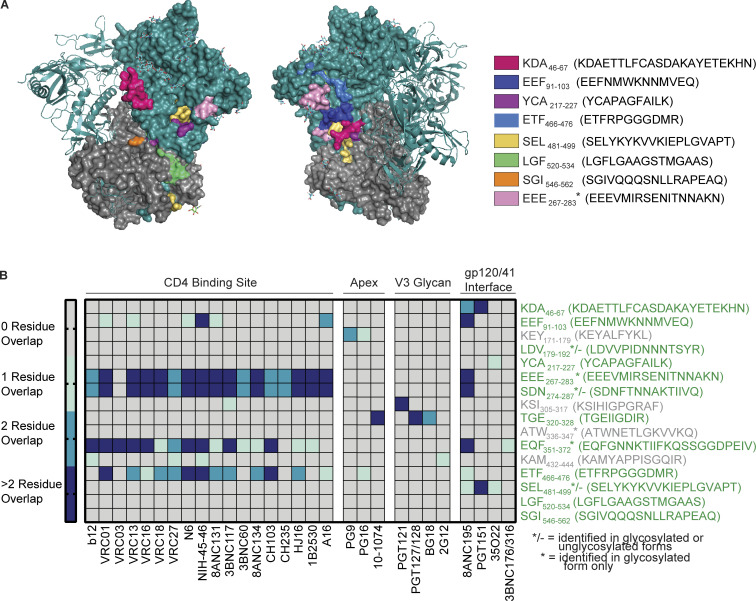
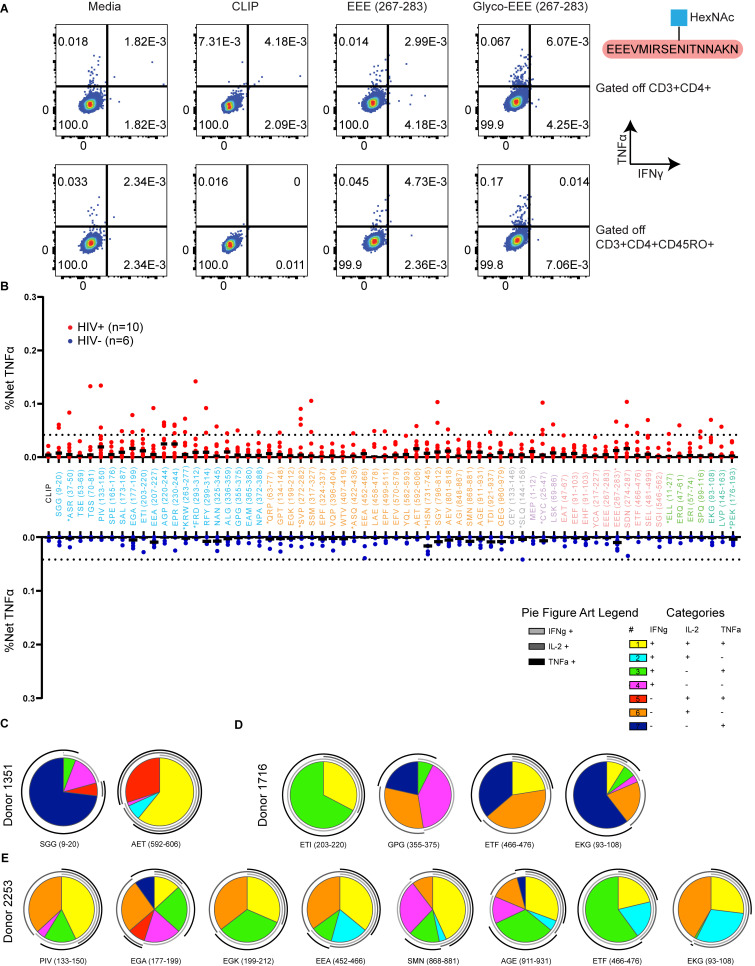
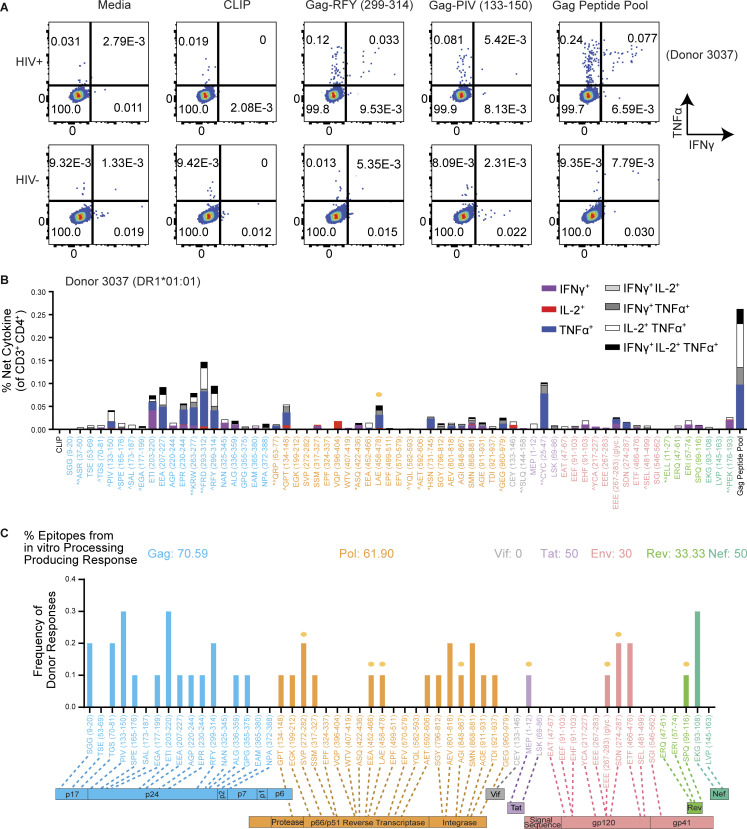
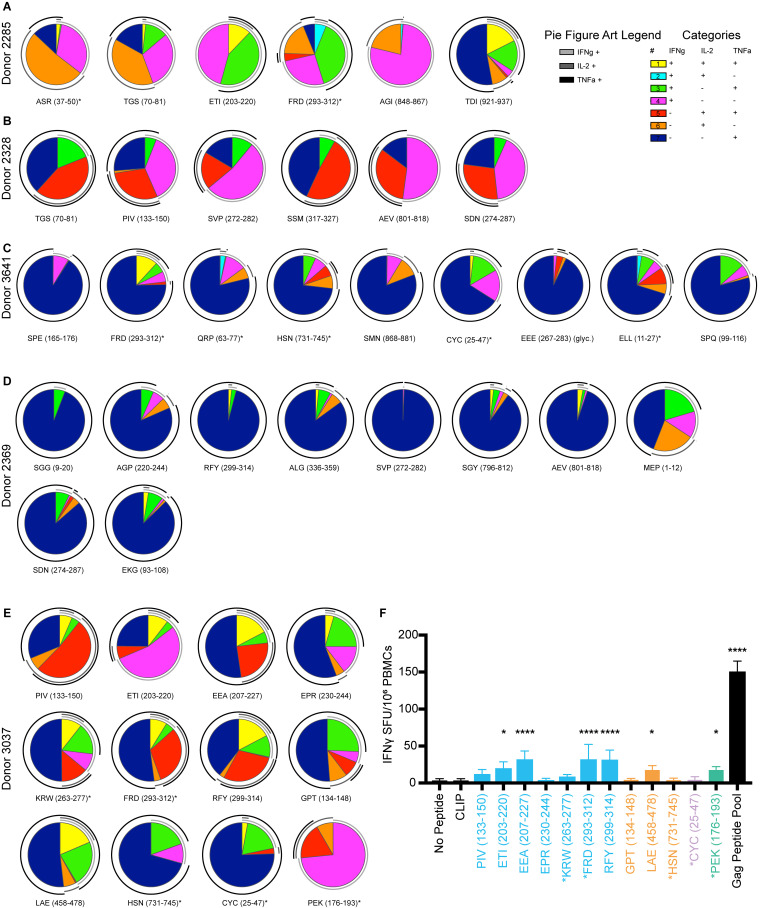
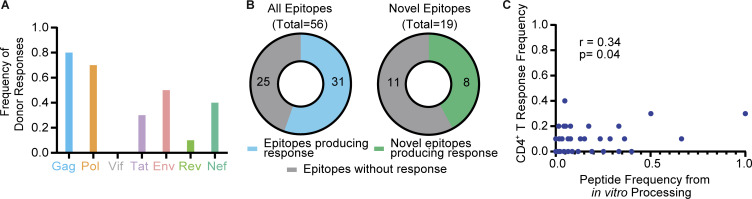
Distinct CD4+ T cell epitopes have been associated with spontaneous control of HIV-1 replication, but analysis of antigen-dependent factors that influence epitope selection is lacking. To examine these factors, we used a cell-free antigen processing system that incorporates soluble HLA-DR (DR1), HLA-DM (DM), cathepsins, and full-length protein antigens for epitope identification by LC-MS/MS. HIV-1 Gag, Pol, Env, Vif, Tat, Rev, and Nef were examined using this system. We identified 35 novel epitopes, including glycopeptides. Epitopes from smaller HIV-1 proteins mapped to regions of low protein stability and higher solvent accessibility. HIV-1 antigens associated with limited CD4+ T cell responses were processed efficiently, while some protective epitopes were inefficiently processed. 55% of epitopes obtained from cell-free processing induced memory CD4+ T cell responses in HIV-1+ donors, including eight of 19 novel epitopes tested. Thus, an in vitro processing system utilizing the components of Class II processing reveals factors influencing epitope selection of HIV-1 and represents an approach to understanding epitope selection from non-HIV-1 antigens.


Conflict of interest statement

Disclosures: S.G. Deeks reported personal fees from Tendel during the conduct of the study. No other disclosures were reported.

Figures

None
Graphical abstract
Figure 1.
Figure 1.
Cell-free antigen processing system identifies immunodominant epitopes in HIV-1 proteome. (A) Cell-free processing workflow. HIV-1 protein antigens were incubated with HLA-DR and +/− DM in reducing conditions and low pH for 3 h before the addition of cathepsins B, H, and S (CatBHS) for 2 h. The solution was neutralized, cathepsins inhibited, and DR1 was immunoprecipitated. Peptides were eluted and sequences identified by LC-MS/MS. (B) Extracted base peak chromatograph representing a peptide from LC-MS (MS1) of Nef cell-free-derived epitopes. Further fragmentation of the peptide (MS2) resulted in individual b and y ions corresponding to amino acids for the Nef-EKG93-108 epitope (Table S4). (C) The HIV-1 genome with its three reading frames is shown, along with the near-full proteome that was subjected to cell-free processing. Locations of epitopes from in vitro processing in all conditions (+/− DM) are shown as lines within the overall protein sequence and listed in 5′ to 3′ order. Shown for Nef within the black box is a cluster of epitopes corresponding to Nef-EKG93-108, a hot spot obtained from cell-free processing. (D) Venn diagram showing number of epitope clusters identified through cell-free processing of the HIV-1 proteome. Novel epitopes exclude those previously reported to induce memory responses in HIV+ individuals or vaccine recipients (LANL, 2018) and have <60% overlap with a literature epitope (Table S4). “13” indicates the number of epitope clusters that bind to DR1 only in the absence of DM and are not novel epitopes or glycopeptides. Data in C and D represent two independent experiments performed per antigen tested in single determinations due to antigen availability and the quantity required per assay.
Figure S1.
Figure S1.
A cell-free processing system utilizing HLA-DR1 (DRB1*01:01), DM, and three cathepsins (B, H, and S) yields DM-sensitive and DM-resistant epitopes that are not observed in a no-antigen control. (A) Extracted base peak chromatographs from p24-p2-p7 from in vitro processing + DM (top panel), −DM (middle panel), or without antigen (bottom panel) highlighting the epitope Gag-QNYPIVQNLQGQMoxVHQAISPR. This epitope was identified with oxidized/unoxidized Methionine forms. Neutral loss (NL, measure of peak intensity) at the retention time and m/z for this epitope was 2–3 logs higher (106/107) compared with the no-antigen control (NL ∼ 104), which had expected levels of background noise. (B) Extracted base peak chromatograph of p24-p2-p7 highlighting an example of a DM-sensitive epitope, Gag-DYV295-305. This epitope was identified with a high NL score without DM (middle) translating to 0 PSMs but lower NL score in the presence of DM (top). Both NL scores are logs higher than the no protein control. (C) Representative heat map showing PSM differences for cell-free processing of INT in the presence of DR1 +/− DM. Data in A–C are representative of two independent experiments performed per antigen tested in single determinations.
Figure 2.
Figure 2.
Cell-free processing of Gag and Pol proteins reveal epitope hot spots. Epitopes from the HIV-1 Gag and Pol proteins identified by LC-MS/MS from cell-free processing are shown in the form of epitope maps, with epitopes highlighted across the Gag and Pol proteins. (A–C) Maps for Gag proteins include (A) p17 (where M- indicates myristoylation of the first Gly residue), (B) p24-p2-p7, and (C) p24. (D–F) Epitope maps for Pol proteins include (D) protease, (E) RT, and (F) INT. Green bars indicate epitopes obtained both in the presence and absence of DM (DM-resistant); gray bars indicate epitopes obtained only in the absence of DM (DM-sensitive). Hatched lines indicate additional residues (i.e., “ragged edges”) at the ends of epitopes that were observed (see below, Fig. 4, A and B). For each epitope cluster, the core epitope was defined using the peptide with the greatest number of PSMs (see below, Fig. 4, A and B). Novel epitopes (<60% overlap with existing 2018 LANL Database epitopes, see Table S4) are indicated with gold circles. Epitope maps in A–F represent two independent experiments performed per antigen tested in single determinations.
Figure 3.
Figure 3.
Cell-free processing of HIV-1 accessory proteins and Env yields epitope hot spots and reveals overlapping epitopes. (A–D) Epitope maps of (A) Vif, (B) Tat, (C) Rev, and (D) Nef peptides obtained from in vitro cell-free processing. (E and F) Epitope maps of peptides identified from cell-free processing of (E) gp120 (JR-FL strain) and (F) gp140 (BG505 SOSIP). As above, green bars indicate epitopes obtained both in the presence and absence of DM (DM-resistant); gray bars indicate epitopes obtained only in the absence of DM (DM-sensitive). Novel epitopes are indicated by gold circles. Pink stars indicate epitopes containing an N- or O-linked glycosyl moiety. Epitope maps in A–F represent two independent experiments performed per antigen tested in single determinations.
Figure 4.
Figure 4.
Cell-free processing reveals similarities in epitopes from HIV-1 polyproteins versus individual subunits. (A and B) Heat maps displaying PSMs identified at >95% probability from in vitro processing of (A) p24-p2-p7 (eight clusters) or (B) p24 (seven clusters) in the presence of DR1 +/− DM. Peptides within solid lines indicate a cluster or nested set of epitopes. Peptide clusters were defined based on shared start and end residues, as well as the extent of overlap between the P1 and P9 anchor residues for DR1. p24-p2-p7 contains a VSQNY extension from p17 at the 5′ end. Slight sequence differences from the p24 portion of p24-p2-p7 (utilizing NL4.3 lab strain, which contains the NY5 sequence for Gag) compared to p24 alone (HXB2, an infectious molecular clone of LAV) can be observed in certain epitopes, such as the Leu to Ile mutation in Gag-PIV: PIVQNIQGQMVHQAISPR. (C and D) Heat maps showing PSM differences from cell-free processing of (C) gp140 (BG505 SOSIP) and (D) gp120 (JR-FL) in the presence of DR1 +/− DM. Black hashed lines in A–D indicate where the individual protein (i.e., p24) derives from the polyprotein (i.e., p24-p2-p7). Light blue (Gag) or pink (Env) hashed lines indicate common epitopes shared between the individual protein (B, D) and the polyprotein (A, C). Asterisks in C and D indicate glycopeptides.
Figure 5.
Figure 5.
Exposed or structurally unstable regions of HIV-1 proteins predict epitope dominance. (A) Epitopes from p24 (Fig. 4 B) were analyzed for solvent accessibility (ASA) by PDB PISA algorithms from the PDB structure 1E6J. Higher values of ASA indicate higher epitope exposure. Data are displayed as box-and-whisker plots showing the epitope of interest (EOI) in red compared to a distribution of average ASA values of random x-mers spanning the entirety of the protein (derived via sliding scale analysis, see Materials and methods). These distributions exclude the EOI in red so that its stability relationship with the rest of the protein can be visualized. (B) Epitopes from p24 were analyzed for stability, expressed as average stability constants (lnKf) by the COREX/BEST algorithm, from PDB structures 1E6J and 4XFX. Data are displayed in box-and-whiskers plots as in A. Lower values of lnKf indicate lower epitope stability. (C) p24 epitopes obtained from cell-free processing in the absence (black text labels) or presence (green text labels) of DM are highlighted (PDB: 1E6J). Epitope NNP252-259 located on the posterior surface of 1E6J is not shown. (D and E) Comparison of accessibility (PDB PISA, left) and stability (COREX, right) of dominant epitopes obtained from cell-free processing of Vif (D, gray), Tat (D, purple), and Nef (E) relative to a distribution of randomly generated x-mer epitopes spanning these proteins (see Methods), excluding the EOI. EOI is shown in red. Structures used for analysis in D and E are shown in Table S1. (F) Two-tailed Pearson correlation was used to analyze the relationship between z-scores of ASA (PDB PISA) versus lnKf (stability, COREX) for all peptides obtained from cell-free processing. Best fit line is shown encased in a 95% confidence interval. Quadrants dividing the data into more/less stable and more/less accessible regions of the graph were used to obtain frequencies of epitopes within each group. Data in A, B, D, and E that were normally distributed were subject to a one-sample, two-tailed t test, and non-normally distributed data were subject to a two-tailed Wilcoxon Signed Rank Test, comparing the mean (t test) or median (Wilcoxon Signed Rank) of the distribution to the mean stability of the epitope. **P < 0.01; ***P < 0.001; ****P < or = 0.0001.
Figure S2.
Figure S2.
Accessibility and stability trends of HIV-1 epitopes from cell-free antigen processing. (A) Epitopes from Myr-MA were analyzed by PDB PISA and COREX/BEST algorithms. Box-and-whiskers plots show distribution of average solvent ASA (left) or stability constants (right) of random x-mers spanning the protein (derived via sliding scale analysis, see Materials and methods). These distributions exclude the EOI, shown in red so that its accessibility/stability relationship to the rest of the protein can be visualized. In these plots, higher ASA values indicate higher epitope exposure and lower lnkf values indicated decreased epitope stability. (B and C) Box-and-whiskers plots showing the distribution of (B) average ASA or (C) average stability constants from randomly generated p51 and p66 epitopes excluding the EOI. EOI in red. Stability constants were determined using COREX based on the 1HMV structure of RT, analyzing each subunit independently. (D and E) Box-and-whiskers plots showing the distribution of average (D) ASA or (E) stability of random x-mer epitopes spanning the INT protein (1EX4) and excluding the EOI. (F) Box-and-whiskers plot showing the distribution of average ASA (PDB PISA; left) or stability (COREX; right) of random x-mer epitopes spanning the BG505 SOSIP protein (4ZMJ) and excluding the EOI, with a box highlighting the EEE glycopeptide. EOI is shown in red. Normally distributed data in A–F were subject to a one-sample, two-tailed t test, and non-normally distributed data were subject to a two-tailed Wilcoxon Signed Rank Test, comparing the mean (t test) or median (Wilcoxon Signed Rank) of the distribution to the mean ASA or stability of the epitope. *P < 0.05; **P < 0.01; ***P < 0.001; ****P < or = 0.0001.
Figure 6.
Figure 6.
Cell-free processing displays influence of DM influences on epitope dominance and relative abundance. (A and B) Relative differences in abundance of various (A) p24-p2-p7 or (B) p24 epitopes are shown as differences in PSMs in the absence (above) or presence (bottom) of DM. The total number of PSMs within pie charts was obtained by summing all PSMs for the protein antigen (see Materials and methods for peptide identification criteria). (C) Relative differences in abundance of Nef epitopes are shown as differences in PSMs in the absence (left) or presence (right) of DM, with convergence on one dominant epitope (EKG93-108) in the presence of DM. (D and E) Relative differences in PSMs from cell-free processing of (D) gp140 (BG505) or (E) gp120 (JR-FL) are shown in the absence (top) or presence (bottom) of DM. (F) Peptide sequences from in vitro processing of RT fell into 19 major clusters. Data are shown as a heat map with PSMs in the presence of DR ± DM. 14 clusters are observed in the presence of DM. Data in A–F represent two independent experiments performed per antigen tested in single determinations.
Figure S3.
Figure S3.
Mutational and peptide detection characteristics of cell-free-derived HIV-1 epitopes, and gating scheme for measuring CD4+ T cell responses from PLWH. (A) Heat map showing epitope sequence prevalence of all epitopes obtained from cell-free processing of p24 compared with 1066 Clade B sequences (LANL), with either 0 or 1 aa mismatch tolerated. (B) Percentage of mismatches per residue is shown for Gag-PIV133-150 from p24-HXB2. (C) MS/MS scan shows b/y ions for a low-abundance, DM-resistant epitope RFYKTLRAEQASQEVK (Gag-RFY299-314) from p24 cell-free processing identified with 1 PSM. (D) MS/MS scan of same epitope (Gag-RFY299-314), this time synthesized and spiked in at 25 femtomole quantity into murine B cell peptide elution samples containing self-peptides. (E) Representative gating strategy for single-, double-, and triple-positive intracellular cytokine responses gated off of Live+CD3+CD4+ T after 16 h of PBMC incubation with single HIV-1 peptides from cell-free processing. Fluorescence minus one controls containing the relevant isotype antibodies were used for gating for cytokines, and CD45RO+ was used to confirm that responses were in the memory compartment.
Figure 7.
Figure 7.
Most Env epitopes are located in the gp120/41 interface and CD4 binding site. (A) Visualization of DM-resistant epitopes within the full BG505 trimer (PDB 4ZMJ). gp120 monomers are shown in teal (one monomer as a surface depiction and two monomers as ribbons). Trimeric gp41 ectodomain is shown in gray and glycans in cyan. * indicates EEE267-283 is a glycopeptide. (B) Epitopes from cell-free processing ± DM of gp120 and gp140 are displayed in a heat map showing their overlap with the binding footprint of several well-characterized bNAbs (HIV LANL Database). */− indicates epitopes identified in glycosylated or unglycosylated forms, while * indicates epitopes identified only in glycosylated form. Epitopes in gray were identified in the absence of DM, while epitopes in green were identified in the presence or absence of DM. Data represent two independent experiments performed per antigen tested in single determinations.
Figure S4.
Figure S4.
DR1-restricted memory CD4+ T cell response to a glycopeptide epitope, lack of responses to epitopes from DR1*01:01 HIV donors, and polyfunctionality of responses. (A) IFNγ+TNFα+ cytokine responses gated off of CD3+CD4+ (top) or CD3+CD4+CD45RO+ (bottom) cells are shown for Donor 3641 in response to media only, CLIP (irrelevant peptide), unglycosylated Env-EEE267-283, and glycosylated Env-EEE267-283. (B) Total TNFα induced across n = 6 HIV donors and n = 10 HIV+ donors from PBMC peptide-pulsing experiments, with specific activation percentages (net TNFα) corrected by subtracting the background TNFα from media stimulation to allow for comparison between both groups. A dotted line is drawn at the highest-magnitude net TNFα responses from HIV donors (0.042%). (C–E) CD4+ T cell cytokine secretion from DR1*01:01 PLWH was analyzed from Donors (C) 1351, (D) 1716, and (E) 2253 in response to peptides derived from cell-free processing (Table S4). Activation after stimulation in A–E was measured in single determinations due to the large number of cell-free-derived epitopes tested and the cell input required for testing polyfunctional cytokine responses by flow cytometry.
Figure 8.
Figure 8.
Epitopes from cell-free processing induce cytokine responses in DR1*01:01 HIV+ individuals. (A) Representative flow cytometry plots of IFNγ+TNF+ release from CD3+CD4 T cells after 16 h of PBMC incubation with Gag-RFY299-314 and Gag-PIV133-150 in a DR1*01:01+ HIV+ individual (Donor 3037) compared to a DR1*01:01+ HIV donor. Media, CLIP (irrelevant peptide), and Gag peptide pool controls are shown for comparison. (B) Representative single-, double-, and triple-positive (see legend) responses from the CD4+ T cells of Donor 3037 from ex vivo PBMC stimulation with 65 peptides across the HIV-1 proteome. Single-positive responses indicate cells that produced either IL-2, IFNγ, or TNFα, double-positive responses indicate cells that produced two of the three cytokines assessed, and triple-positive responses indicate cells producing all three cytokines. Asterisks denote peptides from the literature, while the remaining 56 peptides were identified from in vitro processing and selected for testing in this screen (Table S4). ^ indicates epitopes from the literature known to be restricted by HLA DR1*01:01. Gold circles indicate novel epitopes identified from cell-free processing that induced a response. Activation after stimulation was measured in single determinations. (C) Frequency of HIV+ donor responses to 56 of the epitopes obtained from cell-free processing as measured by IL-2, IFNγ, or TNFα positivity compared with CLIP within each donor. Responses were considered positive if they were polyfunctional and at least two of the cytokines measured represented a >2.95-fold increase in the magnitude of response relative to CLIP. The percent of epitopes from in vitro processing that produced a response is listed in the corresponding color. Responses to novel epitopes are indicated with a gold circle. Data in C were obtained from n = 10 HIV+ donors. Activation after stimulation was measured in single determinations due to the large number of cell-free-derived epitopes tested and the cell input required for testing polyfunctional cytokine responses by flow cytometry.
Figure S5.
Figure S5.
Polyfunctionality of CD4+ T cell responses in PLWH to peptides derived from cell-free processing and IFNγ ELISPOT validation for Donor 3037. (A–E) CD4+ T cell cytokine secretion from DR1*01:01 PLWH was analyzed from Donors (A) 2285, (B) 2328, (C) 3641, (D) 2369, and (E) 3037 in response to peptides derived from cell-free processing. Peptides are listed as in Table S4, with asterisks denoting control peptides identified in the literature. Double-positive cells were those that produced two cytokines. Double positive cells were calculated by the following strategies: (a) IL-2+TNFα+: Lymphocytes→ Single Cells→ Live+CD3+→ CD3+CD4+→ TNFα+ → IL-2+, and the percentage of IL-2+ cells was multiplied by the percentage of TNFα+ cells from the parent gate; (b) IFNγ+TNFα+: Lymphocytes→ Single Cells→ Live+ CD3+→ CD3+CD4+→ TNFα+→ IFNγ+, and the percentage of IFNγ+ cells were multiplied by the percentage of TNFα+ cells from the parent gate; (c) IL-2+IFNγ+ Lymphocytes→ Single Cells→ Live+CD3+→ CD3+CD4+→ IL-2+ IFNγ+ → TNFα, and the percentage of TNFα cells were multiplied by the percentage of IL-2+ IFNγ+ cells from the parent gate. Single-positive populations were calculated by the following: (a) IL-2+: Lymphocytes→ Single Cells→ Live+CD3+→ CD3+ CD4+ → TNFα → IL-2+ IFNγ, and the percentage of IL-2+ IFNγ cells were multiplied by the percentage of TNFα cells from the parent gate; (b) IFNγ+: Lymphocytes→ Single Cells→ Live+CD3+→ CD3+ CD4+ → TNFα→ IL-2 IFNγ+, and the percentage of IL-2 IFNγ+ cells were multiplied by the percentage of TNFα- cells from the parent gate; (c) TNFα+: Lymphocytes→ Single Cells→ Live+CD3+→ CD3+ CD4+ → TNFα+ → IL-2IFNγ, and the percentage of IL-2 IFNγ cells were multiplied by the percentage of TNFα+ cells from the parent gate. Data gated in this manner was analyzed by SPICE and represented as pie charts in A–E. Responses depicted are to those peptides that induced CD4+ T cell cytokine responses that were 2.95-fold greater than the response to CLIP. Activation after stimulation in A–E was measured in single determinations. (F) IFNγ ELISPOT from Donor 3037 with data shown as spot forming units (SFU) per million PBMCs. Peptides utilized were those shown in E. Responses to negative controls (no peptide, CLIP) and positive control (Gag peptide pool) are shown as comparators, with six replicate wells run for each condition. Data represents two independent experiments. Significance difference relative to CLIP determined by one-way ANOVA with Dunnett’s test for multiple comparisons, *P < 0.05, ****P < 0.0001.
Figure 9.
Figure 9.
Characteristics of CD4+T cell responses from DR1*01:01+ HIV+ individuals to epitopes identified from cell-free processing. (A) Frequency of HIV+ donor responses to individual HIV-1 antigens are shown. (B) Number of epitopes producing a CD4+ T cell response of the 56 total and 19 novel epitopes tested in ex vivo stimulation experiments are shown. (C) Pearson correlation between peptide frequency from in vitro processing and donor CD4+ T cell response frequency across PLWH is shown. Peptide frequency was assessed by dividing PSMs for an epitope by the total MS spectra for a particular protein. r and P values are shown. Data in A–C were obtained from n = 10 HIV+ donors. Activation after stimulation was measured in single determinations.

Similar articles

Cited by

References

    1. Abelin, J.G., Keskin D.B., Sarkizova S., Hartigan C.R., Zhang W., Sidney J., Stevens J., Lane W., Zhang G.L., Eisenhaure T.M., et al. . 2017. Mass spectrometry profiling of HLA-associated peptidomes in mono-allelic cells enables more accurate epitope prediction. Immunity. 46:315–326. 10.1016/j.immuni.2017.02.007 - DOI - PMC - PubMed
    1. Addison, M.M., Ellis, G.I., Leslie, G.J., Zawadzky, N.B., Riley, J.L., Hoxie, J.A., and Eisenlohr, L.C.. 2022. HIV-1–Infected CD4 + T Cells Present MHC Class II–Restricted Epitope via Endogenous Processing. J Immunol. 209: 864–873. 10.4049/jimmunol.2200145 - DOI - PMC - PubMed
    1. Alpert, A.J., and Andrews P.C.. 1988. Cation-exchange chromatography of peptides on poly(2-sulfoethyl aspartamide)-silica. J. Chromatogr. A. 443:85–96. 10.1016/S0021-9673(00)94785-X - DOI - PubMed
    1. Altfeld, M., Rosenberg E.S., Shankarappa R., Mukherjee J.S., Hecht F.M., Eldridge R.L., Addo M.M., Poon S.H., Phillips M.N., Robbins G.K., et al. . 2001. Cellular immune responses and viral diversity in individuals treated during acute and early HIV-1 infection. J. Exp. Med. 193:169–180. 10.1084/jem.193.2.169 - DOI - PMC - PubMed
    1. Anders, A.K., Call M.J., Schulze M.S.E.D., Fowler K.D., Schubert D.A., Seth N.P., Sundberg E.J., and Wucherpfennig K.W.. 2011. HLA-DM captures partially empty HLA-DR molecules for catalyzed removal of peptide. Nat. Immunol. 12:54–61. 10.1038/ni.1967 - DOI - PMC - PubMed

Publication types