. 2023 Apr 25;42(4):112393.
doi: 10.1016/j.celrep.2023.112393. Epub 2023 Apr 13.

Maternal diet alters long-term innate immune cell memory in fetal and juvenile hematopoietic stem and progenitor cells in nonhuman primate offspring

Affiliations

Maternal diet alters long-term innate immune cell memory in fetal and juvenile hematopoietic stem and progenitor cells in nonhuman primate offspring

Michael J Nash et al. Cell Rep. .

Abstract

Maternal overnutrition increases inflammatory and metabolic disease risk in postnatal offspring. This constitutes a major public health concern due to increasing prevalence of these diseases, yet mechanisms remain unclear. Here, using nonhuman primate models, we show that maternal Western-style diet (mWSD) exposure is associated with persistent pro-inflammatory phenotypes at the transcriptional, metabolic, and functional levels in bone marrow-derived macrophages (BMDMs) from 3-year-old juvenile offspring and in hematopoietic stem and progenitor cells (HSPCs) from fetal and juvenile bone marrow and fetal liver. mWSD exposure is also associated with increased oleic acid in fetal and juvenile bone marrow and fetal liver. Assay for transposase-accessible chromatin with sequencing (ATAC-seq) profiling of HSPCs and BMDMs from mWSD-exposed juveniles supports a model in which HSPCs transmit pro-inflammatory memory to myeloid cells beginning in utero. These findings show that maternal diet alters long-term immune cell developmental programming in HSPCs with proposed consequences for chronic diseases featuring altered immune/inflammatory activation across the lifespan.

Keywords: CP: Immunology; DoHaD; Western-style diet; epigenetics; fatty acid; glycolysis; hematopoiesis; inflammation; macrophage; obesity.


Conflict of interest statement

Declaration of interests The authors declare no competing interests.

Figures
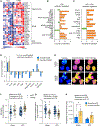
Figure 1.
Figure 1.. Juveniles exposed to mWSD have BMDMs with increased functional pro-inflammatory gene expression profiles
(A) Heatmap of DEGs from NanoString analysis classified as inflammatory, NF-κB-related, and anti-inflammatory pathways in unstimulated BMDMs. All genes shown are significantly different vs. mCD. Heatmap with genes grouped by functional category. One offspring per column. (B and C) Activation Z scores for upstream regulators derived from comparison of mCD- vs. mWSD-exposed BMDM gene expression response to LPS (B) and LPS + IFNγ (C). Orange bars indicate positive Z score and upregulation; green bars, negative Z score and downregulation. Pathways shown are significantly different between mCD vs. mWSD. (D) Activation Z-scores for predicted upstream regulators comparing unstimulated gene expression vs. IL-4-stimulated gene expression in mCD-exposed (blue) and mWSD-exposed (yellow) BMDMs. Upstream regulators shown are different (p < 0.05) in both mCD- and mWSD-exposed BMDMs. (E–G) FLIM maps of juvenile BMDMs (E). For FLIM intensity maps, red and yellow indicate higher intensity of fluorescence lifetimes and blue and green indicate lower intensity of fluorescence lifetimes. For NADH maps, yellow indicates free NADH and pink indicates bound NADH. For FAD maps, yellow indicates bound FAD and pink indicates free FAD. Glycolysis (F) and oxidative phosphorylation (G) in mCD- and mWSD-exposed BMDMs at baseline and in response to LPS stimulation. (F and G) Each dot represents one cell; 20–30 cells used per animal. (H) Phagocytosis of E. coli biospheres in BMDMs at baseline and in response to LPS. Data are mean ± SEM (F–H). p values for effect of mWSD, effect of LPS treatment, and interaction between mWSD and treatment were calculated by repeated measures two-way ANOVA with log-transformed data (F–H) and *p < 0.05, Fisher’s least significant difference (LSD) post-test comparison (H). n = 4–6 mCD, n = 3–7 mWSD.
Figure 2.
Figure 2.. Bone marrow HSPCs from juveniles exposed to mWSD have a pro-inflammatory metabolic and transcriptional phenotype
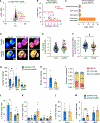
(A) Volcano plot of –Log(p value) and fold change (FC) of DEGs in mWSD- vs. mCD-exposed juvenile HSPCs. Key upregulated genes are highlighted in red. Gray circles indicate genes with p > 0.05. Black circles indicate genes with p < 0.05 in mWSD vs. mCD, regardless of whether they passed quality check measures and thus regardless of whether they featured in the 1,508 DEGs used for subsequent analyses. All genes highlighted in red passed quality check measures and were included in the 1,508 DEGs. n = 6 mCD, n = 6 mWSD. (B) Plot of IPA-derived canonical pathways from juvenile HSPC DEGs. Red dots indicate pathways of interest and gray dots indicate other pathways described in Table S3. (C) Highlighted pathways from DAVID analysis from juvenile HSPC DEGs. (D–F) FLIM map of juvenile bone marrow HSPCs (D). For FLIM intensity maps, red and yellow indicate higher intensity of fluorescence lifetimes and blue and green indicate lower intensity of fluorescence lifetimes. For NADH maps, yellow indicates free NADH and pink indicates bound NADH. For FAD maps, yellow indicates bound FAD and pink indicates free FAD. Glycolysis (E) and oxidative phosphorylation (F) in mCD- and mWSD-exposed bone marrow HSPCs. (E and F) Each dot represents one HSPC; 7–20 cells used per animal. (G–I) CFU assays of juvenile bone marrow MNCs. Colony count from mCD- and mWSD-exposed bone marrow MNCs (G). Total number of colonies grown from mCD- and mWSD-exposed bone marrow MNCs (H). Proportion of CFU-GEMM, CFU-GM, and BFU-E colonies (I). Proportion of colonies was calculated by dividing the total count for each colony type per animal by the total colony number per animal. These calculations were input as n = 1. n = 4 mCD, n = 5 mWSD. (J–M) Flow cytometry analysis of juvenile bone marrow MNCs. Juvenile CD71+ cells and CD20+ B cells as a percentage of total viable cells (J). Overall bone marrow CD11b+ myeloid cells and CD3+, CD4+, and CD8+ T cells as a percentage of total viable cells (K). CD38+ cells (L) and HSCs (CD34+CD38−CD45RA−CD90+) and MPPs (CD34+CD38−CD45RA−CD90−) (M) as a percentage of total viable CD34+ cells in mCD (blue) and mWSD (yellow) juveniles. n = 5–6 mCD, n = 5–7 mWSD. Data are mean ± SEM (E–M). *p < 0.05, **p < 0.01, ***p < 0.001, mWSD effect from repeated measures ANOVA with log-transformed data (E–F), unpaired Student’s t test (G–I), or Mann-Whitney U test (J–M).
Figure 3.
Figure 3.. Exposure to mWSD is associated with differentially accessible chromatin architecture in juvenile offspring, with bias toward expression pathways regulating inflammation and oxidative phosphorylation
(A) Volcano plot showing –Log(p value) and FC of DORs in mWSD- vs. mCD-exposed juvenile HSPCs. Key open (red) and closed (blue) loci are labeled. (B) GSEA of juvenile HSPC DORs. GSEA terms are shown, with select pathways bolded. (C) Volcano plot showing –Log(p value) and FC of DORs in mWSD- vs. mCD-exposed juvenile BMDMs. Key open (red) and closed (blue) loci are labeled. (D) Chromatin read maps of TNF and IL10. The y axis indicates ATAC-seq signal intensity (open chromatin). The entire gene body, including promotor region, for TNF and IL10 is shown. Transcription start site (TSS) is denoted by blue arrow. Length of promotor and gene is shown in kilobases (kb). Average reads for n = 5 juvenile mCDs and n = 5 juvenile mWSDs are shown. (E) IPA upstream regulator analysis from juvenile BMDM DORs. Red indicates a positive Z score and upregulation. Blue indicates a negative Z score and downregulation. Other pathways (gray) are described in Table S7. (F) Venn diagram showing distinct and overlapping DORs in juvenile mWSD- vs. mCD-exposed HSPCs and BMDMs. (G) GSEA pathway analysis of overlapping DORs. GSEA terms are shown, with select pathways bolded. (H) IPA analysis of overlapping DORs, with select upstream regulators bolded. n = 5 juvenile mCDs, n = 5 juvenile mWSDs.
Figure 4.
Figure 4.. RNA-seq analysis of fetal bone marrow HSPCs
(A) Volcano plot of –Log(p value) and FC of DEGs in mWSD- vs. mCD-exposed fetal HSPCs. Gray circles indicate genes with p > 0.05. Black circles indicate genes with p < 0.05 in mWSD vs. mCD, regardless of whether they passed quality check measures and thus regardless of whether they featured in the 199 DEGs used for subsequent analyses. (B) IPA upstream regulator analysis of DEGs in fetal HSPCs. Red indicates upstream regulators with a positive Z score and upregulation. Blue indicates upstream regulators with a negative Z score and downregulation. Other pathways (gray) are described in Table S11. (C) GSEA analysis of DEGs in fetal HSPCs. GSEA terms are shown, with select pathways bolded. (D) Venn diagram showing distinct and overlapping DEGs in fetal and juvenile bone marrow HSPCs. (E) GSEA pathway analysis of overlapping DEGs in HSPCs in mWSD-exposed fetuses and juveniles. GSEA terms are shown, with select pathways bolded. (F) IPA upstream regulator analysis of overlapping DEGs in HSPCs in mWSD-exposed fetuses and juveniles. Select upstream regulators are bolded. n = 5 fetal mCDs, n = 5 fetal mWSDs; n = 5 juvenile mCDs, n = 6 juvenile mWSDs.
Figure 5.
Figure 5.. Analysis of metabolic phenotype of fetal HSPCs and composition of bone marrow
(A–F) FLIM map of fetal HSPCs. FLIM map of fetal bone marrow HSPCs (A). For intensity in FLIM maps, red and yellow indicate higher intensity and blue and green indicate lower intensity of fluorescence lifetimes. For NADH maps, yellow indicates free NADH and pink indicates bound NADH. For FAD maps, yellow indicates bound FAD and pink indicates free FAD. Glycolytic index (B) and FLIRR (C) in mCD- and mWSD-exposed fetal bone marrow HSPCs. FLIM map of fetal liver HSPCs (D). Glycolytic index (E) and FLIRR (F) in mCD- and mWSD-exposed fetal liver HSPCs. (B, C, E, and F) Each dot represents one HSPC; 7–20 cells used per animal. (G–I) CFU assays of fetal bone marrow MNCs. Colony count from mCD- and mWSD-exposed fetal bone marrow MNCs (G). Total number of colonies grown from mCD and mWSD bone marrow MNCs (H). Proportion of CFU-GEMM, CFU-GM, and BFU-E colonies (I). Proportion of colonies was calculated by dividing the total count for each colony type per animal by the total colony number per animal. These calculations were input as n = 1. n = 4 mCDs, n = 3 mWSDs. (J–M) Flow cytometry analysis of fetal bone marrow MNCs. Fetal CD71+ cells and CD20+ B cells as a percentage of total viable cells (J). Overall CD11b+ myeloid cells and CD3+, CD4+, and CD8+ T cells as a percentage of total viable cells (K). CD38+ cells (L) and HSCs (CD34+CD38−CD45RA−CD90+) and MPPs (CD34+CD38−CD45RA−CD90−) (M) as a percentage of total viable CD34+ cells in mCD and mWSD. n = 5–9 mCDs, n = 5 mWSDs. Data are mean ± SEM (B, C, and E–M). *p < 0.05, **p < 0.01 mWSD effect from repeated measures ANOVA with log-transformed data (B, C, E, and F), unpaired Student’s t test (G–I), or Mann-Whitney U test (J–M).
Figure 6.
Figure 6.. Fetal bone marrow and liver MNCs from WSD-fed dams are associated with altered TCA small molecular and metabolic intermediates
(A) Enriched metabolic pathways from fetal bone marrow MNC top 25 VIP score metabolites. Red dots indicate pathways of interest and gray dots indicate other pathways. PE, phosphatidylethanolamine; PC, phosphatidylcholine. (B) Heatmap of metabolites associated with TCA cycle activity and glycolysis in mCD- vs. mWSD-exposed fetal bone marrow MNCs. (C) Heatmap of amino acids in mCD- vs. mWSD-exposed fetal bone marrow MNCs. (D) Enriched pathways from the top 25 VIP metabolites in fetal liver MNCs, red dots indicate pathways of interest, and gray dot indicates another pathway. (E) Heatmap of metabolites associated with TCA cycle activity, glycolysis, and amino acid metabolism in mCD- vs. mWSD-exposed fetal liver MNCs. (F) Heatmap of metabolites associated with β-oxidation in mCD- vs. mWSD-exposed fetal liver MNCs. One offspring per column (B, C, E, and F). n = 5 mCD, n = 5 mWSD bone marrow MNCs; n = 3 mCD, n = 4 mWSD liver MNCs.
Figure 7.
Figure 7.. mWSD exposure is associated with increased oleic acid concentration in offspring bone marrow and liver
(A) Concentration of oleic acid and linolenic acid in fetal bone marrow. (B) Concentration of oleic acid and linolenic acid in fetal liver. (C) Concentration of oleic acid and linolenic acid in juvenile bone marrow. (D) Mean cross-sectional surface area of adipocytes in juvenile bone marrow. (E) Adipocyte number per micrometer squared in juvenile bone marrow. (F) Representative images of juvenile bone marrow adipocytes. Asterisk (*) indicates adipocyte. Data are mean ± SEM. *p < 0.05, **p < 0.01, unpaired Student’s t test (A–E). n = 6–7 fetal mCDs, n = 4–5 fetal mWSDs; n = 8 juvenile mCDs, n = 7 juvenile mWSDs (A–C). n = 4 juvenile mCDs, n = 4 juvenile mWSDs (D and E).

References

    1. Brumbaugh DE, and Friedman JE (2014). Developmental origins of nonalcoholic fatty liver disease. Pediatr. Res 75, 140–147. 10.1038/pr.2013.193. - DOI - PMC - PubMed
    1. Godfrey KM, Reynolds RM, Prescott SL, Nyirenda M, Jaddoe VWV, Eriksson JG, and Broekman BFP (2017). Influence of maternal obesity on the long-term health of offspring. Lancet Diabetes Endocrinol 5, 53–64. 10.1016/s2213-8587(16)30107-3. - DOI - PMC - PubMed
    1. Harris RA, Alcott CE, Sullivan EL, Takahashi D, McCurdy CE, Comstock S, Baquero K, Blundell P, Frias AE, Kahr M, et al. (2016). Genomic variants associated with resistance to high fat diet induced obesity in a primate model. Sci. Rep 6, 36123. 10.1038/srep36123. - DOI - PMC - PubMed
    1. Inzani I, and Ozanne SE (2022). Programming by maternal obesity: a pathway to poor cardiometabolic health in the offspring. Proc. Nutr. Soc 81, 227–242. 10.1017/s0029665122001914. - DOI - PMC - PubMed
    1. Kahr MK, Antony KM, DelBeccaro M, Hu M, Aagaard KM, and Suter MA (2016). Increasing maternal obesity is associated with alterations in both maternal and neonatal thyroid hormone levels. Clin. Endocrinol 84, 551–557. 10.1111/cen.12974. - DOI - PMC - PubMed

Publication types