. 2023 Apr 25;42(4):112392.
doi: 10.1016/j.celrep.2023.112392. Epub 2023 Apr 13.

Exercise training remodels inguinal white adipose tissue through adaptations in innervation, vascularization, and the extracellular matrix

Affiliations

Exercise training remodels inguinal white adipose tissue through adaptations in innervation, vascularization, and the extracellular matrix

Pasquale Nigro et al. Cell Rep. .

Abstract

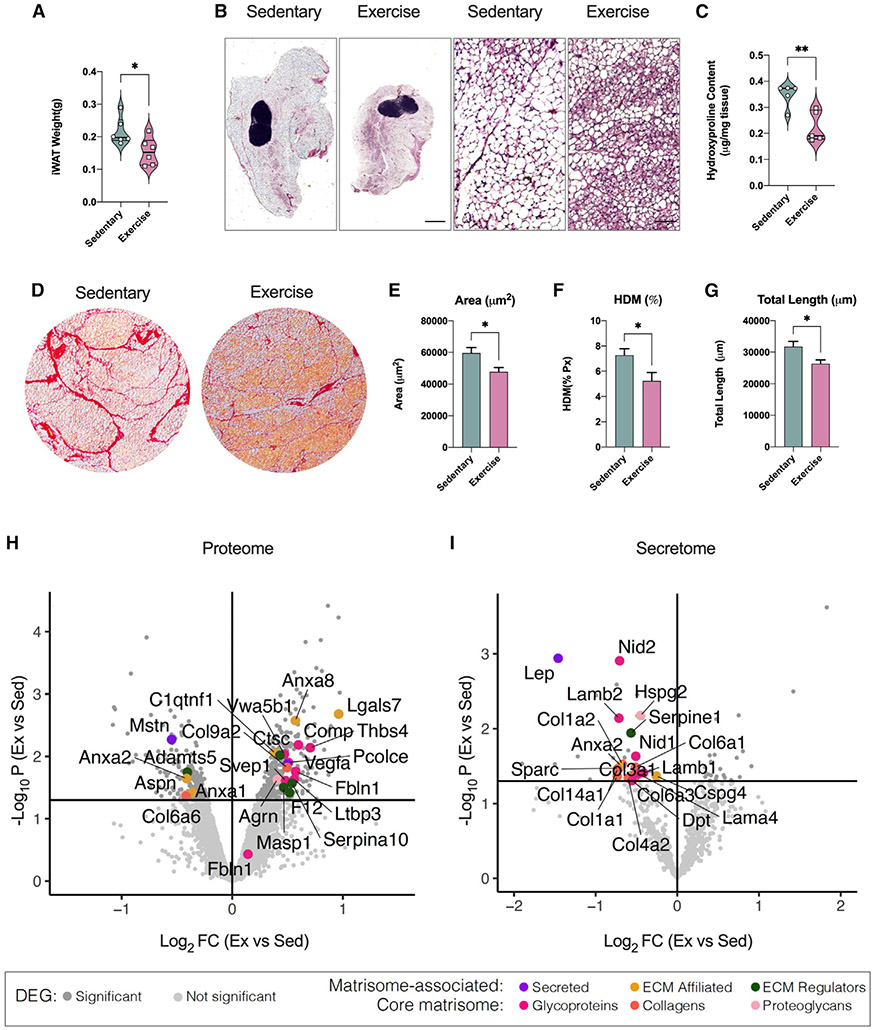
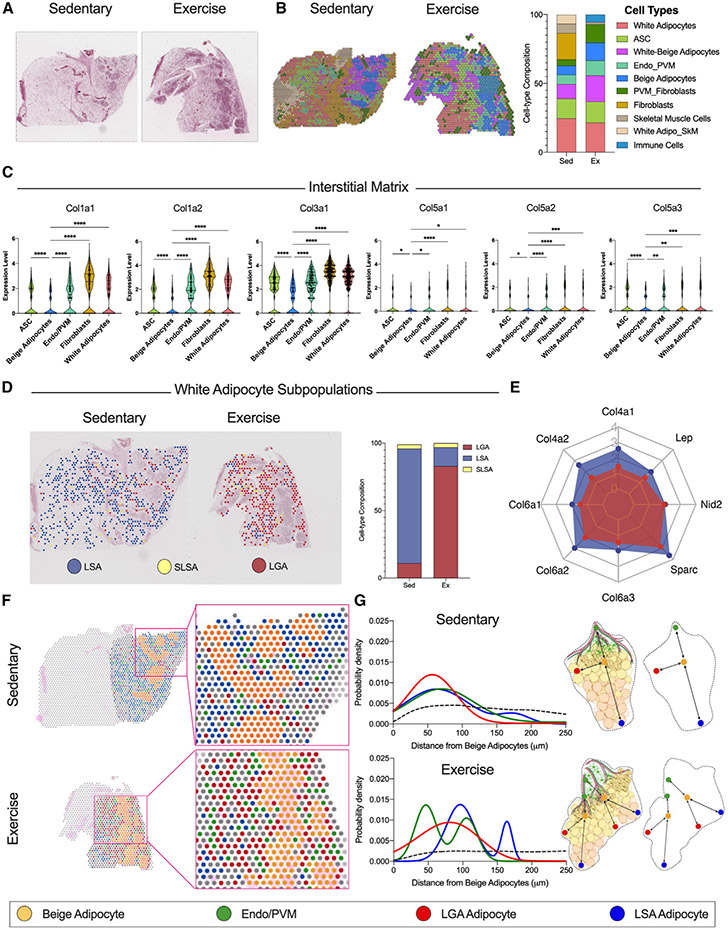
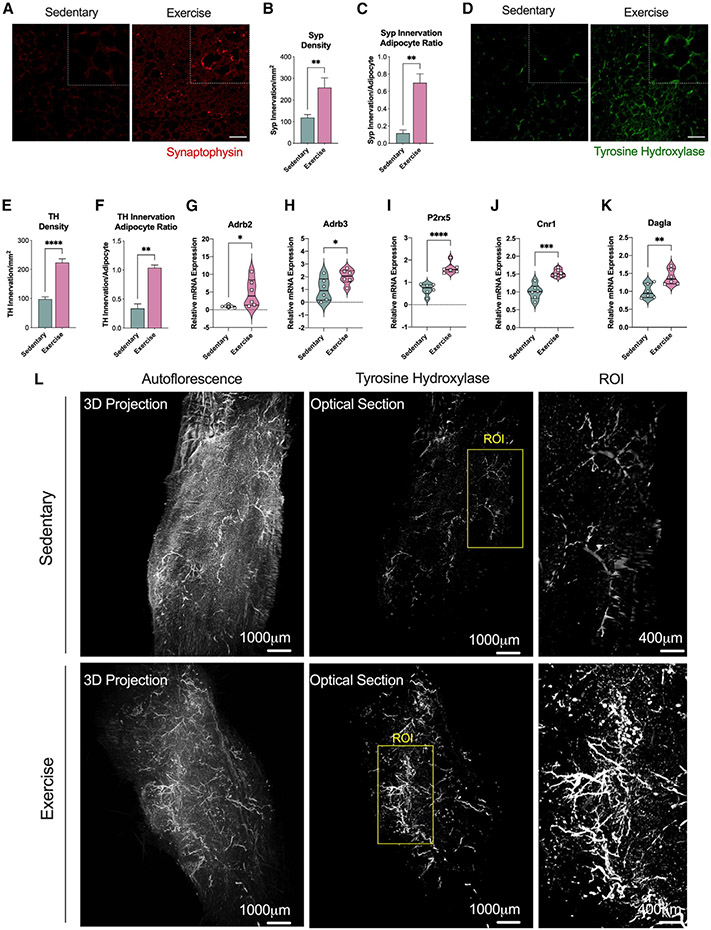
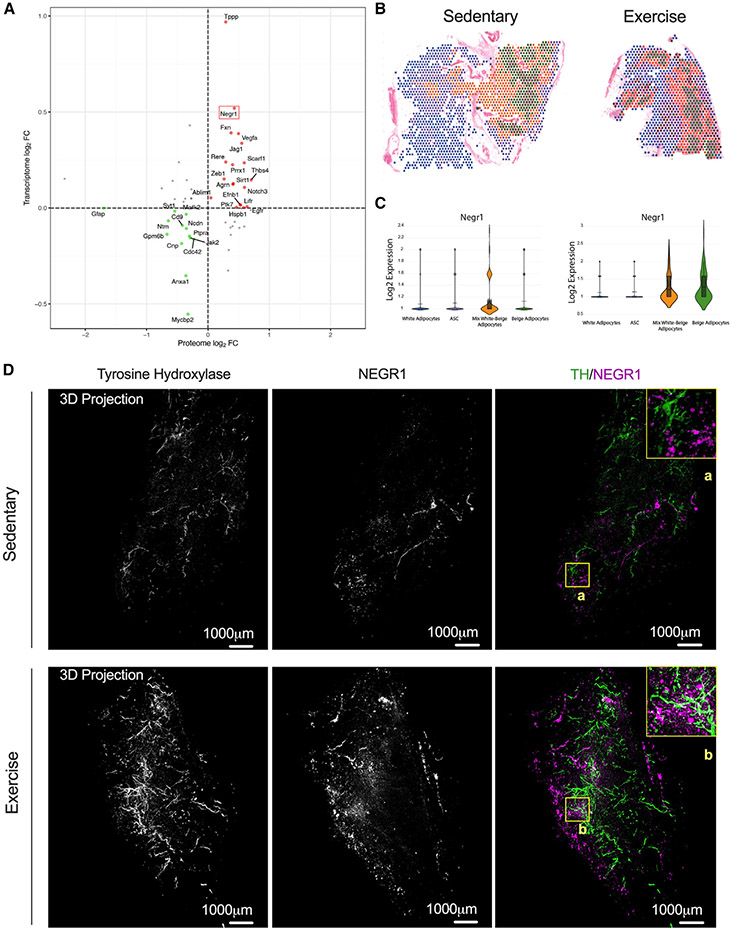
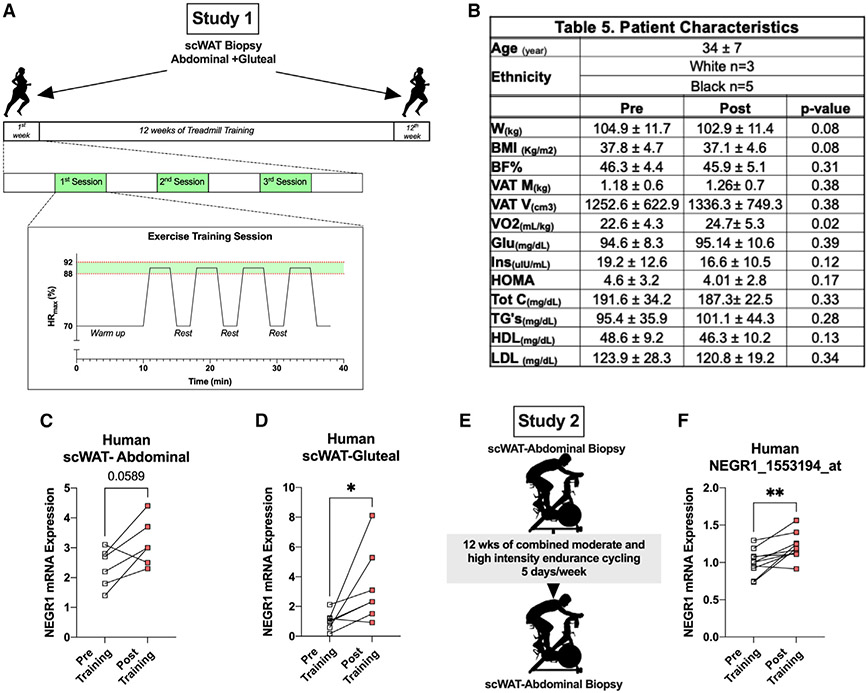
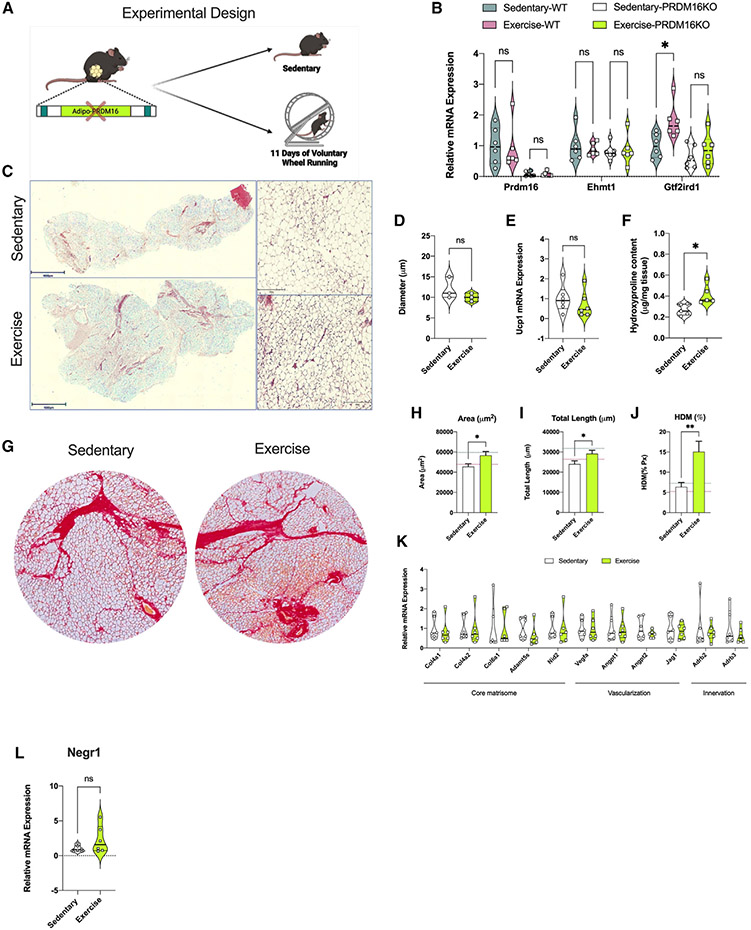
Inguinal white adipose tissue (iWAT) is essential for the beneficial effects of exercise training on metabolic health. The underlying mechanisms for these effects are not fully understood, and here, we test the hypothesis that exercise training results in a more favorable iWAT structural phenotype. Using biochemical, imaging, and multi-omics analyses, we find that 11 days of wheel running in male mice causes profound iWAT remodeling including decreased extracellular matrix (ECM) deposition and increased vascularization and innervation. We identify adipose stem cells as one of the main contributors to training-induced ECM remodeling, show that the PRDM16 transcriptional complex is necessary for iWAT remodeling and beiging, and discover neuronal growth regulator 1 (NEGR1) as a link between PRDM16 and neuritogenesis. Moreover, we find that training causes a shift from hypertrophic to insulin-sensitive adipocyte subpopulations. Exercise training leads to remarkable adaptations to iWAT structure and cell-type composition that can confer beneficial changes in tissue metabolism.

Keywords: Adipo-Clear; CP: Metabolism; CP: Molecular biology; ECM; NEGR1; PRDM16; exercise; innervation; proteomics; spatial transcriptomics; vascularization; white adipose tissue.


Conflict of interest statement

Declaration of interests The authors declare no competing interests.

Figures

Figure 1.
Figure 1.. Exercise training reduced ECM deposition in iWAT, modulating matrisome-associated and core matrisome gene expression levels
(A) iWAT mass of male sedentary and trained mice (n = 6/group). (B) H&E staining images of iWAT from sedentary and trained mice. Scale bar, 1,000 μm (4×) and 50 μm (20×). (C) Hydroxyproline content in iWAT from sedentary and trained mice (n = 5/group). (D) Sirius red staining images of iWAT from sedentary and trained mice. Scale bar, 100 μm (10×). (E–G) Quantification of ECM deposition area (E), percentage of high-density matrix (HDM),. (F), and total length of fibers (G) in iWAT (n = 4/group; calculated from 8 fields/mouse). (H) Up- and down-regulated proteins with exercise training detected in iWAT (iWAT proteome analysis). Lines define restriction of log2 fold change (FC) value of 0.5 and −log10 of p value 0.01. Significant proteins are colored based on matrisome subcategories. (I) Up- and down-regulated proteins with exercise detected in iWAT conditioned media (secretome analysis). Lines define restriction of log2 FC value of 0.5 and −log10 of p value 0.01. Significant proteins are colored based on matrisome subcategories. Data are presented as mean ± SEM and were compared using unpaired two-tailed Student’s t test. *p < 0.05, and **p < 0.01.
Figure 2.
Figure 2.. Spatial and single-cell transcriptomics identifies main contributors of ECM in iWAT
(A and B) H&E-stained sections (A) and relative spatial RNA sequencing (RNA-seq) barcoded spot. Scale bar, 2 mm, (B) indicating the cell clusters detected in iWAT from sedentary (left) and exercise (right) mice. (C) Expression level for interstitial matrix collagens species across 5 selected cell-type clusters. (D) Spatial distribution maps showing the three white adipocyte subpopulations, LSAs, SLSAs, and LGAs, detected in iWAT from sedentary (left) and exercise (right) mice along with the relative proportion plot. (E) Basement membrane components gene expression level in LSAs and LGAs. The gene expression level is presented as a scale ranging from zero to four, where four represents the highest expression level. (F) Spatial distribution maps and relative magnifications showing the selected cell-type clusters in iWAT from sedentary (top) and exercise (bottom) mice: beige adipocyte (yellow), endothelial and perivascular microglia cell (Endo/PVM) (green), LGA (red), and LSA (blue) white adipocyte subpopulations. (G) Probability density distribution plots showing the distance relative to the beige adipocyte for the LGA, LSA, and Endo/PVM clusters in iWAT from sedentary (top) and exercise (bottom) mice. Dashed black lines indicate the random distribution among the clusters. Summary cartoon explaining the pattern distribution. Data are presented as mean ± SEM and were compared using one-way ANOVA. *p < 0.05, **p < 0.01, ***p < 0.001, and ****p < 0.0001
Figure 3.
Figure 3.. Exercise training increased innervation of iWAT
(A) Immunofluorescence staining images of iWAT for the pan-innervation marker synaptophysin. Scale bar, 50 μm. (B and C) Synaptophysin density (B) and synaptophysin innervation per adipocyte ratio (C) in iWAT from sedentary and trained mice (n = 6/group; calculated from 10 fields/mouse). (D) Immunofluorescence staining images of iWAT for the sympathetic innervation marker TH. Scale bar, 50 μm. (E and F) TH density (E) and TH innervation per adipocyte ratio (F) in iWAT from sedentary and trained mice (n = 6/group; calculated from 10 fields/mouse). (G–K) mRNA expression of innervation markers Adrb2 (G), Adrb3 (H), P2rx5 (I), Cnr1 (J), and Dagla (K) in iWAT from sedentary and trained mice (n = 6/group). (L) Whole-tissue images of iWAT from sedentary (top) and trained (bottom) mice immunolabeled with TH. Maximum intensity projection from a 1,000 μm z stack and high-magnification view of the region of interest (ROI) are shown. Data are presented as mean ± SEM and were compared using unpaired two-tailed Student’s t test. *p < 0.05, **p < 0.01, ***p < 0.001, and ****p < 0.0001.
Figure 4.
Figure 4.. NEGR1 is a cell adhesion molecule induced by exercise training in iWAT
(A) Correlation of RNA and protein expression in iWAT after 11 days of exercise. Negr1 is highlighted with a red box. (B and C) Visium images (B) and relative individual violin plots (C) showing the Negr1 expression level across the cell clusters detected in iWAT from sedentary (left) and exercise (right). (D) Whole-tissue images of iWAT from sedentary (top) and trained (bottom) mice immunolabeled with TH (green) and NEGR1 (magenta). Maximum intensity projection from a 1,000 μm z stack and high-magnification view of ROI are shown (A and B).
Figure 5.
Figure 5.. NEGR1 increased with exercise training in human subcutaneous WAT (scWAT)
(A) Study design to collect scWAT biopsies from obese women (n = 6/8) pre- and post-treadmill exercise training. (B) Patient characteristics. (C and D) mRNA expression of NEGR1 in abdominal (C) and gluteal (D) scWAT pre- and post-exercise (n = 6). (E) Study design to collect abdominal scWAT biopsies from lean men (n = 10) pre- and post-moderate-intensity endurance cycling exercise. (F) mRNA expression of NEGR1 in abdominal scWAT pre- and post-exercise training (n = 10) from the microarray dataset GEO: GSE116801. Data are presented as mean ± SEM and were compared using paired Student’s test and two-way ANOVA followed by Tukey’s multiple comparisons t test. *p < 0.05 and **p < 0.01.
Figure 6.
Figure 6.. PRDM16 transcriptional complex mediated exercise-induced iWAT remodeling
(A) Study design used for the PRDM16KO mice (n = 6/group). (B) mRNA expression of the PRDM16 transcriptional complex genes Prdm16, Ehmt1, and Gtf2ird1 in iWAT from sedentary and trained wild-type (WT) and PRDM16KO mice (n = 6/group). (C and D) H&E staining images (C) of iWAT from sedentary and trained mice with adipocyte cell size measurement (D) (n = 3/group; calculated from 10 fields/ mouse). Scale bar, 500 μm (4×) and 50 μm (20×), respectively. (E) mRNA expression of Ucp1 in iWAT from sedentary and trained PRDM16KO mice (n = 6/group). (F) Hydroxyproline content in iWAT from sedentary and trained PRDM16KO mice (n = 5/group). (G) Sirius red staining images of iWAT from sedentary (left) and trained (right) PRDM16KO mice. Scale bar, 100 μm (10×). (H–J) ECM deposition area (H), total length of fibers (I), and percentage of HDM (J) in iWAT of sedentary and trained PRDM16KO mice (n = 4/group; calculated from 8 fields/mouse). (K) mRNA expression level for core matrisome, vascularization, and innervation markers in iWAT of sedentary and trained PRDM16KO mice (n = 6/group). (L) mRNA expression of Negr1 in iWAT from sedentary and trained PRDM16KO mice (n = 6/group). Data are presented as mean ± SEM and were compared using unpaired two-tailed Student’s t test and two-way ANOVA followed by Tukey’s multiple comparisons test. *p < 0.05 and **p < 0.01.

References

    1. Li S, Gao H, Hasegawa Y, and Lu X (2021). Mini-Review: fight against fibrosis in adipose tissue remodeling. Am. J. Physiol. Endocrinol. Metab 321, E169–E175. 10.1152/ajpendo.00558.2020. - DOI - PMC - PubMed
    1. Ruiz-Ojeda FJ, Méndez-Gutiérrez A, Aguilera CM, and Plaza-Díaz J (2019). Extracellular matrix remodeling of adipose tissue in obesity and metabolic diseases. Int. J. Mol. Sci 20, 4888. 10.3390/ijms20194888. - DOI - PMC - PubMed
    1. Stanford KI, Middelbeek RJW, Townsend KL, Lee M-Y, Takahashi H, So K, Hitchcox KM, Markan KR, Hellbach K, Hirshman MF, et al. (2015). A novel role for subcutaneous adipose tissue in exercise-induced improvements in glucose homeostasis. Diabetes 64, 2002–2014. - PMC - PubMed
    1. Nigro P, Middelbeek RJW, Alves CRR, Rovira-Llopis S, Ramachandran K, Rowland LA, Møller AB, Takahashi H, Alves-Wagner AB, Vamvini M, et al. (2021). Exercise training promotes sex-specific adaptations in mouse inguinal white adipose tissue. Diabetes 70, 1250–1264. 10.2337/db20-0790. - DOI - PMC - PubMed
    1. Takahashi H, Alves CRR, Stanford KI, Middelbeek RJW, Nigro P, Ryan RE, Xue R, Sakaguchi M, Lynes MD, So K, et al. (2019). TGF-β2 is an exercise-induced adipokine that regulates glucose and fatty acid metabolism. Nat. Metab 1, 291–303. - PMC - PubMed

Publication types

Substances