. 2023 Jul 1;72(7):958-972.
doi: 10.2337/db22-0654.

Regulation of Monocyte Activation by PPARα Through Interaction With the cGAS-STING Pathway

Affiliations

Regulation of Monocyte Activation by PPARα Through Interaction With the cGAS-STING Pathway

Lijie Dong et al. Diabetes. .

Abstract

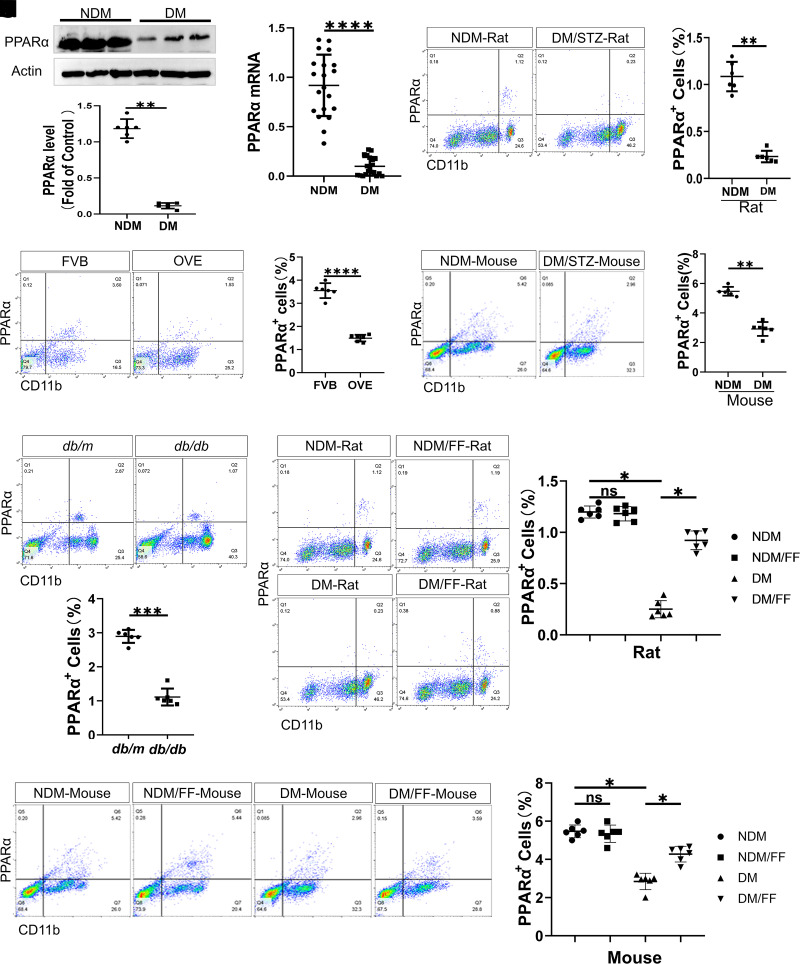
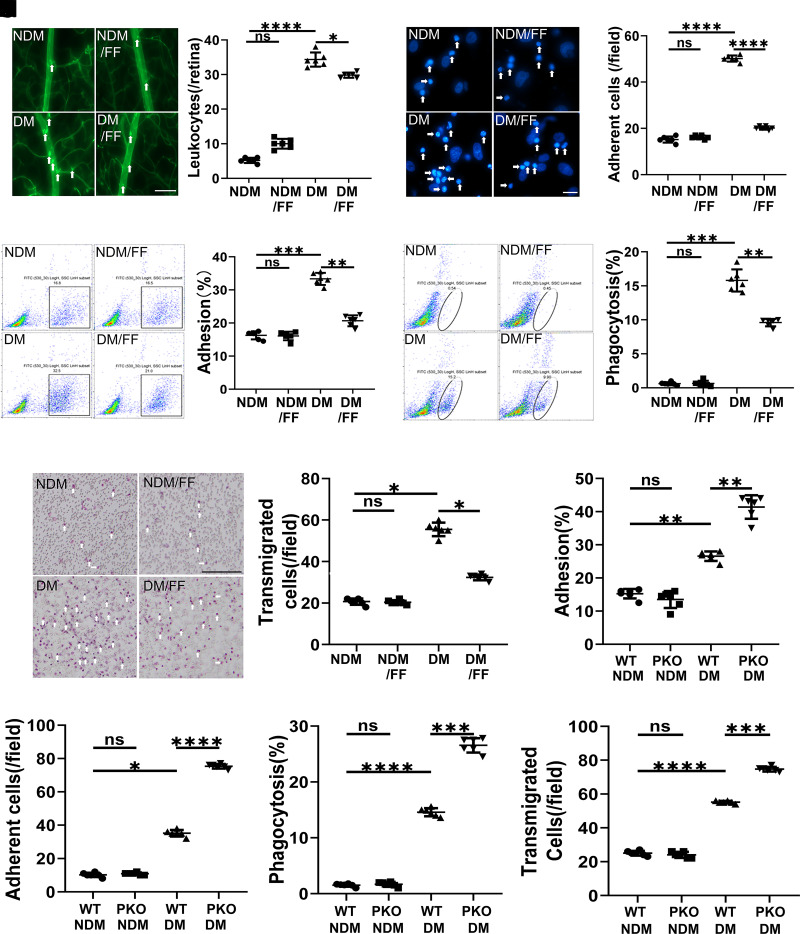
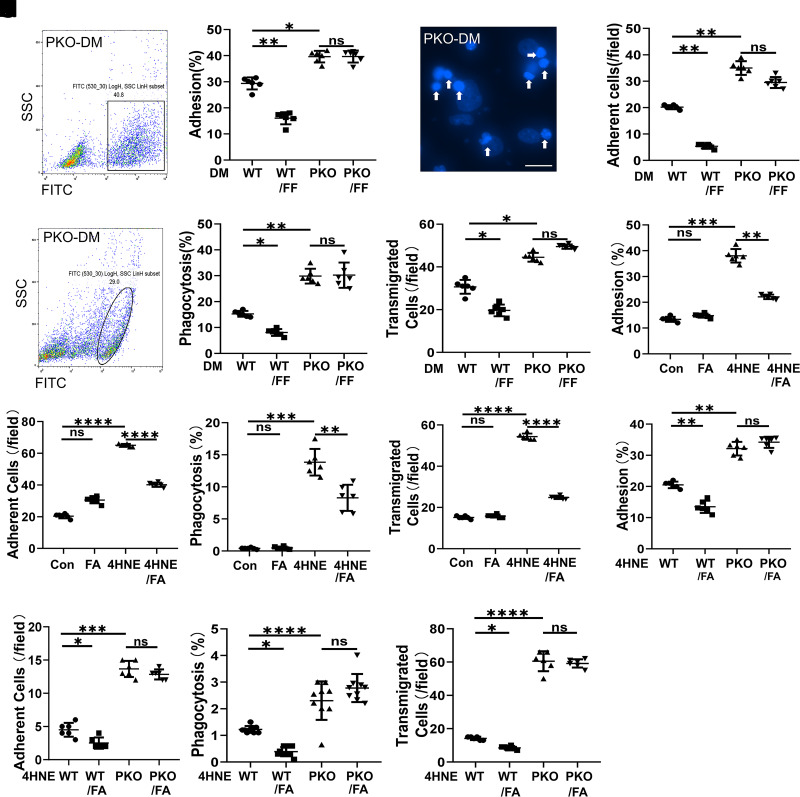
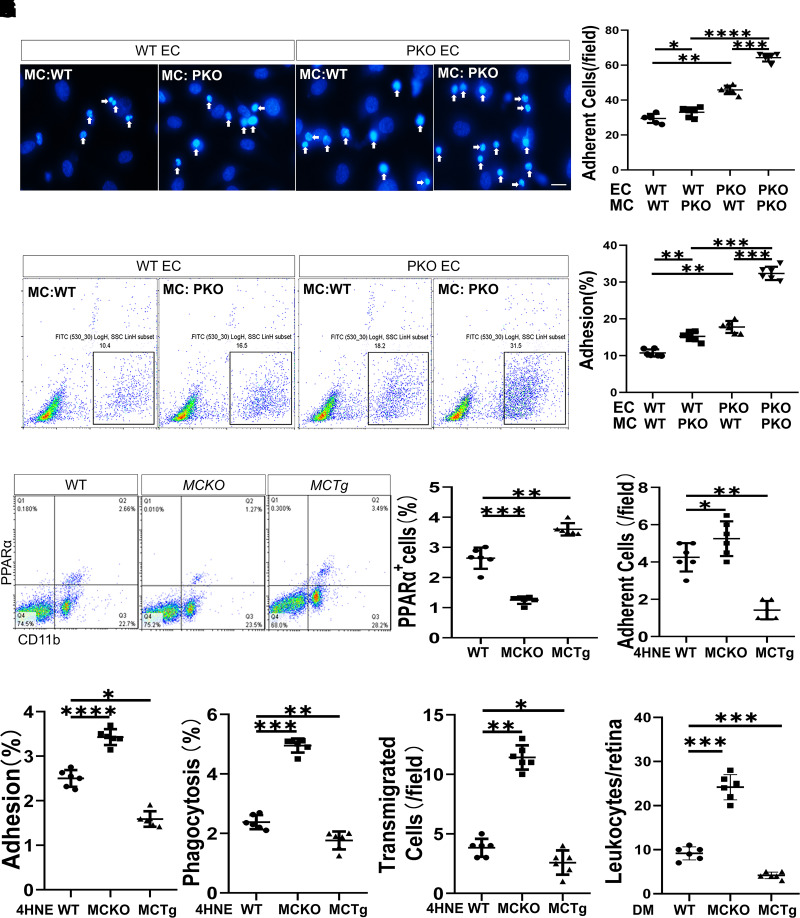
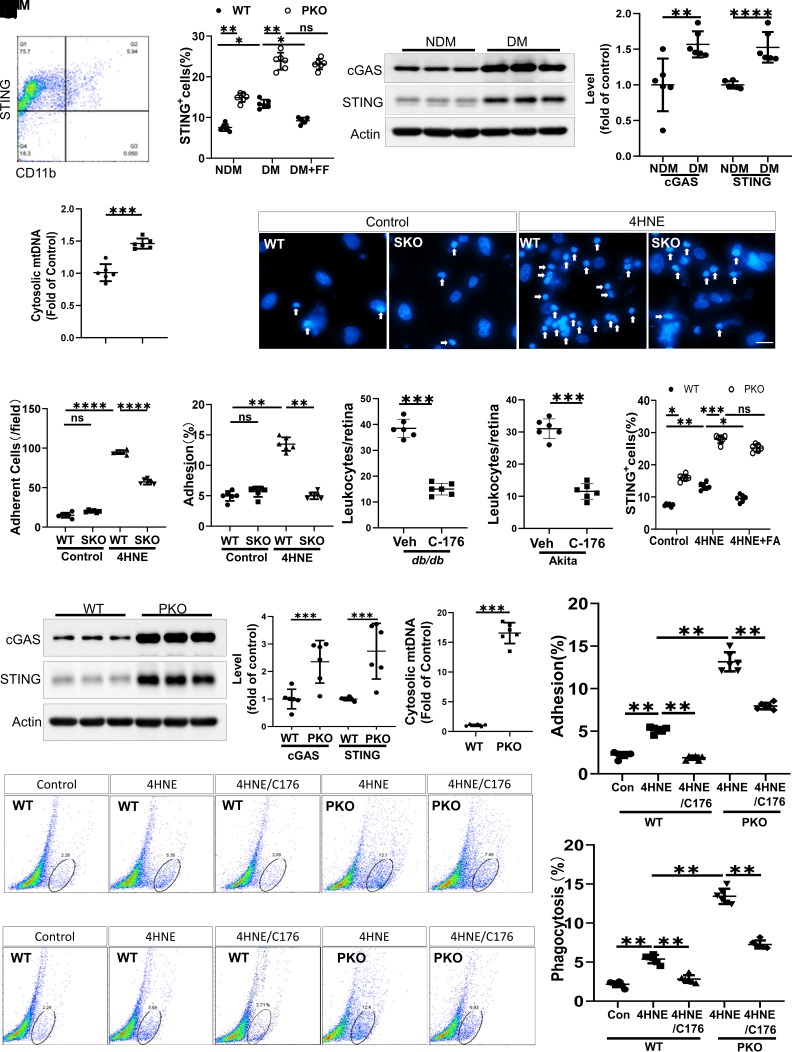
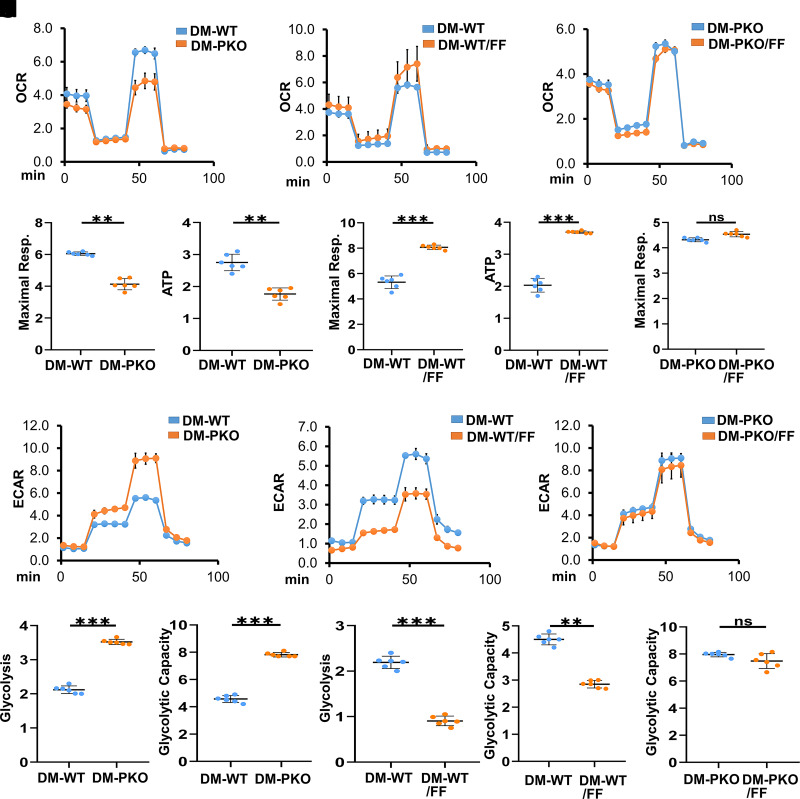
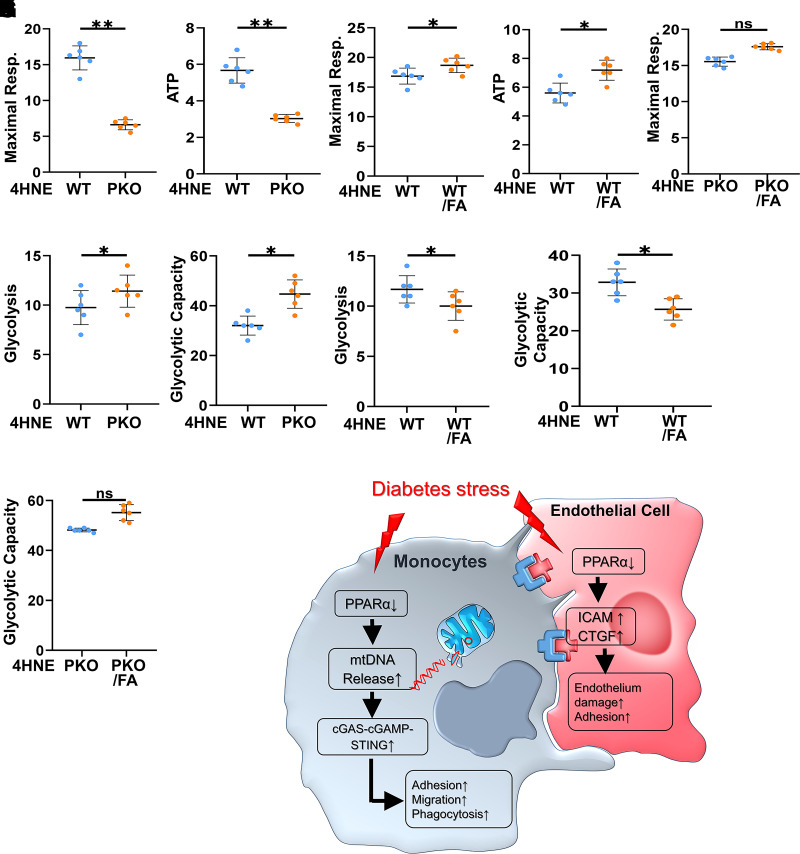
Monocyte activation plays an important role in diabetic complications such as diabetic retinopathy (DR). However, the regulation of monocyte activation in diabetes remains elusive. Fenofibrate, an agonist of peroxisome proliferator-activated receptor-α (PPARα), has shown robust therapeutic effects on DR in patients with type 2 diabetes. Here we found that PPARα levels were significantly downregulated in monocytes from patients with diabetes and animal models, correlating with monocyte activation. Fenofibrate attenuated monocyte activation in diabetes, while PPARα knockout alone induced monocyte activation. Furthermore, monocyte-specific PPARα overexpression ameliorated, while monocyte-specific PPARα knockout aggravated monocyte activation in diabetes. PPARα knockout impaired mitochondrial function while also increasing glycolysis in monocytes. PPARα knockout increased cytosolic mitochondrial DNA release and activation of the cyclic GMP-AMP synthase (cGAS)-stimulator of interferon genes (STING) pathway in monocytes under diabetic conditions. STING knockout or STING inhibitor attenuated monocyte activation induced by diabetes or by PPARα knockout. These observations suggest that PPARα negatively regulates monocyte activation through metabolic reprogramming and interaction with the cGAS-STING pathway.


Conflict of interest statement

Duality of Interest. No potential conflicts of interest relevant to this article were reported.

Figures

Figure 1
Figure 1
Decreased PPARα in monocytes from patients with diabetes and animal models. A: A representative Western blot of PPARα in monocytes from patients with diabetes (DM) and without diabetes (NDM) (n = 6). B: PPARα levels were quantified by densitometry and normalized by actin levels. C: PPARα mRNA levels were measured by qRT-PCR in monocytes from patients with diabetes and normalized with HPRT (n = 20). Representative flow cytometry plots and quantification of PPARα+ monocytes (CD11b+/PPARα+ cells) in diabetic rats (DM/STZ-Rat, 6 months of diabetes) (D and E), OVE26 mice (OVE) at 6 months of age in FVB background (F and G), C57BL/6J mice with 8 weeks of STZ-induced diabetes (DM/STZ-Mouse) (H and I), and 6-month-old db/db mice (J and K). Representative flow cytometry plots of STZ-induced diabetic rats (L) and mice treated with chow containing fenofibrate (FF) (N), and quantification of PPARα+ cells from the rats (M) and mice (O). Data are mean ± SD (n = 6). *P < 0.05; **P < 0.01; ***P < 0.001; ****P < 0.0001; ns, no significant difference.
Figure 2
Figure 2
Attenuated monocyte adhesion and migration by fenofibrate in STZ-induced diabetic mice. Nondiabetic mice (NDM) and STZ-induced diabetic mice (DM) were fed chow containing 0.014% fenofibrate (FF) for 12 weeks, with regular chow as the control. A: Representative images of FITC-ConA–labeled adherent leukocytes in retinal vessels (indicated by arrows). Scale bar = 100 µm. B: Quantification of adherent leukocytes in the retina. CF: PBMCs were isolated and labeled with BCECF-AM and then cocultured with an HRCEC monolayer. After thorough washes, the attached monocytes were analyzed by DAPI staining (C and D) or flow cytometry analysis (E and F). SSC, side scatter. Scale bar = 20 μm. G and H: PBMCs were fed with FITC–dextran-70, and cells with phagocytosis were quantified by flow cytometry. I and J: The cells were cultured in Transwell with a 3.0-µm pore membrane insert. The cells that penetrated through the membrane were stained with hematoxylin-eosin and quantified. Scale bar = 100 μm. KN: PBMCs were isolated from WT and PPARα−/− (PKO) mice with 8 weeks of STZ-induced diabetes (DM) and their age-matched nondiabetic mice (NDM). PBMCs were labeled with BCECF-AM, and monocytes adherent to HRCECs were analyzed by flow cytometry (K) or DAPI staining (L). M: Phagocytosis was examined by flow cytometry after the cells were incubated with FITC–dextran-70. N: Cell migration was quantified using the Transwell assay. All values are mean ± SD (n = 6). *P < 0.05; **P < 0.01; ***P < 0.001; ****P < 0.0001; ns, no significant difference.
Figure 3
Figure 3
The impact of fenofibrate on monocyte activation is PPARα dependent. AD: STZ-induced diabetic (WT) and PPARα−/− (PKO) mice were fed fenofibrate (FF) chow for 12 weeks. Monocytes adherent to HRCECs were analyzed by flow cytometry (A and B) and by DAPI staining (C and D). SSC, side scatter. Scale bar = 20 μm. E and F: Phagocytosis was examined by flow cytometry after the cells were incubated with FITC–dextran-70. G: Cell migration was quantified using the Transwell assay. HK: PBMCs were treated with FA in the presence and absence of 4HNE (10 μmol/L) for 6 h. BCECF-AM–labeled monocytes adherent to HRCECs were analyzed by flow cytometry (H) and cell counting under a fluorescent microscope (I). J: The cells were fed FITC–dextran-70, and phagocytosis was quantified by flow cytometry. K: Cell migration was quantified using the Transwell assay. LO: PBMCs from WT and PPARα−/− (PKO) mice were treated with FA in the presence and absence of 4HNE for 6 h. BCECF-AM–labeled monocytes adherent to HRCECs were analyzed and quantified using flow cytometry (L) and cell counting under a microscope (M). N: The cells were fed FITC–dextran-70, and phagocytosis was quantified by flow cytometry. O: Transmigrated monocytes were quantified. All values are mean ± SD (n = 6). *P < 0.05; **P < 0.01; ***P < 0.001; ****P < 0.0001; ns, no significant difference.
Figure 4
Figure 4
Impacts of PPARα deficiency in ECs and monocytes (MCs) on adhesion. PBMCs and primary brain ECs were isolated from age-matched WT and PPARα−/− (PKO) mice. BCECF-AM–labeled WT and PKO MCs were incubated with WT and PPARα−/− ECs. Monocytes adherent to ECs were quantified by cell count (A and B) and flow cytometry (C and D). SSC, side scatter. Scale bar = 20 μm. EJ: PBMCs isolated from PPARαMCKO (MCKO), PPARαMCTg (MCTg), and WT mice were immunostained for PPARα and the monocyte marker CD11b-BV510. E and F: PPARα levels in monocytes were analyzed by flow cytometry. After exposure to 10 μmol/L 4HNE for 6 h, monocytes adherent to ECs were quantified using cell counting (G) or flow cytometry (H). I: Monocyte phagocytosis was analyzed by flow cytometry. J: Monocyte migration was quantified using the Transwell assay. K: Adherent leukocytes in retinal vessels were labeled by FITC-ConA. The leukocyte numbers were quantified and compared between diabetic (DM) WT, PPARαMCKO, and PPARαMCTg mice at 12 weeks after the diabetic onset. All values are mean ± SD (n = 6). *P < 0.05; **P < 0.01; ***P < 0.001; ****P < 0.0001.
Figure 5
Figure 5
PPARα KO aggravated STING activation in diabetic monocytes. STZ-induced diabetic WT and PPARα−/− (PKO) mice were fed chow containing 0.014% fenofibrate for 12 weeks. A: The representative image of CD11b+/STING+ cells (STING+ cells) analyzed by flow cytometry. B: STING expression in monocytes was analyzed by flow cytometry. DM, diabetes; NDM, no diabetes. C and D: cGAS and STING levels were measured using Western blot analysis in the isolated monocytes. E: Levels of cytosolic mtDNA were measured by qRT-PCR in monocytes. Adhesion of monocytes of WT and STING−/− (SKO) mice to HRCECs was analyzed by DAPI staining (F and G) and by flow cytometry analysis (H). Scale bar = 20 μm. Quantification of adherent leukocytes in the retina vasculature of db/db (I) and Akita (J) mice treated with C-176. Veh., vehicle control. K: The STING-positive cells in 4HNE-treated WT and PKO monocytes with/without FA were quantified by flow cytometry. L and M: Monocytic cGAS and STING levels were measured using Western blot analysis. N: Levels of cytosolic mtDNA were measured by qRT-PCR in isolated monocytes. O–R: PBMCs isolated from WT and PKO mice were treated with C-176 and 4HNE, labeled with BCECF-AM, and then cocultured with an HRCEC monolayer. O and P: The adherent monocytes were analyzed by flow cytometry. Q and R: The cells were fed with FITC–dextran-70, and phagocytosis was quantified by flow cytometry. All values are mean ± SD (n = 6). *P < 0.05; **P < 0.01; ***P < 0.001; ****P < 0.0001; ns, no significant difference.
Figure 6
Figure 6
Decreased mitochondrial oxidation and increased glycolysis in monocytes from diabetic PPARα−/− mice. Monocytes isolated from diabetic (DM-WT) and diabetic PPARα−/− (DM-PKO) mice, with or without fenofibrate (FF) chow, were used for mitochondrial and glycolytic assays using a Seahorse XFe96 Analyzer. The data were normalized by cell numbers. AH: OCR (pmol/min/1,000 cells): representative traces of OCR (AC) and quantification of maximal respiration rate and ATP production (DH). Resp., respiration rate. Glycolysis: representative traces of extracellular acidification rate (ECAR; mpH/min/1,000 cells) (IK), and glycolysis and glycolytic capacity (LP). All values are mean ± SD (n = 6). **P < 0.01; ***P < 0.001; ns, no significant difference.
Figure 7
Figure 7
Decreased mitochondrial oxidation and increased glycolysis in PPARα−/− monocytes exposed to 4HNE. Monocytes were isolated from PPARα−/− mice (PKO) and WT littermates. The cells were exposed to 4HNE, with and without FA, for 6 h and then used for assays of mitochondrial oxidation and glycolysis. AE: Maximal respiration (Resp.) rate and ATP production (pmol/min/1,000 cells). FJ: Glycolysis and glycolytic capacity (mpH/min/1,000 cells). All values are mean ± SD (n = 6). *P < 0.05; **P < 0.01; ns, no significant difference. K: Hypothesized mechanism for cGAS-STING signaling activation and monocyte adhesion by PPARα downregulation in diabetes. CTGF, connective tissue growth factor; ICAM, intracellular adhesion molecule.

Similar articles

Cited by

References

    1. Mesquida M, Drawnel F, Fauser S. The role of inflammation in diabetic eye disease. Semin Immunopathol 2019;41:427–445 - PubMed
    1. Forrester JV, Kuffova L, Delibegovic M. The role of inflammation in diabetic retinopathy. Front Immunol 2020;11:583687. - PMC - PubMed
    1. Binet F, Cagnone G, Crespo-Garcia S, et al. . Neutrophil extracellular traps target senescent vasculature for tissue remodeling in retinopathy. Science 2020;369:eaay5356. - PubMed
    1. Rezzola S, Corsini M, Chiodelli P, et al. . Inflammation and N-formyl peptide receptors mediate the angiogenic activity of human vitreous humour in proliferative diabetic retinopathy. Diabetologia 2017;60:719–728 - PubMed
    1. Liu Y, Shen J, Fortmann SD, Wang J, Vestweber D, Campochiaro PA. Reversible retinal vessel closure from VEGF-induced leukocyte plugging. JCI Insight 2017;2:e95530. - PMC - PubMed

Publication types

MeSH terms