. 2023 Apr;131(4):47010.
doi: 10.1289/EHP10959. Epub 2023 Apr 14.

Associations between Aircraft Noise Exposure and Self-Reported Sleep Duration and Quality in the United States-Based Prospective Nurses' Health Study Cohort

Affiliations

Associations between Aircraft Noise Exposure and Self-Reported Sleep Duration and Quality in the United States-Based Prospective Nurses' Health Study Cohort

Matthew Bozigar et al. Environ Health Perspect. 2023 Apr.

Abstract

Background: Sleep disruption is linked with chronic disease, and aircraft noise can disrupt sleep. However, there are few investigations of aircraft noise and sleep in large cohorts.

Objectives: We examined associations between aircraft noise and self-reported sleep duration and quality in the Nurses' Health Study, a large prospective cohort.

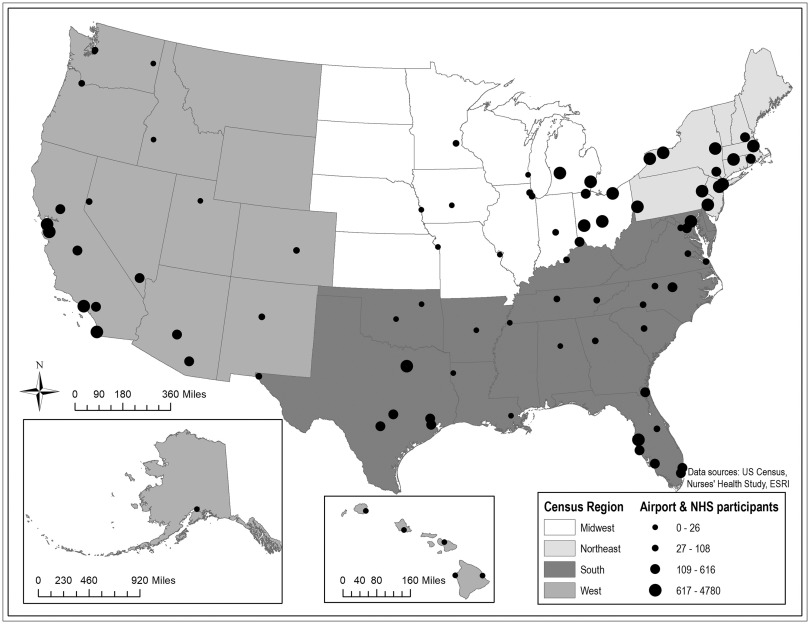
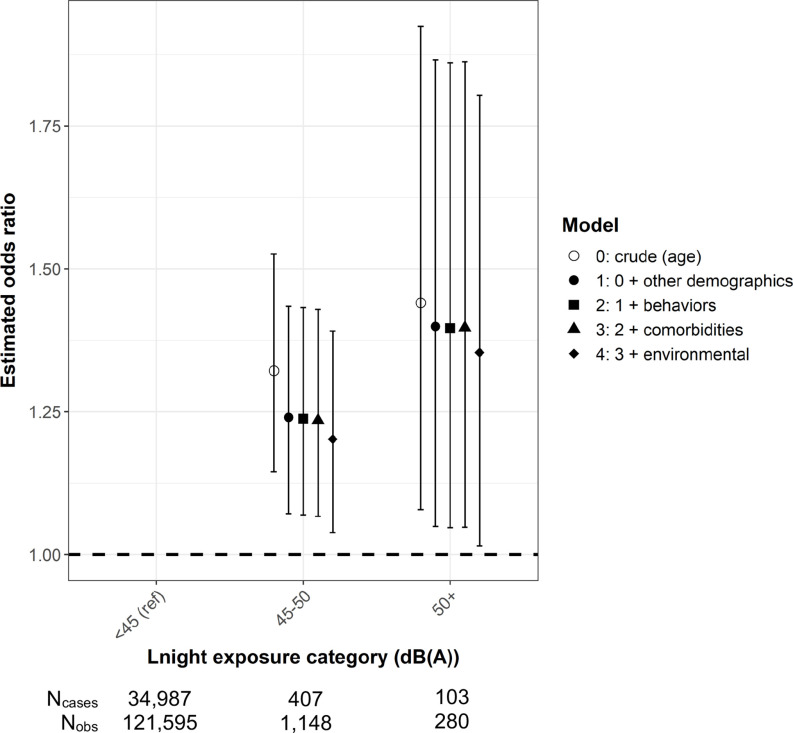
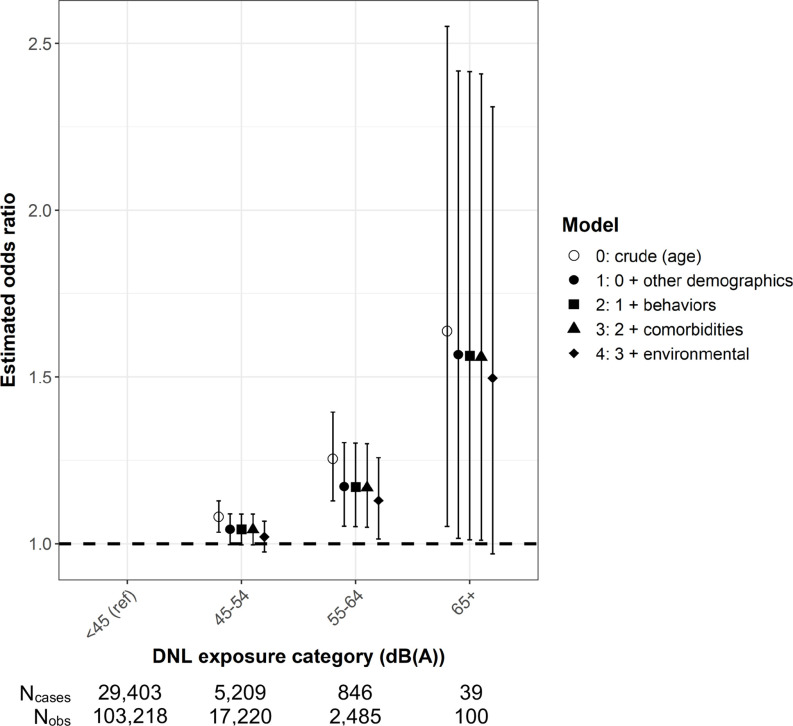
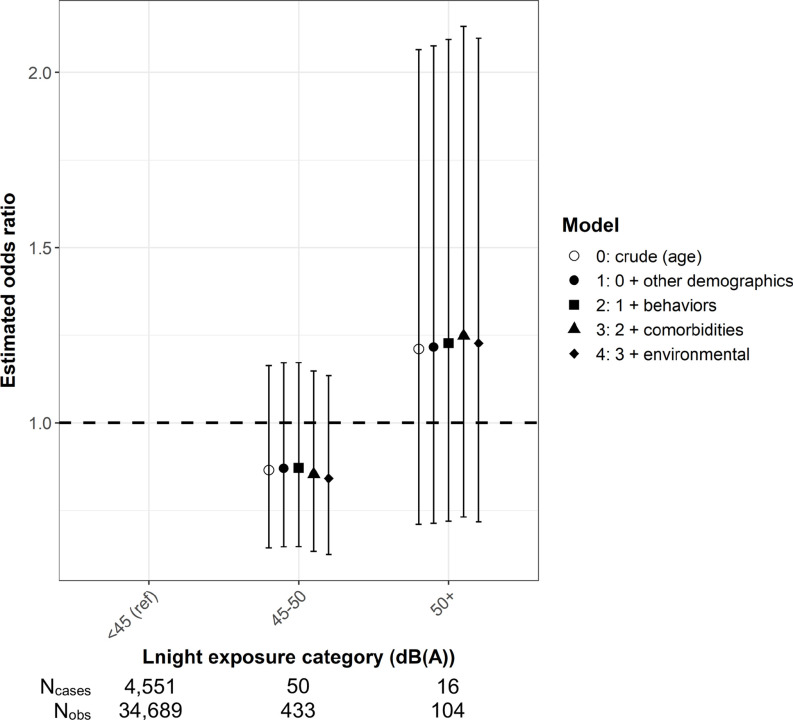
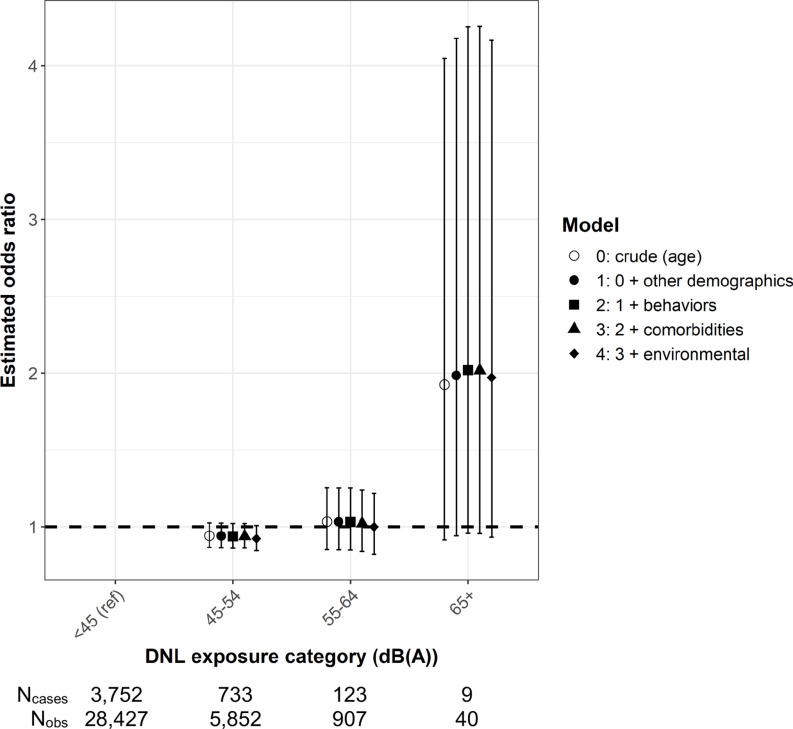
Methods: Aircraft nighttime equivalent sound levels (Lnight) and day-night average sound levels (DNL) were modeled around 90 U.S. airports from 1995 to 2015 in 5-y intervals using the Aviation Environmental Design Tool and linked to geocoded participant residential addresses. Lnight exposure was dichotomized at the lowest modeled level of 45 A-weighted decibels [dB(A)] and at multiple cut points for DNL. Multiple categories of both metrics were compared with <45 dB(A). Self-reported short sleep duration (<7 h/24-h day) was ascertained in 2000, 2002, 2008, 2012, and 2014, and poor sleep quality (frequent trouble falling/staying asleep) was ascertained in 2000. We analyzed repeated sleep duration measures using generalized estimating equations and sleep quality by conditional logistic regression. We adjusted for participant-level demographics, behaviors, comorbidities, and environmental exposures (greenness and light at night) and examined effect modification.

Results: In 35,226 female nurses averaging 66.1 years of age at baseline, prevalence of short sleep duration and poor sleep quality were 29.6% and 13.1%, respectively. In multivariable models, exposure to Lnight 45 dB(A) was associated with 23% [95% confidence interval (CI): 7%, 40%] greater odds of short sleep duration but was not associated with poor sleep quality (9% lower odds; 95% CI: -30%, 19%). Increasing categories of Lnight and DNL 45 dB(A) suggested an exposure-response relationship for short sleep duration. We observed higher magnitude associations among participants living in the West, near major cargo airports, and near water-adjacent airports and among those reporting no hearing loss.

Discussion: Aircraft noise was associated with short sleep duration in female nurses, modified by individual and airport characteristics. https://doi.org/10.1289/EHP10959.


Figures

Figure 1 is a map of the United States of America, depicting the study of 90 airports symbolized by U.S. Census regions and quartiles of Nurses’ Health Study participants. A scale depicts miles ranging from 0 to 180 in increments of 90 and 180 to 360 in increments of 180. At the bottom-left, a map of Alaska is displayed with a scale depicting miles ranging from 0 to 460 in increments of 230 and 460 to 920 in increments of 460. At the bottom-center, a map of Hawaii is displayed with a scale depicting miles ranging from 0 to 80 in increments of 40 and 80 to 160 in increments of 80. At the bottom-right, the following information is given: The Census region includes the Midwest, Northeast, South, and West. Airport and N H S participants includes four ranges: 0 to 26, 27 to 108, 109 to 616, and 617 to 4,780.
Figure 1.
Map of 90 study airports across the United States symbolized by U.S. Census region and quartiles of Nurses’ Health Study (NHS) participants.
Figure 2 is an error bar graph, plotting estimated odds ratio, ranging from 1.00 to 1.75 in increments of 0.25 (y-axis) across nighttime noise level exposure category A-weighted decibel, ranging, less than 45 (reference) with 34,987 cases and 121,595 observations, 45 to 50 with 407 cases and 1,148 observations, and 50 plus including 0: crude (age), 1: 0 plus other demographics, 2: 1 plus behaviors, 3: 2 plus comorbidities, 4: 3 with 103 cases and 280 observations (x-axis) for model, plus environmental.
Figure 2.
Odds ratio (OR) point estimates and 95% confidence intervals (CIs) investigating exposure–response relationship (pTrend<0.01) between categorical aircraft nighttime sound level (Lnight) exposure [<45 dB(A) (reference), 45–49 dB(A), and 50 dB(A)] and short sleep duration (<7 h/24-h day), using GEEs from repeated measures in survey years 2000 (study baseline), 2002, 2008, 2012, and 2014 in the Nurses’ Health Study (NHS). OR and CI estimates can be found in Table S6. Models adjusted for age (age, age2) were sequentially further adjusted for other demographics, behaviors, comorbidities, and environmental factors. Other demographics: U.S. region of residence, race, living alone, spouse’s education. Behaviors: smoking status, alcohol consumption. Comorbidities: diabetes, hypertension. Environmental: greenness (NDVI), LAN. Models of short sleep duration used GEEs to estimate odds from repeated measures in survey years 2000 (study baseline), 2002, 2008, 2012, and 2014. Note: dB(A), A-weighted decibel; GEE, generalized estimating equation; LAN, light at night; Ncases, number of cases; NDVI, Normalized Difference Vegetation Index; Nobs, number of observations.
Figure 3 is an error bar graph, plotting estimated odds ratio, ranging from 1.0 to 2.5 in increments of 0.5 (y-axis) across day–night average sound level exposure category A-weighted decibel, ranging, less than 45 (reference) with 29,403 cases and 103,218 observations, 45 to 54 with 5,209 cases and 17,220 observations, 55 to 64 with 846 cases and 2,485 observations, and 65 plus with 39 cases and 100 observations (x-axis) for model, including 0: crude (age), 1: 0 plus other demographics, 2: 1 plus behaviors, 3: 2 plus comorbidities, 4: 3 plus environmental.
Figure 3.
Odds ratio (OR) point estimates and 95% confidence intervals (CIs) investigating exposure–response relationship (pTrend=0.03) between categorical aircraft day–night average sound level (DNL) exposure [<45 (reference), 45–54, 55–64, and 65 dB(A)] and short sleep duration (<7 h/24-h day), using GEEs from repeated measures in survey years 2000 (study baseline), 2002, 2008, 2012, and 2014 in the Nurses’ Health Study (NHS). OR and CI estimates can be found in Table S6. Models adjusted for age (age, age2) were sequentially further adjusted for other demographics, behaviors, comorbidities, and environmental factors. Other demographics: U.S. region of residence, race, living alone, spouse’s education. Behaviors: smoking status, alcohol consumption. Comorbidities: diabetes, hypertension. Environmental: greenness (NDVI), LAN. Models of short sleep duration used GEEs to estimate odds from repeated measures in survey years 2000 (study baseline), 2002, 2008, 2012, and 2014. Note: dB(A), A-weighted decibel; GEE, generalized estimating equation; LAN, light at night; Ncases, number of cases; NDVI, Normalized Difference Vegetation Index; Nobs, number of observations.
Figure 4 is an error bar graph, plotting estimated odds ratio, ranging from 1.0 to 2.0 in increments of 0.5 (y-axis) across nighttime noise level exposure category A-weighted decibel, ranging, less than 45 (reference) with 4,551 cases and 34,689 observations, 45 to 50 with 50 cases and 433 observations, and 50 plus with 16 cases and 104 observations (x-axis) for model, including 0: crude (age), 1: 0 plus other demographics, 2: 1 plus behaviors, 3: 2 plus comorbidities, 4: 3 plus environmental.
Figure 4.
Odds ratio (OR) point estimates and 95% confidence intervals (CIs) investigating exposure–response relationship (pTrend=0.37) between categorical aircraft nighttime equivalent sound level (Lnight) exposure [<45 (reference), 45–49 dB(A), and 50 dB(A)] and poor sleep quality (trouble falling/staying asleep “a good bit of the time”) using conditional logistic regression at study baseline (2000) in the Nurses’ Health Study (NHS). OR and CI estimates can be found in Table S6. Models were adjusted for age (age, age2) other demographics, behaviors, comorbidities, and environmental factors. Other demographics: U.S. region of residence (removed from the region-specific models), race, living alone, spouse’s education. Behaviors: smoking status, alcohol consumption. Comorbidities: diabetes, hypertension. Environmental: greenness (NDVI), LAN. Conditional logistic regression models of sleep quality were used to estimate odds only for the baseline study year. Note: dB(A), A-weighted decibel; LAN, light at night; Ncases, number of cases; NDVI, Normalized Difference Vegetation Index; Nobs, number of observations.
Figure 5 is an error bar graph, plotting estimated odds ratio, ranging from 1 to 4 in unit increments (y-axis) across day–night average sound level exposure category A-weighted decibel, ranging, less than 45 (reference) with 3,752 cases and 28,427 observations, 45 to 54 with 733 cases and 5,852 observations, 55 to 64 with 123 cases and 907 observations, and 65 plus with 9 cases and 40 observations (x-axis) for model, including 0: crude (age), 1: 0 plus other demographics, 2: 1 plus behaviors, 3: 2 plus comorbidities, 4: 3 plus environmental.
Figure 5.
Odds ratio (OR) point estimates and 95% confidence intervals (CIs) investigating exposure–response relationship (pTrend=0.37) between categorical aircraft day–night sound level (DNL) exposure [<45 (reference), 45–54, 55–64, and 65 dB(A)] and poor sleep quality (trouble falling/staying asleep “a good bit of the time”) using conditional logistic regression at study baseline (2000) in the Nurses’ Health Study (NHS). OR and CI estimates can be found in Table S6. Models were adjusted for age (age, age2) other demographics, behaviors, comorbidities, and environmental factors. Other demographics: U.S. region of residence (removed from the region-specific models), race, living alone, spouse’s education. Behaviors: smoking status, alcohol consumption. Comorbidities: diabetes, hypertension. Environmental: greenness (NDVI), LAN. Conditional logistic regression models of sleep quality were used to estimate odds only for the baseline study year. Note: dB(A), A-weighted decibel; LAN, light at night; Ncases, number of cases; NDVI, Normalized Difference Vegetation Index; Nobs, number of observations.

Similar articles

Cited by

References

    1. Institute of Medicine Committee on Sleep Medicine and Research. 2006. Sleep Disorders and Sleep Deprivation: An Unmet Public Health Problem. Colten HR, Altevogt BM, eds. Washington, DC: National Academies Press. - PubMed
    1. Spiegel K, Tasali E, Leproult R, Van Cauter E. 2009. Effects of poor and short sleep on glucose metabolism and obesity. Nat Rev Endocrinol 5(5):253–261, PMID: , 10.1038/nrendo.2009.23. - DOI - PMC - PubMed
    1. Knutson KL, Spiegel K, Penev P, Van Cauter E. 2007. The metabolic consequences of sleep deprivation. Sleep Med Rev 11(3):163–178, PMID: , 10.1016/j.smrv.2007.01.002. - DOI - PMC - PubMed
    1. Besedovsky L, Lange T, Haack M. 2019. The sleep–immune crosstalk in health and disease. Physiol Rev 99(3):1325–1380, PMID: , 10.1152/physrev.00010.2018. - DOI - PMC - PubMed
    1. Spiegel K, Leproult R, Van Cauter E. 1999. Impact of sleep debt on metabolic and endocrine function. Lancet 354(9188):1435–1439, PMID: , 10.1016/S0140-6736(99)01376-8. - DOI - PubMed

Publication types