

Use of machine learning to identify risk factors for coronary artery disease
- PMID: 37058460
- PMCID: PMC10104376
- DOI: 10.1371/journal.pone.0284103
Use of machine learning to identify risk factors for coronary artery disease
Abstract
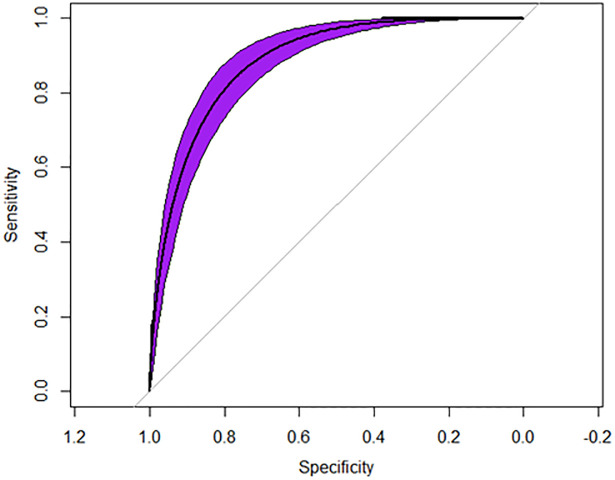
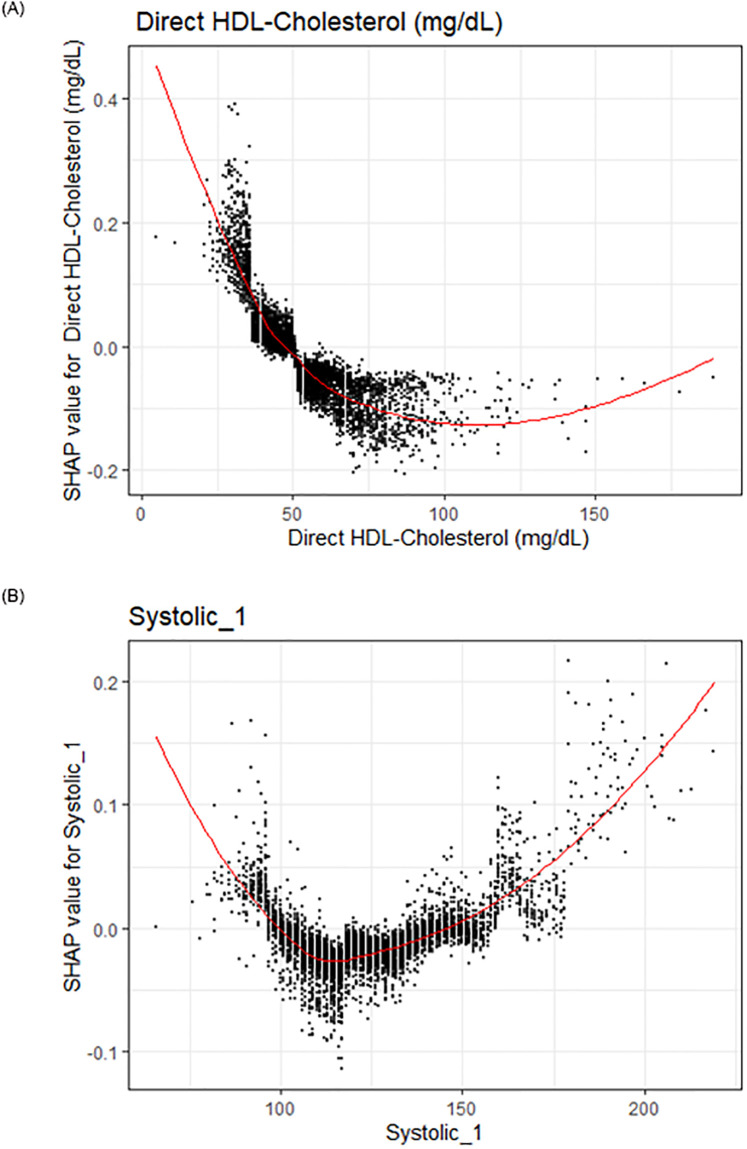
Coronary artery disease (CAD) is the leading cause of death in both developed and developing nations. The objective of this study was to identify risk factors for coronary artery disease through machine-learning and assess this methodology. A retrospective, cross-sectional cohort study using the publicly available National Health and Nutrition Examination Survey (NHANES) was conducted in patients who completed the demographic, dietary, exercise, and mental health questionnaire and had laboratory and physical exam data. Univariate logistic models, with CAD as the outcome, were used to identify covariates that were associated with CAD. Covariates that had a p<0.0001 on univariate analysis were included within the final machine-learning model. The machine learning model XGBoost was used due to its prevalence within the literature as well as its increased predictive accuracy in healthcare prediction. Model covariates were ranked according to the Cover statistic to identify risk factors for CAD. Shapely Additive Explanations (SHAP) explanations were utilized to visualize the relationship between these potential risk factors and CAD. Of the 7,929 patients that met the inclusion criteria in this study, 4,055 (51%) were female, 2,874 (49%) were male. The mean age was 49.2 (SD = 18.4), with 2,885 (36%) White patients, 2,144 (27%) Black patients, 1,639 (21%) Hispanic patients, and 1,261 (16%) patients of other race. A total of 338 (4.5%) of patients had coronary artery disease. These were fitted into the XGBoost model and an AUROC = 0.89, Sensitivity = 0.85, Specificity = 0.87 were observed (Fig 1). The top four highest ranked features by cover, a measure of the percentage contribution of the covariate to the overall model prediction, were age (Cover = 21.1%), Platelet count (Cover = 5.1%), family history of heart disease (Cover = 4.8%), and Total Cholesterol (Cover = 4.1%). Machine learning models can effectively predict coronary artery disease using demographic, laboratory, physical exam, and lifestyle covariates and identify key risk factors.
Copyright: © 2023 Huang, Huang. This is an open access article distributed under the terms of the Creative Commons Attribution License, which permits unrestricted use, distribution, and reproduction in any medium, provided the original author and source are credited.
Conflict of interest statement
The authors have declared that no competing interests exist.
Figures


Similar articles
-
Use of machine learning to identify risk factors for insomnia.PLoS One. 2023 Apr 12;18(4):e0282622. doi: 10.1371/journal.pone.0282622. eCollection 2023. PLoS One. 2023. PMID: 37043435 Free PMC article.
-
Shapely additive values can effectively visualize pertinent covariates in machine learning when predicting hypertension.J Clin Hypertens (Greenwich). 2023 Dec;25(12):1135-1144. doi: 10.1111/jch.14745. Epub 2023 Nov 16. J Clin Hypertens (Greenwich). 2023. PMID: 37971610 Free PMC article.
-
Comparison of model feature importance statistics to identify covariates that contribute most to model accuracy in prediction of insomnia.PLoS One. 2024 Jul 2;19(7):e0306359. doi: 10.1371/journal.pone.0306359. eCollection 2024. PLoS One. 2024. PMID: 38954735 Free PMC article.
-
Coronary artery disease detection using artificial intelligence techniques: A survey of trends, geographical differences and diagnostic features 1991-2020.Comput Biol Med. 2021 Jan;128:104095. doi: 10.1016/j.compbiomed.2020.104095. Epub 2020 Oct 28. Comput Biol Med. 2021. PMID: 33217660 Review.
-
Machine Learning in Cardiovascular Risk Prediction and Precision Preventive Approaches.Curr Atheroscler Rep. 2023 Dec;25(12):1069-1081. doi: 10.1007/s11883-023-01174-3. Epub 2023 Nov 27. Curr Atheroscler Rep. 2023. PMID: 38008807 Review.
Cited by
-
NSUN2 knockdown ameliorates hepatic glucose and lipid metabolism disorders in type 2 diabetes mellitus through the Inhibition of ACSL6 m5C methylation.Lipids Health Dis. 2025 Jul 10;24(1):236. doi: 10.1186/s12944-025-02652-0. Lipids Health Dis. 2025. PMID: 40640814 Free PMC article.
-
Predictive models and determinants of mortality among T2DM patients in a tertiary hospital in Ghana, how do machine learning techniques perform?BMC Endocr Disord. 2025 Jan 10;25(1):9. doi: 10.1186/s12902-025-01831-5. BMC Endocr Disord. 2025. PMID: 39794757 Free PMC article.
-
Identify the underlying true model from other models for clinical practice using model performance measures.BMC Med Res Methodol. 2025 Jan 9;25(1):4. doi: 10.1186/s12874-025-02457-w. BMC Med Res Methodol. 2025. PMID: 39789439 Free PMC article.
-
The Relationship Between Metal Exposure and HPV Infection: Evidence from Explainable Machine Learning Methods.Biol Trace Elem Res. 2025 Apr;203(4):2206-2215. doi: 10.1007/s12011-024-04322-1. Epub 2024 Jul 29. Biol Trace Elem Res. 2025. PMID: 39073733
-
Inverse associations of the lifestyle critical 9 with cardiorenal syndrome: the mediating role of the dietary inflammatory index.Front Nutr. 2025 Mar 13;12:1519612. doi: 10.3389/fnut.2025.1519612. eCollection 2025. Front Nutr. 2025. PMID: 40151350 Free PMC article.
References
MeSH terms
Grants and funding
LinkOut - more resources
Full Text Sources
Medical
Miscellaneous
