

TEAD1 trapping by the Q353R-Lamin A/C causes dilated cardiomyopathy
- PMID: 37058558
- PMCID: PMC10104473
- DOI: 10.1126/sciadv.ade7047
TEAD1 trapping by the Q353R-Lamin A/C causes dilated cardiomyopathy
Abstract
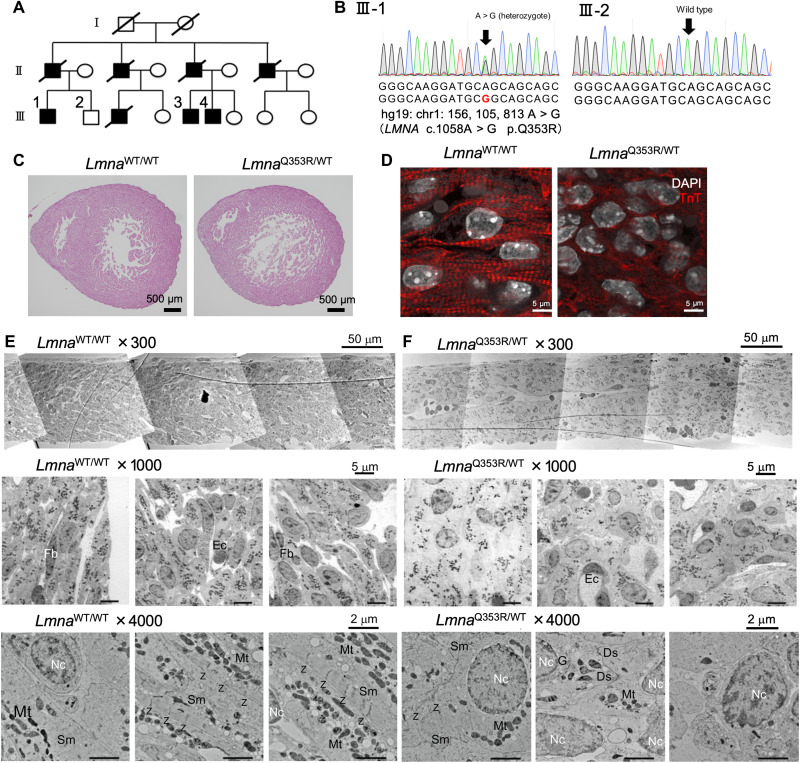
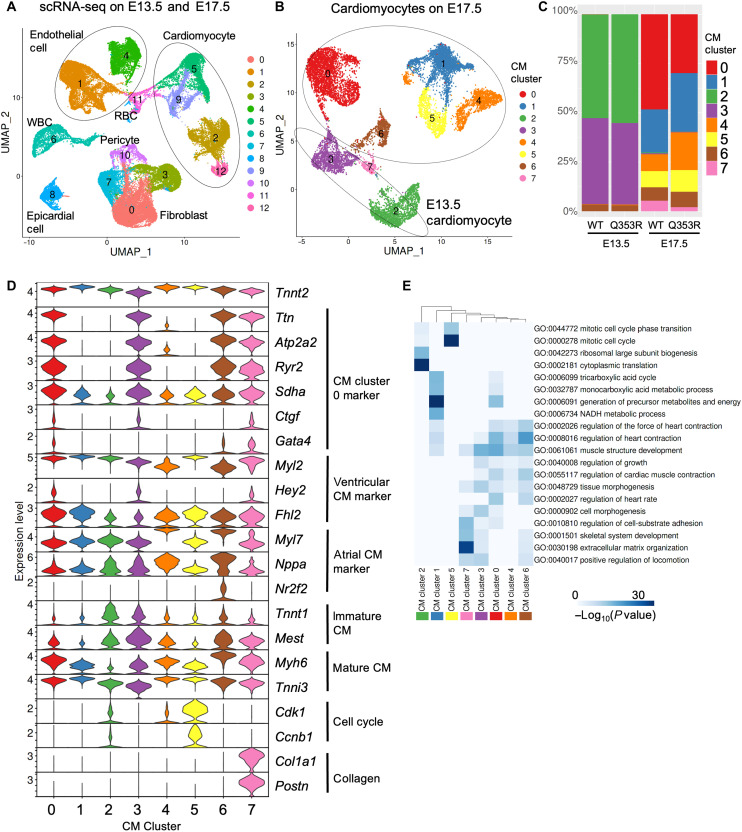
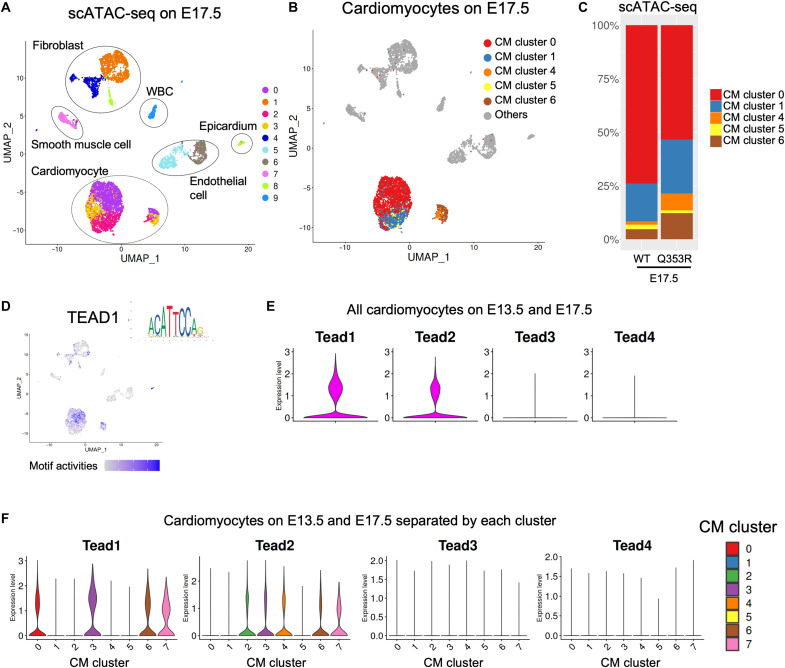
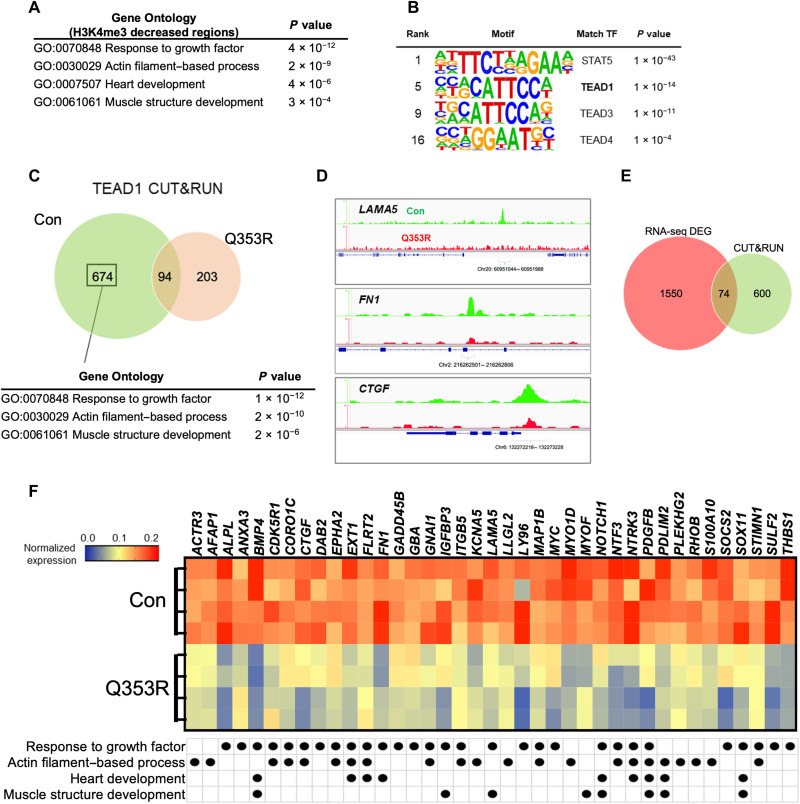
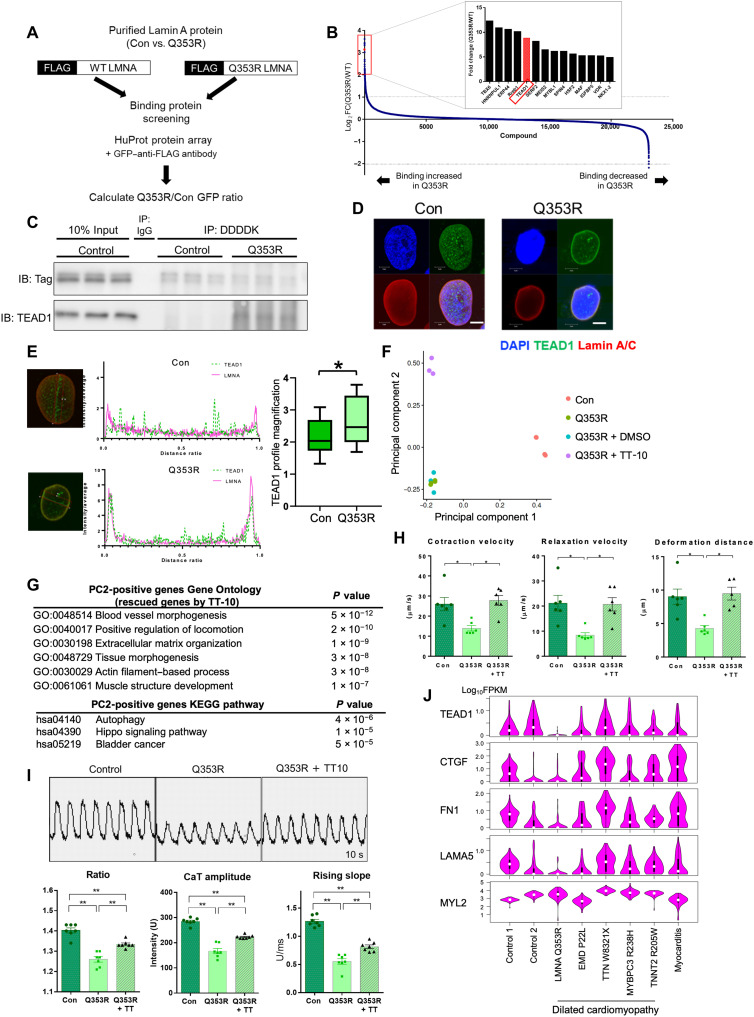
Mutations in the LMNA gene encoding Lamin A and C (Lamin A/C), major components of the nuclear lamina, cause laminopathies including dilated cardiomyopathy (DCM), but the underlying molecular mechanisms have not been fully elucidated. Here, by leveraging single-cell RNA sequencing (RNA-seq), assay for transposase-accessible chromatin using sequencing (ATAC-seq), protein array, and electron microscopy analysis, we show that insufficient structural maturation of cardiomyocytes owing to trapping of transcription factor TEA domain transcription factor 1 (TEAD1) by mutant Lamin A/C at the nuclear membrane underlies the pathogenesis of Q353R-LMNA-related DCM. Inhibition of the Hippo pathway rescued the dysregulation of cardiac developmental genes by TEAD1 in LMNA mutant cardiomyocytes. Single-cell RNA-seq of cardiac tissues from patients with DCM with the LMNA mutation confirmed the dysregulated expression of TEAD1 target genes. Our results propose an intervention for transcriptional dysregulation as a potential treatment of LMNA-related DCM.
Figures

Similar articles
-
The LMNA mutation p.Arg321Ter associated with dilated cardiomyopathy leads to reduced expression and a skewed ratio of lamin A and lamin C proteins.Exp Cell Res. 2013 Nov 15;319(19):3010-9. doi: 10.1016/j.yexcr.2013.08.024. Epub 2013 Aug 31. Exp Cell Res. 2013. PMID: 24001739
-
LMNA-Related Dilated Cardiomyopathy: Single-Cell Transcriptomics during Patient-Derived iPSC Differentiation Support Cell Type and Lineage-Specific Dysregulation of Gene Expression and Development for Cardiomyocytes and Epicardium-Derived Cells with Lamin A/C Haploinsufficiency.Cells. 2024 Sep 3;13(17):1479. doi: 10.3390/cells13171479. Cells. 2024. PMID: 39273049 Free PMC article.
-
DNA Damage Response/TP53 Pathway Is Activated and Contributes to the Pathogenesis of Dilated Cardiomyopathy Associated With LMNA (Lamin A/C) Mutations.Circ Res. 2019 Mar 15;124(6):856-873. doi: 10.1161/CIRCRESAHA.118.314238. Circ Res. 2019. PMID: 30696354 Free PMC article.
-
Lamin A/C mutations in dilated cardiomyopathy.Cardiol J. 2014;21(4):331-42. doi: 10.5603/CJ.a2014.0037. Epub 2014 May 20. Cardiol J. 2014. PMID: 24846508 Review.
-
Recent advances in animal and human pluripotent stem cell modeling of cardiac laminopathy.Stem Cell Res Ther. 2016 Sep 20;7(1):139. doi: 10.1186/s13287-016-0401-5. Stem Cell Res Ther. 2016. PMID: 27649756 Free PMC article. Review.
Cited by
-
Risk Assessment and Personalized Treatment Options in Inherited Dilated Cardiomyopathies: A Narrative Review.Biomedicines. 2024 Jul 24;12(8):1643. doi: 10.3390/biomedicines12081643. Biomedicines. 2024. PMID: 39200108 Free PMC article. Review.
-
A Valuable Genetically Engineered Nonhuman Primate Model of Dilated Cardiomyopathy.JACC Basic Transl Sci. 2024 Mar 28;9(3):396-398. doi: 10.1016/j.jacbts.2024.01.004. eCollection 2024 Mar. JACC Basic Transl Sci. 2024. PMID: 38559618 Free PMC article.
-
The tRNA methyltransferase Mettl1 governs ketogenesis through translational regulation and drives metabolic reprogramming in cardiomyocyte maturation.Nat Cardiovasc Res. 2024 Dec;3(12):1438-1453. doi: 10.1038/s44161-024-00565-2. Epub 2024 Nov 25. Nat Cardiovasc Res. 2024. PMID: 39587264
-
TRAITER: transformer-guided diagnosis and prognosis of heart failure using cell nuclear morphology and DNA damage marker.Bioinformatics. 2024 Nov 1;40(11):btae610. doi: 10.1093/bioinformatics/btae610. Bioinformatics. 2024. PMID: 39412446 Free PMC article.
-
Chromatin accessibility: biological functions, molecular mechanisms and therapeutic application.Signal Transduct Target Ther. 2024 Dec 4;9(1):340. doi: 10.1038/s41392-024-02030-9. Signal Transduct Target Ther. 2024. PMID: 39627201 Free PMC article. Review.
References
-
- D. Fatkin, C. MacRae, T. Sasaki, M. Wolff, M. Porcu, M. Frenneaux, J. Atherton, H. Vidaillet Jr., S. Spudich, U. D. Girolami, J. Seidman, C. Seidman, F. Muntoni, G. Müehle, W. Johnson, B. McDonough, Missense mutations in the rod domain of the lamin A/C gene as causes of dilated cardiomyopathy and conduction-system disease. N. Engl. J. Med. 341, 1715–1724 (1999). - PubMed
-
- A. N. Rosenbaum, K. E. Agre, N. L. Pereira, Genetics of dilated cardiomyopathy: Practical implications for heart failure management. Nat. Rev. Cardiol. 17, 286–297 (2020). - PubMed
-
- M. Gigli, M. Merlo, S. L. Graw, G. Barbati, T. J. Rowland, D. B. Slavov, D. Stolfo, M. E. Haywood, M. Dal Ferro, A. Altinier, F. Ramani, F. Brun, A. Cocciolo, I. Puggia, G. Morea, W. J. McKenna, F. G. La Rosa, M. R. G. Taylor, G. Sinagra, L. Mestroni, Genetic risk of arrhythmic phenotypes in patients with dilated cardiomyopathy. J. Am. Coll. Cardiol. 74, 1480–1490 (2019). - PMC - PubMed
-
- T. Tobita, S. Nomura, T. Fujita, H. Morita, Y. Asano, K. Onoue, M. Ito, Y. Imai, A. Suzuki, T. Ko, M. Satoh, K. Fujita, A. T. Naito, Y. Furutani, H. Toko, M. Harada, E. Amiya, M. Hatano, E. Takimoto, T. Shiga, T. Nakanishi, Y. Sakata, M. Ono, Y. Saito, S. Takashima, N. Hagiwara, H. Aburatani, I. Komuro, Genetic basis of cardiomyopathy and the genotypes involved in prognosis and left ventricular reverse remodeling. Sci. Rep. 8, 1998 (2018). - PMC - PubMed
MeSH terms
Substances
LinkOut - more resources
Full Text Sources
Molecular Biology Databases
Research Materials
Miscellaneous
