. 2023 Apr 14;9(15):eabo2467.
doi: 10.1126/sciadv.abo2467. Epub 2023 Apr 14.

Characterization of altered molecular mechanisms in Parkinson's disease through cell type-resolved multiomics analyses

Affiliations

Characterization of altered molecular mechanisms in Parkinson's disease through cell type-resolved multiomics analyses

Andrew J Lee et al. Sci Adv. .

Abstract

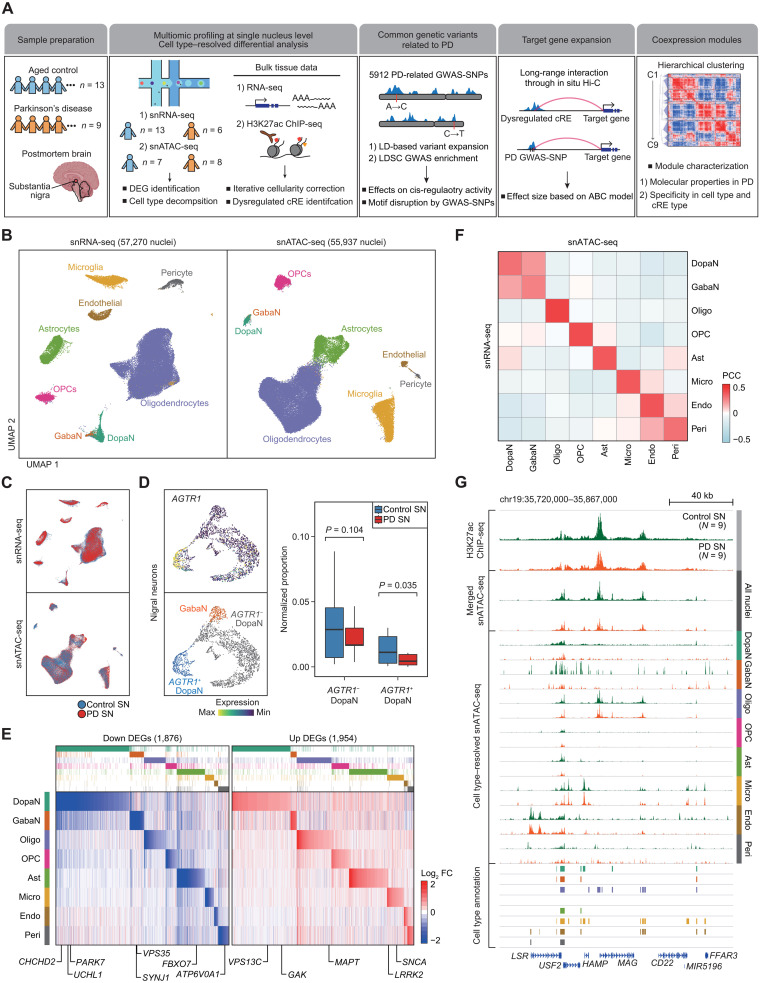
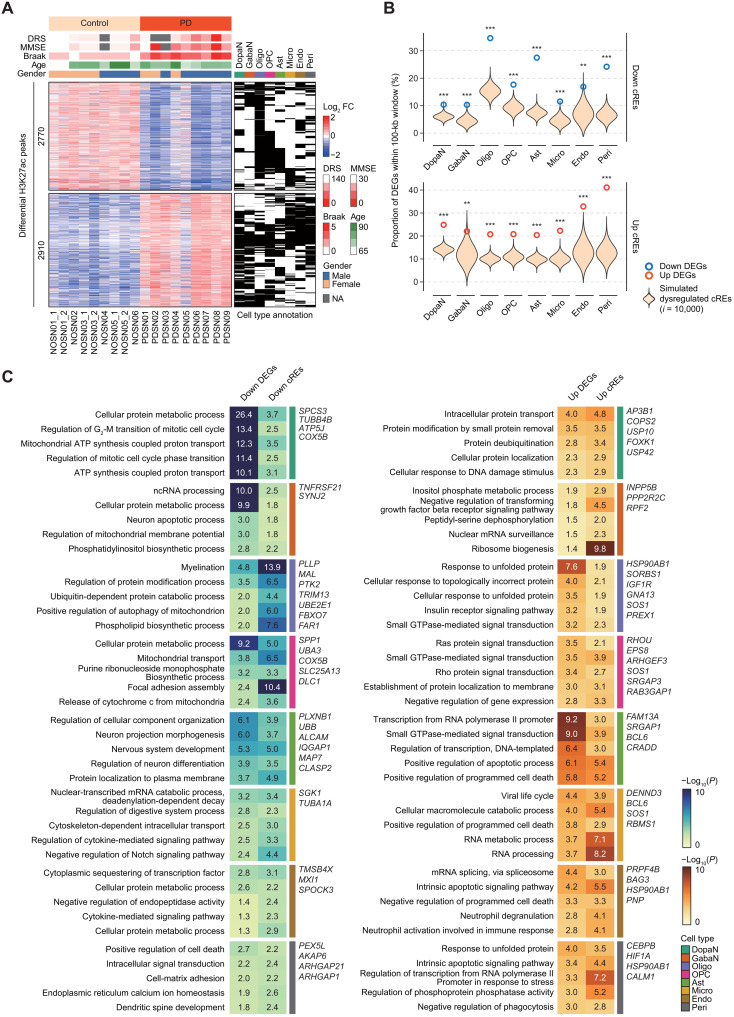
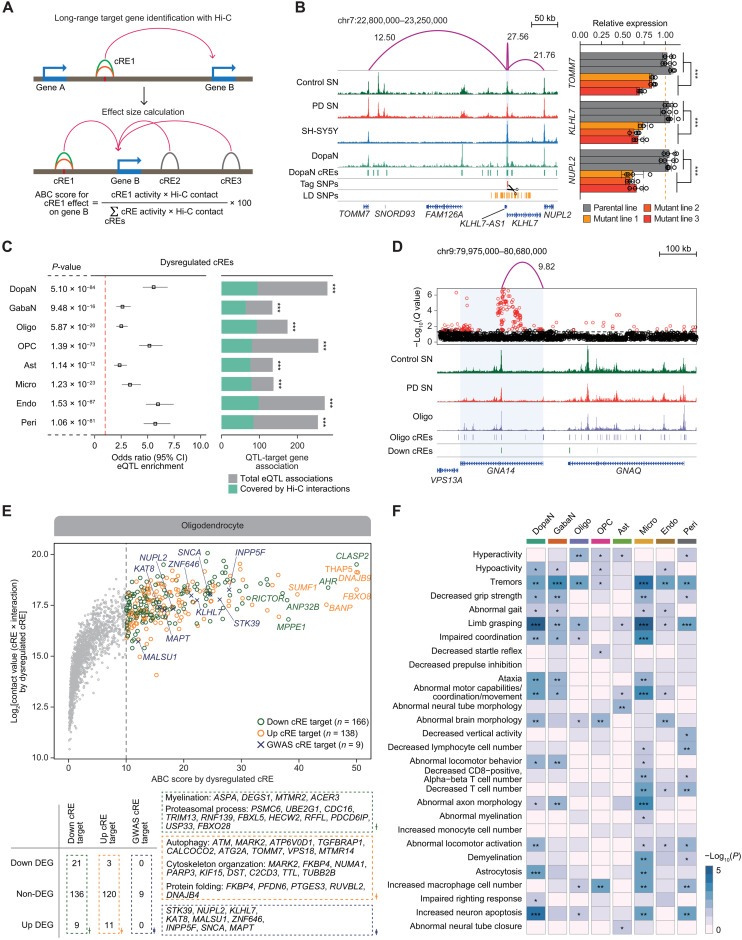
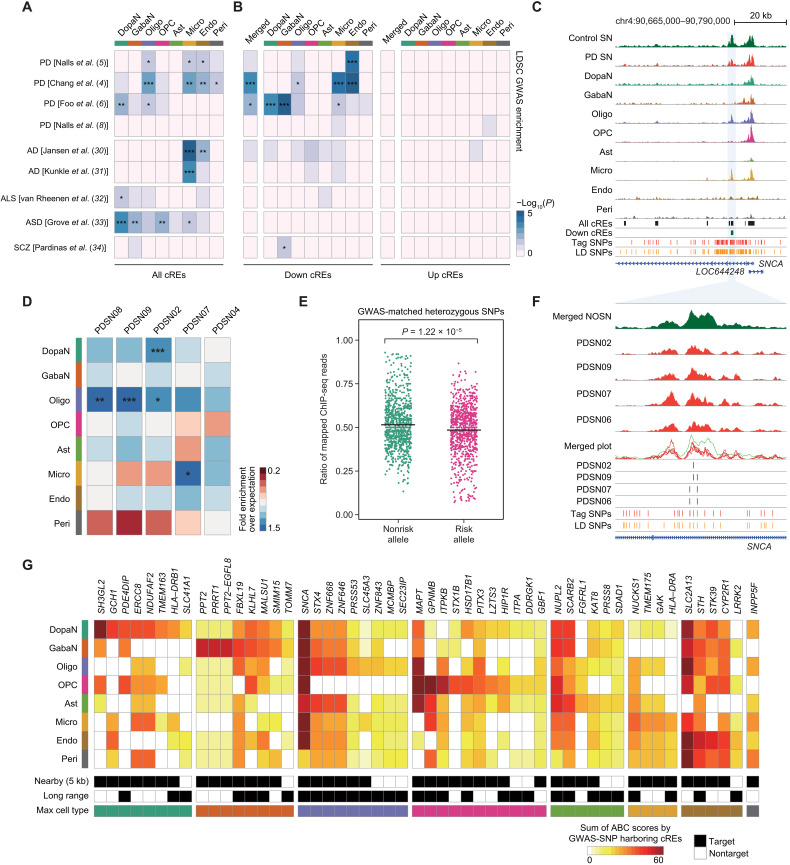
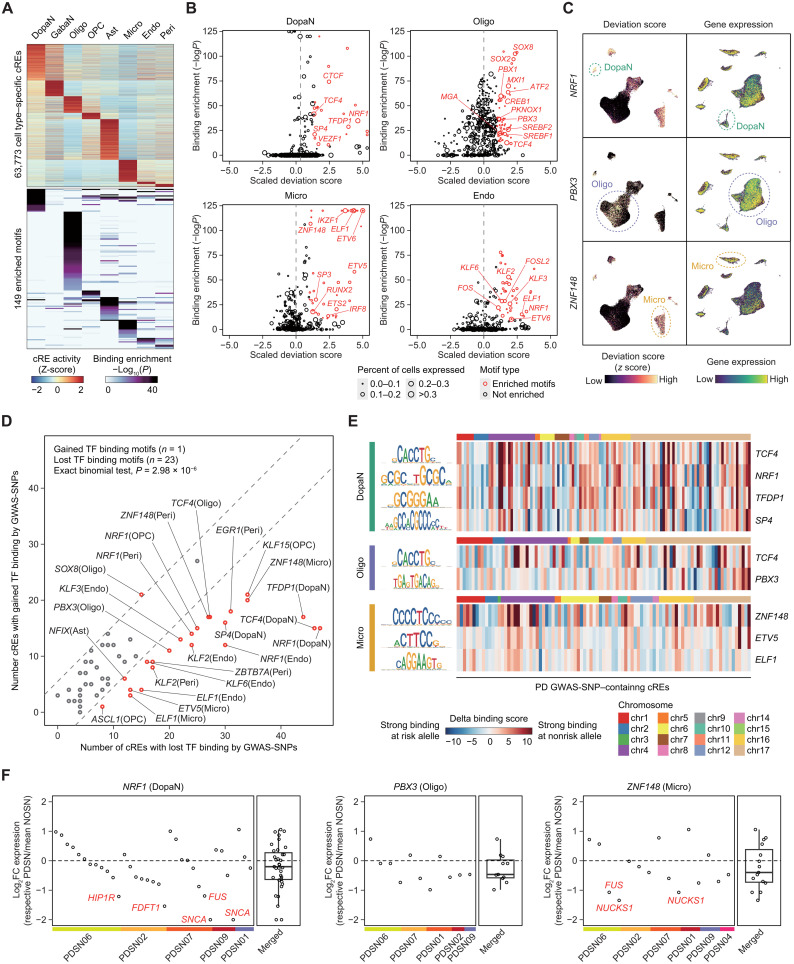
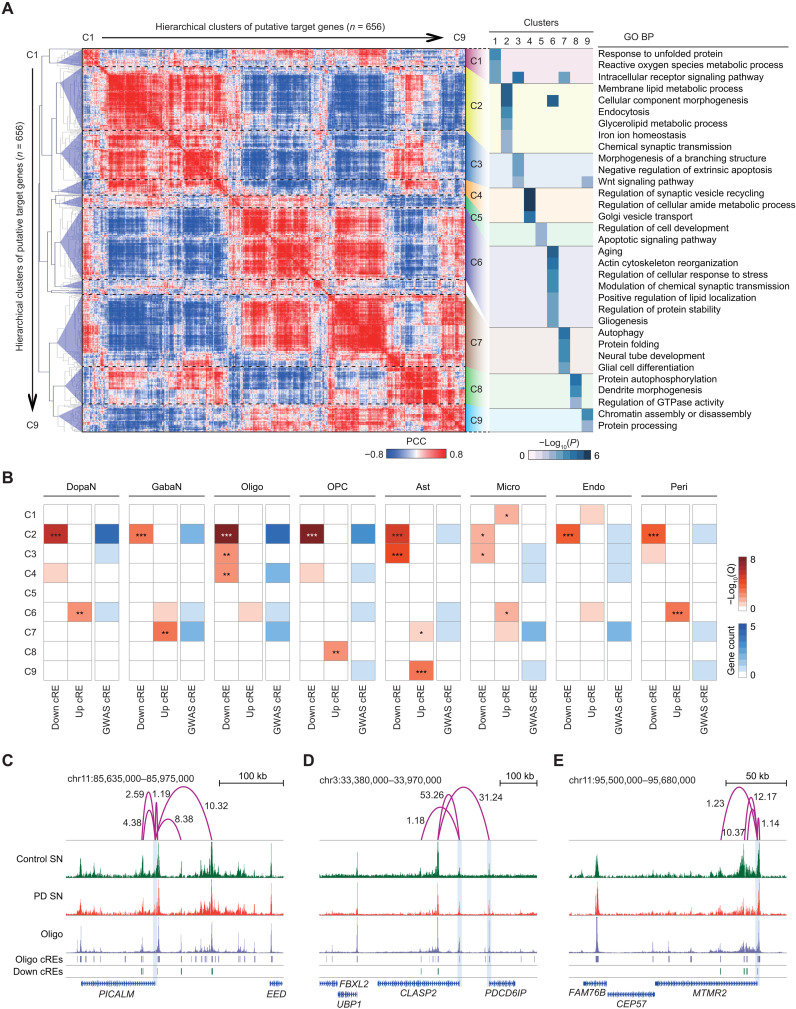
Parkinson's disease (PD) is a progressive neurodegenerative disorder. However, cell type-dependent transcriptional regulatory programs responsible for PD pathogenesis remain elusive. Here, we establish transcriptomic and epigenomic landscapes of the substantia nigra by profiling 113,207 nuclei obtained from healthy controls and patients with PD. Our multiomics data integration provides cell type annotation of 128,724 cis-regulatory elements (cREs) and uncovers cell type-specific dysregulations in cREs with a strong transcriptional influence on genes implicated in PD. The establishment of high-resolution three-dimensional chromatin contact maps identifies 656 target genes of dysregulated cREs and genetic risk loci, uncovering both potential and known PD risk genes. Notably, these candidate genes exhibit modular gene expression patterns with unique molecular signatures in distinct cell types, highlighting altered molecular mechanisms in dopaminergic neurons and glial cells including oligodendrocytes and microglia. Together, our single-cell transcriptome and epigenome reveal cell type-specific disruption in transcriptional regulations related to PD.


Figures

Fig. 1.
Fig. 1.. Single-nucleus profiling of transcriptomic and epigenomic landscape in the human SN.
(A) A schematic of the study design, illustrating the preparation of sequencing-based omics data and downstream computational analysis. (B) Uniform Manifold Approximation and Projection (UMAP) embeddings of quality control–passed nuclei for snRNA-seq (left) and snATAC-seq (right). The nuclei were annotated into dopaminergic neurons (DopaNs), GABAergic neurons (GabaN), oligodendrocytes (Oligo), oligodendrocyte precursor cells (OPCs), astrocytes (Ast), microglia (Micro), endothelial cells (Endo), and pericytes (Peri), based on cell type markers. (C) UMAP embeddings of nuclei colored by pathological status, where red and blue indicate nuclei from PD and control SN, respectively. (D) UMAP embeddings of nigral neurons illustrating sub-DopaN populations with or without the expression of AGTR (left), along with box plots showing the normalized nucleus proportion of AGTR+ and AGTR DopaNs between control and PD cases based on snRNA-seq data. (E) A heatmap by log2 fold change (FC) of cell type–resolved snRNA-seq reads (PD/control), illustrating 1876 down-regulated DEGs (left) and 1954 up-regulated DEGs (right), with the annotation of known PD risk genes. (F) A heatmap showing Pearson’s correlation coefficients (PCC) between snATAC-seq gene activity scores and snRNA-seq gene expression across the cell types present in the human SN. (G) Genome browser tracks of H3K27ac ChIP-seq signals and pseudo-bulk snATAC-seq signals resolved according to each cell type for PD (red) and control (green) groups, along with tracks indicating the positions of cell type–resolved cREs. The signals for ChIP-seq and cell type–resolved snATAC-seq were normalized by the total reads mapped in cREs.
Fig. 2.
Fig. 2.. Dysregulation of cREs shaping PD-specific gene expression.
(A) A heatmap of 2770 down-regulated and 2910 up-regulated cREs by log2 fold change of normalized H3K27ac ChIP-seq reads divided by the mean of all samples, along with binarized annotation of cell types. DRS, dementia rating scale; MMSE, mini mental state of examination; NA, not available. (B) Enrichment analysis for colocalization between DEGs and dysregulated cREs in a distance genomic window (100 kb). Violin plots represent the expected proportion of DEGs harbored by simulated cREs with 10,000 permutations. The observed proportion of DEGs is shown in bold donuts (blue for down-regulated DEGs and dark orange for up-regulated DEGs). The statistical significance was calculated based on empirical testing (**P < 0.01 and ***P < 0.001). (C) Top 5 enriched GO biological pathways for down-regulated (left) and up-regulated (right) DEGs commonly represented by genes annotated by dysregulated cREs through Genomic Regions Enrichment of Annotations Tool (GREAT) for individual cell types. DEGs within PD-related pathways that are also supported by dysregulated cREs are labeled. ATP, adenosine 5′-triphosphate.
Fig. 3.
Fig. 3.. Target gene inference for noncoding regulatory sequences through 3D chromatin contacts.
(A) The illustrative approaches to identifying long-range interaction target genes using high-resolution 3D chromatin contact map and to characterizing the cis-gene regulation circuitry by calculating the effect size of all cRE-to-gene promoter associations within 1 Mb based on ABC model. (B) Left: H3K27ac ChIP-seq tracks for control SN, PD SN, and SH-SY5Y neuroblastoma, along with pseudo-bulk chromatin accessibility for DopaNs. Additional tracks indicate the positions of DopaN cREs and PD GWAS-SNPs. Significant long-range chromatin interactions are shown in purple arcs with the corresponding ABC score. Right: Bar plots with dots indicating TOMM7, KLHL7, and NUPL2 RNA levels in the parental SH-SY5Y cells and three independent mutant clones. Each clone has three biological replicates (Welch two-sample t test, ***P < 0.001). (C) Forest plots showing the enrichment of eQTLs in dysregulated cREs (left) and the proportion of eQTL-target gene associations matched with Hi-C interactions (right). The P value and odd ratio were calculated using two-sided Fisher’s exact test for eQTL enrichment, and the significance of target gene overlap was calculated on the basis of hypergeometric test (***P < 0.001). CI, confidence interval. (D) An example of a down-regulated cRE in oligodendrocytes whose significant chromatin interactions to a target gene promoter is supported by eQTL associations, with H3K27ac ChIP-seq tracks for PD and control SN and pseudo-bulk chromatin accessibility for oligodendrocytes (Oligo). Significant long-range chromatin interactions are shown in purple arcs with the corresponding ABC score. (E) Top: A scatter plot illustrating the putative target genes for oligodendrocyte with an ABC score threshold of 10. Bottom: Putative target genes were categorized on the basis of DEG status and the representative GO biological pathways. (F) A heatmap illustrating the enrichment of 656 putative PD genes for 28 neurological, movement, and immune symptoms potentially associated with PD symptoms (*P < 0.05, **P < 0.01, and ***P < 0.001).
Fig. 4.
Fig. 4.. Characterization of PD GWAS-SNPs based on cell type–resolved epigenomic landscape.
(A and B) Heatmaps illustrating the LDSC GWAS-SNP enrichment for neurological and psychiatric disorders in cell type–resolved cREs (A) and dysregulated cREs (B). ALS, amyotrophic lateral sclerosis; ASD, autism spectrum disorder; SCZ, schizophrenia. P values were derived from the LDSC enrichment testing (*P < 0.05, **P < 0.01, and ***P < 0.001). (C) H3K27ac ChIP-seq tracks for PD and control SN and cell type–resolved pseudo-bulk snATAC-seq signals in the SNCA locus. Additional tracks indicate the positions of all and down-regulated cREs and PD GWAS-SNPs. (D) Heatmap showing the fold enrichment of PD GWAS-matched genetic variants identified from each PD donor on cell type–resolved cis-regulatory landscape. The statistical enrichment of variants on each cell type cREs was calculated on the basis of exact binomial test (*P < 0.05, **P < 0.01, and ***P < 0.001). (E) Jitter plots describing the ratio of ChIP-seq reads mapped to the risk and nonrisk alleles of PD GWAS-matched heterozygous SNPs identified in PD donors. The black horizontal bars indicate the mean of each group. The statistical significance was calculated on the basis of two-sided Welch two-sample t test. (F) Epigenome browser tracks for H3K27ac ChIP-seq signals of control and four PD cases, along with GWAS-matched variants identified in each PD case and the PD-related tag and LD-expanded GWAS-SNPs in the SNCA locus. The ChIP-seq signals are normalized by the total reads mapped in cREs. (G) A heatmap describing the putative target genes of GWAS-SNP–harboring cREs identified on the basis of significant chromatin interactions. The ABC scores are calculated iteratively on the basis of the cell type–resolved epigenome to describe cell type–specific activation of key pathogenic genes by the PD GWAS-SNPs. Fifty-two genes with the sum of ABC scores by the GWAS-SNP–harboring cREs greater than 20 are shown.
Fig. 5.
Fig. 5.. Altered motif binding affinity for active TFs in the PD GWAS-SNP–containing cREs.
(A) Heatmaps describing the z-transformed activity of cell type–specific cREs (top) and the enrichment of binding motifs in the cell type–specific cREs (bottom). Cell type–specific cREs were identified on the basis of Wilcoxon BH-adjusted P < 0.05, log2FC > 1, and percent of nucleus detected > 0.05, comparing each cell type to the background of all other cell types. (B) Scatter plots illustrating the −log10 hypergeometric enrichment of TFs and the scaled chromVAR deviation score, depicting TF motif activity. The size of each data point represents the percent of nuclei expressed, and TFs with minimum expression detected greater than 10% were selected as enriched TFs. (C) UMAP embeddings of snATAC-seq (left) and snRNA-seq (right) nuclei illustrating z-transformed deviation score and gene expression of enriched TFs including NRF1, PBX3, and ZNF148. (D) Scatter plots of enriched motifs illustrating GWAS-SNP–containing cREs with gain or loss of TF binding as a result of PD-associated genetic variations. For each GWAS-SNP–containing cRE, a difference in binding score greater than 3 between risk and nonrisk alleles of GWAS-SNPs was used to define gained and lost TF binding. The dashed gray lines represent the difference in the number of cREs with gained and lost TF binding of 5. (E) Heatmaps showing the delta binding scores of individual PD GWAS-SNP–containing cREs across the genome, for enriched TFs in DopaNs, oligodendrocytes, and microglia. (F) Scatter plots describing the log2 fold change expression (a respective PD donor over the mean of control samples) for target genes of cREs with disruption in binding motifs for respective TFs by GWAS-matched donor variants based on cumulative ABC score greater than 1. The name of target genes with log2 fold change less than −1 is labeled in red. PDSN, Parkinson's disease SN; NOSN, control SN.
Fig. 6.
Fig. 6.. Analysis of modular gene expression patterns across putative PD genes.
(A) Left: A hierarchical clustering of 656 putative PD genes based on similarities in gene expression between 16 bulk RNA-seq samples from control and PD SN. The color intensity indicates PCC of putative target gene expression between pair-wise samples. Nine distinct clusters were identified by a linkage distance (0.66) threshold in the dendrogram. Right: A heatmap describing the enrichment of GO biological pathways (BP). Each entry indicates −log10(P) of GO biological processes in the corresponding cluster. (B) Heatmaps illustrating the enrichment of cell type–resolved target genes with respect to the nine coexpression clusters. For each cell type, the putative target genes were categorized into three groups based on the type of cRE connected (down- and up-regulated cREs or GWAS-SNP–harboring cRE). The enrichment level was calculated on the basis of one-sided exact binomial test with BH multiple testing correction (*Q < 0.05, **Q < 0.01, and ***Q < 0.001). (C to E) H3K27ac ChIP-seq tracks for PD and control SN and pseudo-bulk chromatin accessibility for oligodendrocytes (Oligo) for a genomic locus containing PICALM (C), CLASP2 and PDCD6IP (D), and MTMR2 (E). Additional tracks indicate positions of Oligo and down-regulated cREs. The signals for ChIP-seq and cell type–resolved snATAC-seq are normalized by the total reads mapped in cREs. Significant long-range chromatin interactions are shown in purple arcs with the corresponding ABC score.

References

    1. J. Jankovic, Parkinson’s disease: Clinical features and diagnosis. J. Neurol. Neurosurg. Psychiatry 79, 368–376 (2008). - PubMed
    1. A. B. Singleton, M. Farrer, J. Johnson, A. Singleton, S. Hague, J. Kachergus, M. Hulihan, T. Peuralinna, A. Dutra, R. Nussbaum, S. Lincoln, A. Crawley, M. Hanson, D. Maraganore, C. Adler, M. R. Cookson, M. Muenter, M. Baptista, D. Miller, J. Blancato, J. Hardy, K. Gwinn-Hardy, α-Synuclein locus triplication causes Parkinson’s disease. Science 302, 841 (2003). - PubMed
    1. V. Bonifati, P. Rizzu, M. J. van Baren, O. Schaap, G. J. Breedveld, E. Krieger, M. C. Dekker, F. Squitieri, P. Ibanez, M. Joosse, J. W. van Dongen, N. Vanacore, J. C. van Swieten, A. Brice, G. Meco, C. M. van Duijn, B. A. Oostra, P. Heutink, Mutations in the DJ-1 gene associated with autosomal recessive early-onset parkinsonism. Science 299, 256–259 (2003). - PubMed
    1. D. Chang, M. A. Nalls, I. B. Hallgrimsdottir, J. Hunkapiller, M. van der Brug, F. Cai; International Parkinson’s Disease Genomics Consortium; 23andMe Research Team, G. A. Kerchner, G. Ayalon, B. Bingol, M. Sheng, D. Hinds, T. W. Behrens, A. B. Singleton, T. R. Bhangale, R. R. Graham, A meta-analysis of genome-wide association studies identifies 17 new Parkinson’s disease risk loci. Nat. Genet. 49, 1511–1516 (2017). - PMC - PubMed
    1. M. A. Nalls, N. Pankratz, C. M. Lill, C. B. Do, D. G. Hernandez, M. Saad, A. L. DeStefano, E. Kara, J. Bras, M. Sharma, C. Schulte, M. F. Keller, S. Arepalli, C. Letson, C. Edsall, H. Stefansson, X. Liu, H. Pliner, J. H. Lee, R. Cheng; International Parkinson’s Disease Genomics Consortium (IPDGC); Parkinson’s Study Group (PSG) Parkinson’s Research: The Organized GENetics Initiative (PROGENI); 23andMe; GenePD; NeuroGenetics Research Consortium (NGRC); Hussman Institute of Human Genomics (HIHG); Ashkenazi Jewish Dataset Investigator; Cohorts for Health and Aging Research in Genetic Epidemiology (CHARGE); North American Brain Expression Consortium (NABEC); United Kingdom Brain Expression Consortium (UKBEC); Greek Parkinson’s Disease Consortium; Alzheimer Genetic Analysis Group, M. A. Ikram, J. P. Ioannidis, G. M. Hadjigeorgiou, J. C. Bis, M. Martinez, J. S. Perlmutter, A. Goate, K. Marder, B. Fiske, M. Sutherland, G. Xiromerisiou, R. H. Myers, L. N. Clark, K. Stefansson, J. A. Hardy, P. Heutink, H. Chen, N. W. Wood, H. Houlden, H. Payami, A. Brice, W. K. Scott, T. Gasser, L. Bertram, N. Eriksson, T. Foroud, A. B. Singleton, Large-scale meta-analysis of genome-wide association data identifies six new risk loci for Parkinson’s disease. Nat. Genet. 46, 989–993 (2014). - PMC - PubMed