. 2023 Apr 14;9(15):eadf5493.
doi: 10.1126/sciadv.adf5493. Epub 2023 Apr 14.

The 2022 Hunga-Tonga megatsunami: Near-field simulation of a once-in-a-century event

Affiliations

The 2022 Hunga-Tonga megatsunami: Near-field simulation of a once-in-a-century event

Sam J Purkis et al. Sci Adv. .

Abstract

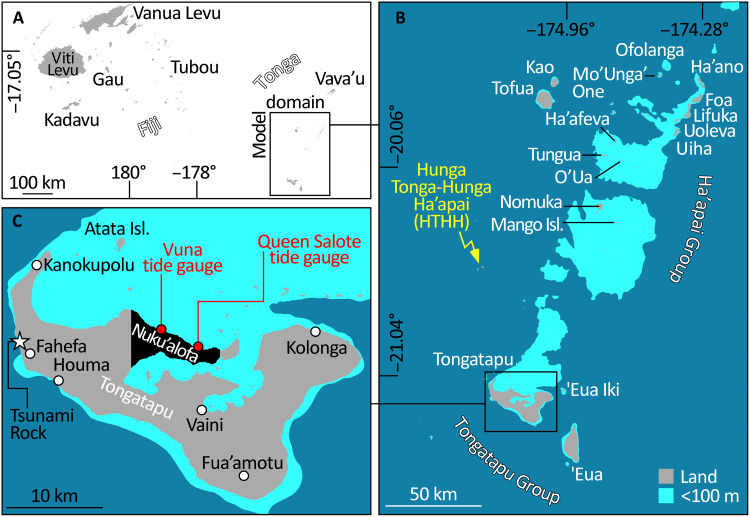
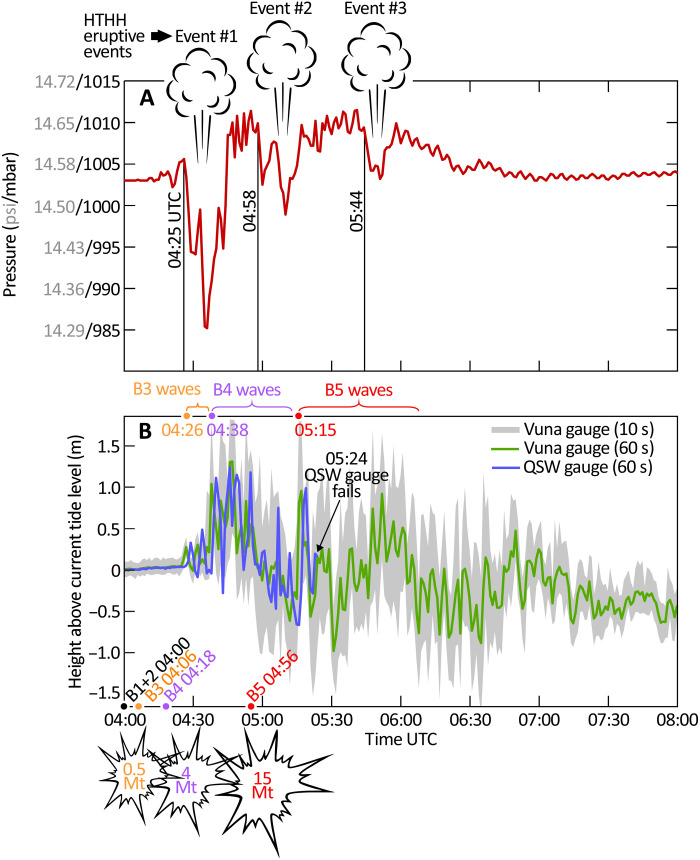
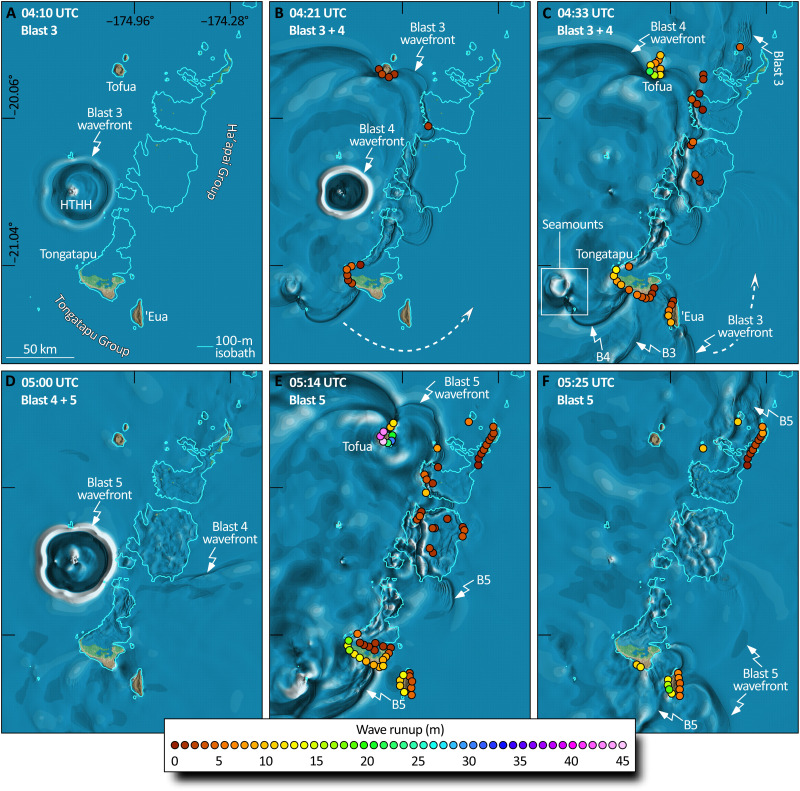
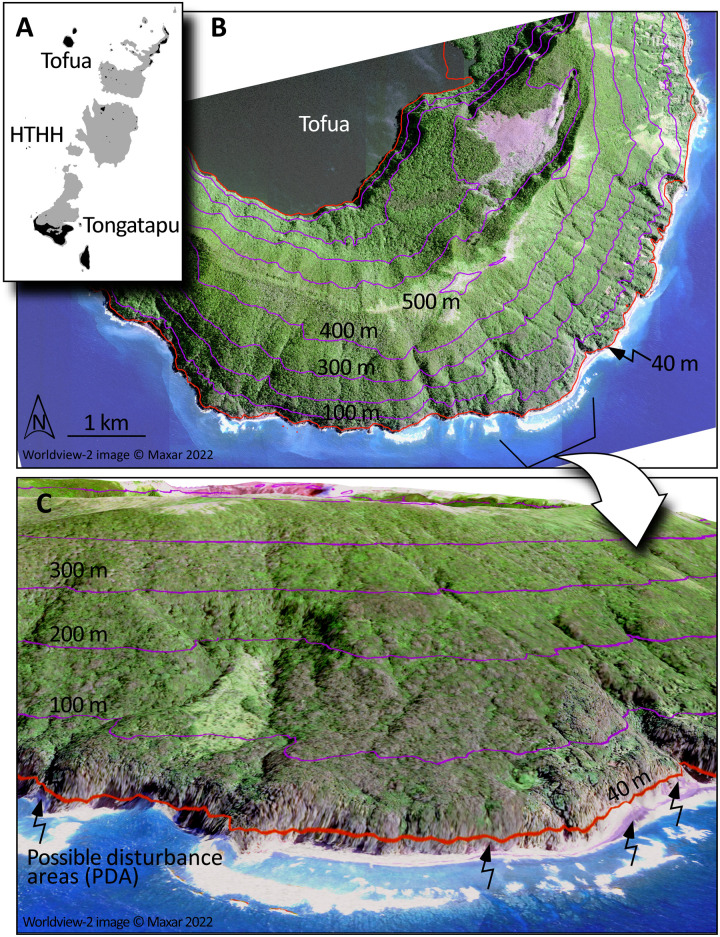
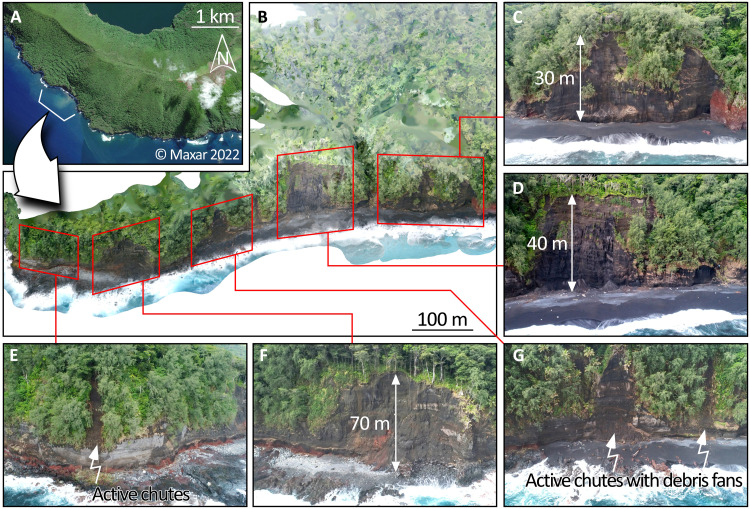
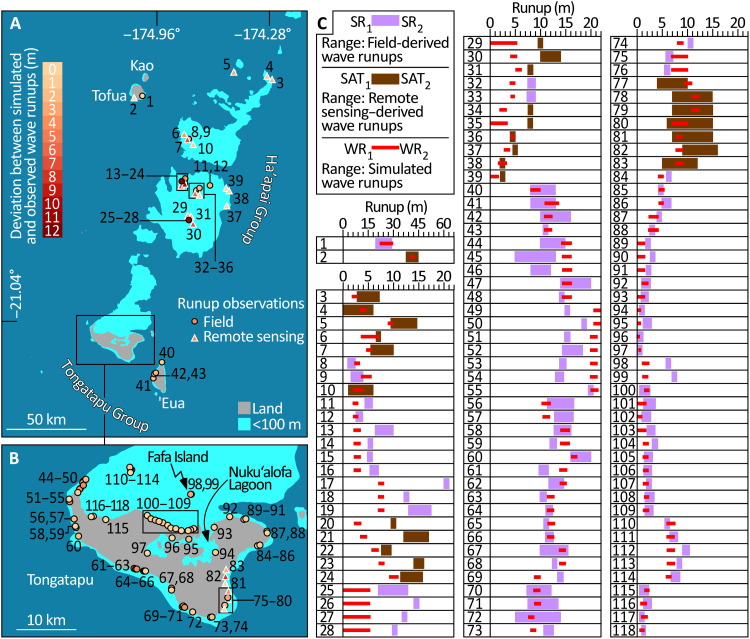
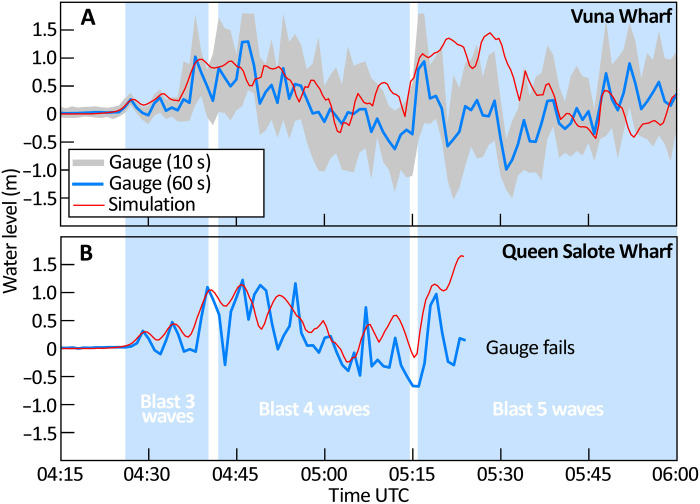
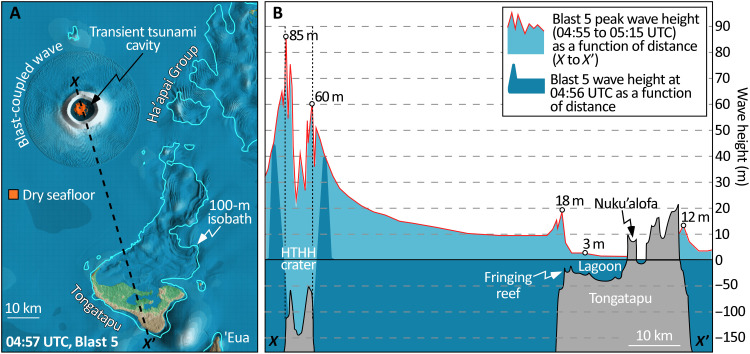
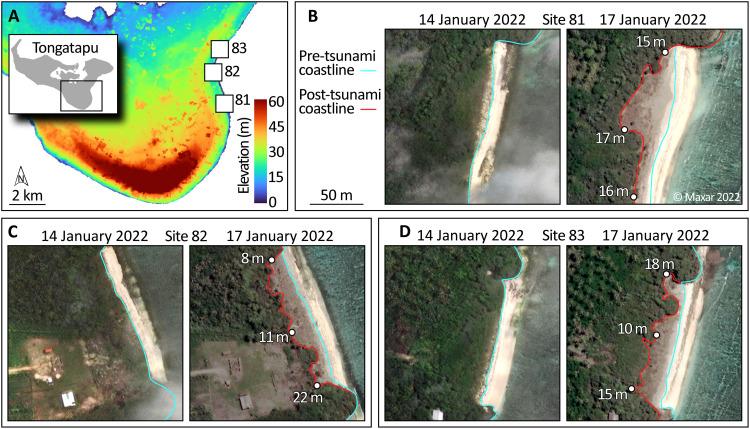
The Hunga Tonga-Hunga Ha'apai (HTHH) volcanic eruption in January 2022 generated catastrophic tsunami and contends for the largest natural explosion in more than a century. The main island, Tongatapu, suffered waves up to 17 m, and Tofua Island suffered waves up to 45 m, comfortably placing HTHH in the "megatsunami" league. We present a tsunami simulation of the Tongan Archipelago calibrated by field observations, drone, and satellite data. Our simulation emphasizes how the complex shallow bathymetry of the area acted as a low-velocity wave trap, capturing tsunami for more than 1 hour. Despite its size and long duration, few lives were lost. Simulation suggests that HTHH's location relative to urban centers saved Tonga from a worse outcome. Whereas 2022 seems to have been a lucky escape, other oceanic volcanoes have the capacity to spawn future tsunami at HTHH scale. Our simulation amplifies the state of understanding of volcanic explosion tsunami and provides a framework for assessment of future hazards.


Figures

Fig. 1.
Fig. 1.. The study area spans the southern portion of the Tonga Archipelago in the South Pacific.
(A) Location of model domain. (B) The Tongatapu and Ha’apai island groups situate on a series of carbonate platforms mapped by the 100-m isobath (cyan polygons). The HTHH island and Hunga submarine caldera lies to the west of these platforms in deep water (yellow arrow). (C) Tongatapu is the main island of Tonga and the site of its capital, Nukuʻalofa (city limits, black polygon). Here, tide gauges are stationed on the Queen Salote and Vuna Wharfs (red dots). The white star marks the position of Tsunami Rock, a 1600-ton erratic boulder in the vicinity of Fahefa village presumed deposited by prehistoric tsunami.
Fig. 2.
Fig. 2.. Time-averaged surface station data recorded by the Tongan Met Office in the main port of Nuku‘alofa on 15 January 2022.
(A) Barometric pressure records three long-period, low-pressure phases starting at 4:45, 4:58, and 5:44 UTC. We interpret these to be caused by the development of a low-pressure zone beneath the plume rising above HTHH. Averaged over 60 s. Intervals, these barometric data adequately capture these pressure drops that last approximately 20 min. Pressure anomalies generated by the tsunamigenic explosions are too short lived to be recorded. To time these explosions, we rely on ear- and eyewitness accounts and the signal of the arriving tsunami waves at the two Nuku‘alofa tide gauges. The tide data (B) come from two gauges, one on the Queen Salote Wharf (QSW) and the second 1.8 km away on the Vuna Wharf. Situated 65 km away, the waves spawned at HTHH take 20 min to transit to Nuku‘alofa. Two small blasts (Blasts 1 and 2) are reportedly heard in Nuku‘alofa at around 4:00 UTC, but these evidently do not generate tsunami. Earwitness accounts of blasts at 4:06 and 04:18 UTC correspond to parcels of waves arriving at the two tide gauges starting at 4:26 and 4:38, respectively. A third wave parcel is recorded arriving at 5:15 UTC, delivering the largest peak-to-peak variation in sea level (>3 m) recorded in the series, preempting the failure of the Queen Salote Wharf gauge at 5:24. We contend that this parcel was generated from Blast 5 at 4:56 UTC. The available data suggest that the explosive yields from Blasts 3, 4, and 5 were 0.5, 4, and 15 Mt, respectively.
Fig. 3.
Fig. 3.. Blast pressures, broken windows, and explosive yield.
(A) In 1964, the U.S. Federal Aviation Authority (FAA) flew supersonic jet planes over Oklahoma City to evaluate the effect of sonic booms on people and property. From this exercise, the FAA developed probabilistic assessments of the likelihood of window glass breaking for a given overpressure (46). Witnesses report that the blast occurring shortly before 05:00 UTC broke windows in Nuku‘alofa, situated 65 km from the HTHH volcano. The FAA data instruct that overpressures of 0.35 and 0.15 psi would break between 30 and 5% of windows, a span that sensibly brackets the damage in Nuku‘alofa. Data formulated for overpressures at varying offset distance (Eq. 3) reveal that blasts with yields of 15 and 5 Mt, respectively, would deliver these pressures at 65 km (B).
Fig. 4.
Fig. 4.. Tsunami simulations for the repetitive blasts of HTHH.
Wave propagation shown at T = 4:10 (A), 4:21 (B), 4:33 (C), 5:00 (D), 5:14 (E), and 5:25 UTC (F) and color scale depict maximum wave runup at the coast. These six time slices encompass the creation and propagation of waves from the three 15 January 2022 tsunamigenic explosions of HTHH. Highest runups in the model domain (45 m) are on the coastline of the northern island of Tofua that suffered the full unattenuated brunt of the tsunami. Receiving waves that have not crossed the shallow Tongatapu and Ha’apai carbonate platforms, the southwest coasts of the islands of Tongatapu and ‘Eua also receive runups >15 m high. Most other island locations, being protected by fringing reefs and shallow lagoons, fare better. Note how Tongatapu and ‘Eua refract waves from a southerly to a northerly path (e.g., broken white arrows on frames 4:21 and 4:33 UTC), thereby projecting tsunami onto the (sheltered) eastern flanks of the Tongatapu and Ha’apai platforms. Animation as movie S2.
Fig. 5.
Fig. 5.. Post-tsunami disturbances along the southern flank of Tofua Island based on synthetic aperture radar, DEM, and optical imaging analysis.
(A) Location of Tofua 90 km north of the Hunga submarine caldera (HTHH). (B) Nadir view of the southern flanks of Tofua from Canadian Space Agency’s (CSA) Radarsat Constellation Mission (RCM) C-band HH polarization spotlight SAR (1-m resolution, inverted in its backscatter) at 46° incidence with semitransparent Maxar WorldView (WV-02) visible wavelength data (resampled to 1 m) and superimposed DEM contours every 100 m from sea level (in purple), as well as the 40 m (above-sea-level) contour in orange. (C) Oblique view ray-traced using the co-registered synthetic aperture radar (SAR), with the 1-m ground sample distance (GSD) DEM, with the ocean view from WV-02 acquired 2 September 2022, and the inverted RCM-SAR acquired by the CSA in Spotlight (beam FSL30) mode on Aug. 24th, 2022. Pink to magenta correspond to possible disturbance areas (PDAs) identified in the satellite data. These putative tsunami-related disturbances require field validation for confirmation but are suggestive of runups up to 45 m in this steeply sloping region. GEDI and ICESat-2 LIDAR topography has been used to evaluate the steepest slopes in this central, southern portion of the Tofua volcanic island. RCM-SAR data courtesy of RCM image at 2022 courtesy of the government of Canada.
Fig. 6.
Fig. 6.. Drone imaged post-tsunami disturbances along the south-southwest flank of Tofua Island.
(A) Maxar Worldview-02 view of SSW Tofua, with arrow indicating the area of DJI drone imaging (14 October 2022). (B) Oblique ray-traced perspective view of the SSW flanks of Tofua developed from DJI drone data as a structure-from-motion DEM by NASA Goddard. Spatial resolution of this DEM is 8 cm, with ortho-image mosaic of drone images projected atop the topography. Of the 1500 m of coastline imaged, approximately 300 m show signs of recent disturbance (in the DEM), consistent with the anticipated impact of the 15 January 2022 megatsunami. Drone images (C to F) emphasize disturbances ranging in height from 30 to 70 m, including landslides (C, D, and D), fresh debris fans, and debris chutes with transported trees (E and G). DJI drone data were acquired by S.J.C.
Fig. 7.
Fig. 7.. Comparison of simulated and observed wave runups at 118 sites.
ID numbers relate the sites mapped in (A) and (B) to the comparisons of observed versus simulated data graphed in (C). In the maps, sites where runups were observed in the field are depicted by circles, and those observed using time-separated remote sensing are triangles. These symbols are color-coded to depict the discrepancy between observed runups and those predicted by tsunami simulation. In (C), purple and brown bars represent runup observations made in the field and made using remote sensing, respectively. Runups from the tsunami simulation are red bars. In each case, the bars span two estimates of observed and simulated runup at each site (Materials and Methods for details).
Fig. 8.
Fig. 8.. Comparison of simulated and observed water levels.
Sea level data taken from Vuna Wharf (A) and Queen Salote Wharf (B) in the Nuku‘alofa Lagoon (Tongatapu). The tidal signal has been removed and the current tide level set to 0 m at 4:15 UTC. Simulated water levels (red lines) mimic the gauge data through the passage of the Blast 3 and 4 waves, but slightly deviate for the period 5:15 to 5:35 UTC following the arrival of the Blast 5 waves, before falling back into step by 5:40 UTC.
Fig. 9.
Fig. 9.. Blast-coupled waves and conventional tsunami issued from HTHH.
(A) Catches the simulation at 04:57 UTC, 1 min after Blast 5. Travelling close to the speed of sound, the tiny blast-coupled water wave is now 20 km from HTHH. Following behind is the conventional tsunami generated by the explosive displacement of seawater. Note how the 15-Mt blast is sufficient to expose dry seafloor (orange). This “bottoming out” diminishes the efficiency of tsunami generation. The X to X′ transect delivers the cross section through the simulation shown in (B). Here, the red line charts the simulated peak wave height during the time that Blast 5 was active (4:56 to 5:15 UTC). Note that the height of the conventional tsunami as it departs the HTHH crater varies from 85 m in the north to 60 m in the south. Note too how the tsunami interacts with the shallow Tongatapu platform. The wave crossing the fringing reef outboard Tongatapu Island is 18 m high but is efficiently attenuated to only 3 m as it enters the broad lagoon behind the reef. Waves that eventually beach on the north coast of Tongatapu are <2 m high. Unprotected by a fringing reef, the wave visited upon the south coast of Tongatapu is 12 m high.
Fig. 10.
Fig. 10.. Pre- and post-tsunami vegetation damage on Tongatapu.
(A) Location of three examples from southeastern Tongatapu (site IDs 81, 82, and 83) where downed coastal vegetation allows wave runup heights to be estimated from a DEM built from stereo-pairs of WorldView satellite data. (B), (C), and (D) compare the position of the vegetated coastline in pre- (14 January 2022) and post-tsunami (17 January) WorldView imagery for these sites and spot measurements of wave runup from the DEM.

References

    1. C. Timm, D. Bassett, I. J. Graham, M. I. Leybourne, C. E. J. de Ronde, J. Woodhead, D. Layton-Matthews, A. B. Watts, Louisville seamount subduction and its implication on mantle flow beneath the central Tonga–Kermadec arc. Nat. Commun. 4, 1720 (2013). - PubMed
    1. I. E. M. Smith, R. C. Price, The Tonga–Kermadec arc and Havre–Lau back-arc system: their role in the development of tectonic and magmatic models for the western Pacific. J. Volcanol. Geotherm. Res. 156, 315–331 (2006).
    1. F. Lavigne, J. Morin, P. Wassmer, O. Weller, T. Kula, A. V. Maea, K. Kelfoun, F. Mokadem, R. Paris, M. N. Malawani, A. Faral, M. Benbakkar, S. S. Copard, C. M. Vidal, T. Tu’I’afitu, F. Kitekei’aho, M. Trautmann, C. Gomez, Bridging legends and science: field evidence of a large tsunami that affected the Kingdom of Tonga in the 15th Century. Front. Earth Sci. 9, 10.3389/feart.2021.748755, (2021). - DOI
    1. C. Frohlich, M. J. Hornbach, F. W. Taylor, C. C. Shen, 'A. Moala, A. E. Morton, J. Kruger, Huge erratic boulders in Tonga deposited by a prehistoric tsunami. Geology 37, 131–134 (2009).
    1. M. Colombier, B. Scheu, F. B. Wadsworth, S. Cronin, J. Vasseur, K. J. Dobson, K. U. Hess, M. Tost, T. I. Yilmaz, C. Cimarelli, M. Brenna, B. Ruthensteiner, D. B. Dingwell, Vesiculation and quenching during surtseyan Eruptions at Hunga Tonga-Hunga Ha'apai Volcano, Tonga. J. Geophys. Res. Solid Earth 123, 3762–3779 (2018).