. 2023 Jun 2;11(6):720-731.
doi: 10.1158/2326-6066.CIR-22-0795.

Regional Variation in the Tumor Microenvironment, Immune Escape and Prognostic Factors in Breast Cancer in Sub-Saharan Africa

Affiliations

Regional Variation in the Tumor Microenvironment, Immune Escape and Prognostic Factors in Breast Cancer in Sub-Saharan Africa

Marcus Bauer et al. Cancer Immunol Res. .

Abstract

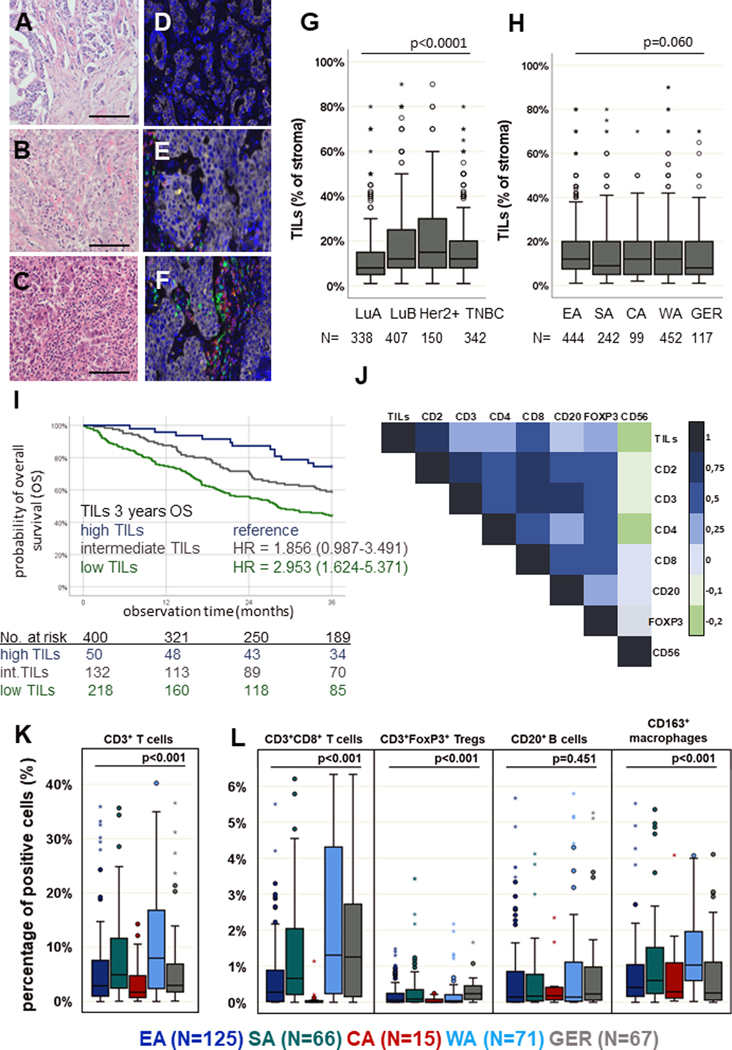
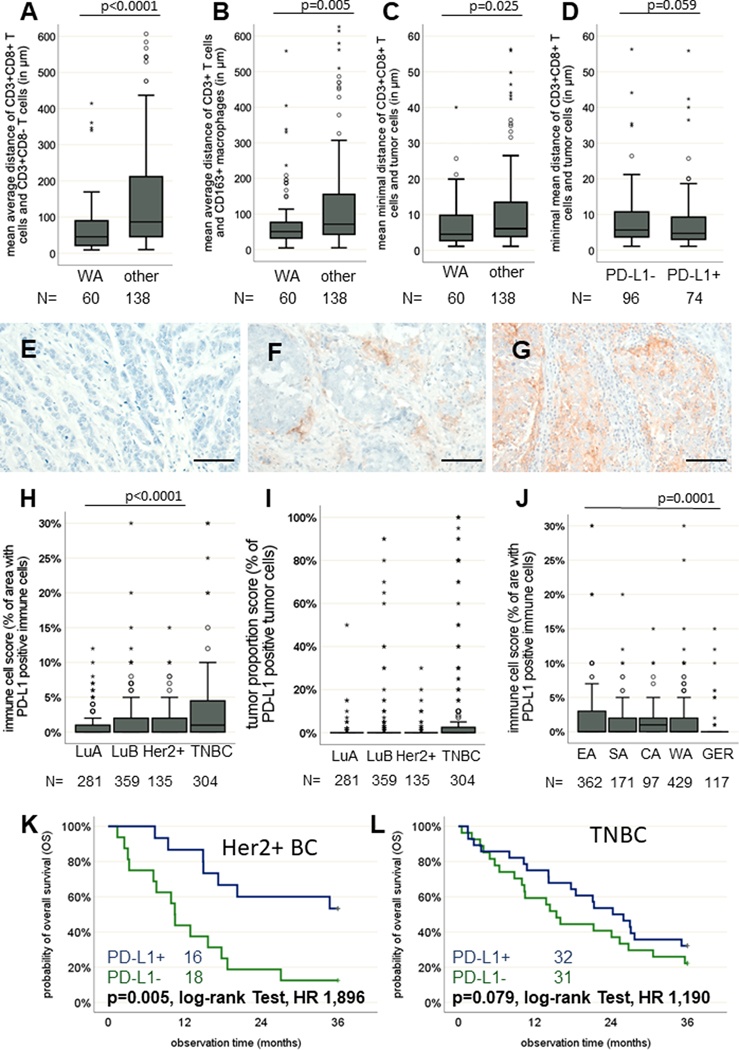
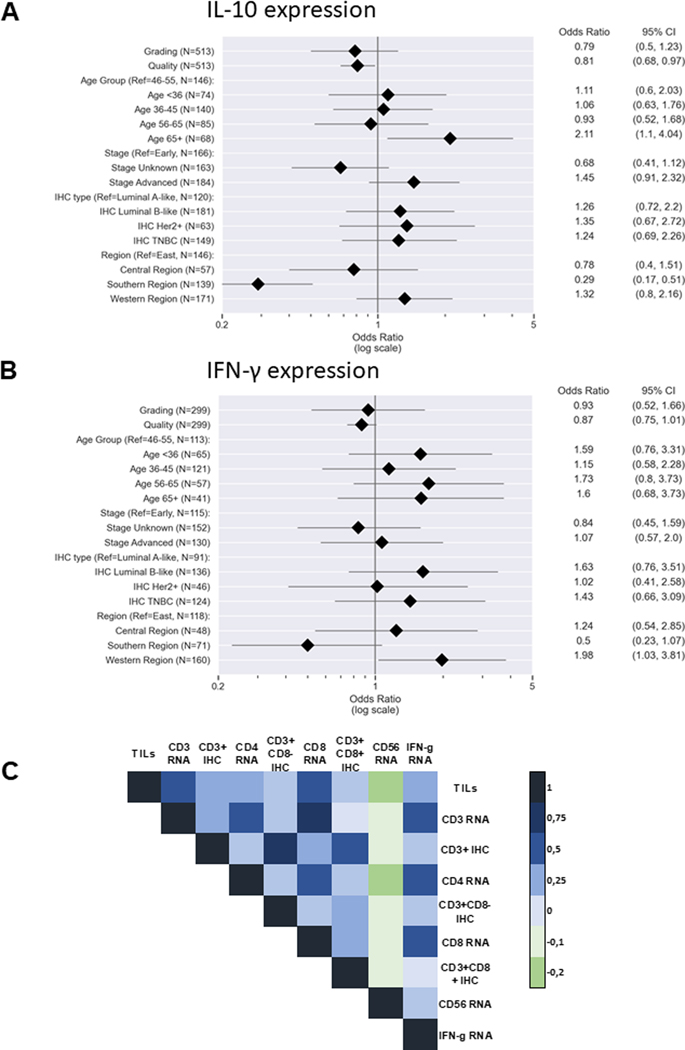
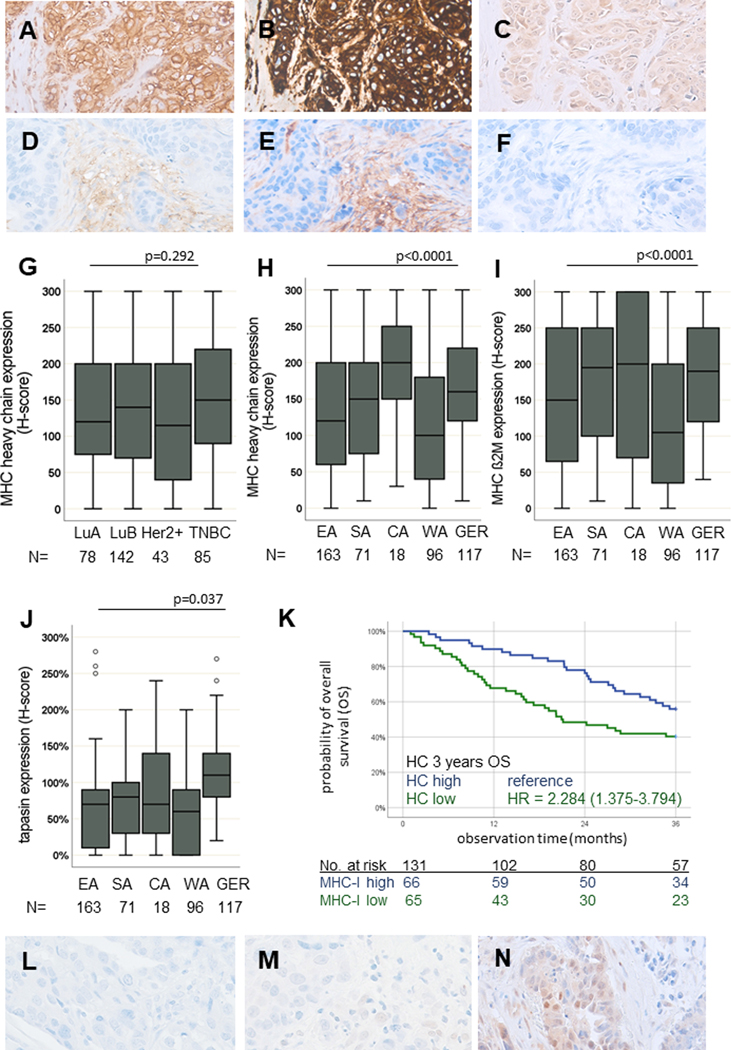
The low overall survival rates of patients with breast cancer in sub-Saharan Africa (SSA) are driven by regionally differing tumor biology, advanced tumor stages at diagnosis, and limited access to therapy. However, it is not known whether regional differences in the composition of the tumor microenvironment (TME) exist and affect patients' prognosis. In this international, multicentre cohort study, 1,237 formalin-fixed, paraffin-embedded breast cancer samples, including samples of the "African Breast Cancer-Disparities in Outcomes (ABC-DO) Study," were analyzed. The immune cell phenotypes, their spatial distribution in the TME, and immune escape mechanisms of breast cancer samples from SSA and Germany (n = 117) were investigated using histomorphology, conventional and multiplex IHC, and RNA expression analysis. The data revealed no regional differences in the number of tumor-infiltrating lymphocytes (TIL) in the 1,237 SSA breast cancer samples, while the distribution of TILs in different breast cancer IHC subtypes showed regional diversity, particularly when compared with German samples. Higher TIL densities were associated with better survival in the SSA cohort (n = 400), but regional differences concerning the predictive value of TILs existed. High numbers of CD163+ macrophages and CD3+CD8+ T cells accompanied by reduced cytotoxicity, altered IL10 and IFNγ levels and downregulation of MHC class I components were predominantly detected in breast cancer samples from Western SSA. Features of nonimmunogenic breast cancer phenotypes were associated with reduced patient survival (n = 131). We therefore conclude that regional diversity in the distribution of breast cancer subtypes, TME composition, and immune escape mechanisms should be considered for therapy decisions in SSA and the design of personalized therapies. See related Spotlight by Bergin et al., p. 705.


Conflict of interest statement

Conflict of interest: The authors declare no potential conflicts of interest.

Figures

Figure 1:
Figure 1:. Tumor-infiltrating lymphocytes (TILs) and their quantitative distribution within the tumor microenvironment (TME) of BC samples.
Representative H&E staining of FFPE BC samples with low (A), intermediate (B) and high (C) infiltration of TILs. Scale bars depict 20 μm. In total, TILs were analyzed in 1,237 samples. MSI was performed on 374 samples with representatively shown pictures with low (D), intermediate (E) and high (F) infiltration of TILs. MSI allows visualization of immune cell subpopulations including CD3+CD8 T cells (yellow), CD3+CD8+ T cells (red), CD3+FOXP3+ T cells (turquoise), CD163+ macrophages (orange) and CD20+ B cells (green) as well as pan-cytokeratin+ cancer cells (grey). (G) Boxplots (line represents the mean) indicating that TILs were found to be higher in luminal-B-like (LuB), human epidermal growth factor receptor 2 positive (Her2+) and triple-negative BC (TNBC) subtypes, compared to luminal-A-like (LuA) (p < 0.0001, multivariate analysis). (H) No differences in the quantity of TILs in different regions in sub-Saharan Africa (SSA) were detected (Eastern Africa, EA; Southern Africa, SA; Central Africa, CA; Western Africa, WA), while the TIL frequency was tendentially lower in German (GER) BC samples. (I) Kaplan-Meier curve: the amounts of TILs indicates a prognostic impact with poorer survival in BC with lower numbers of TILs (p = 0.001, log-rank Test). (J) Pearson correlation map with association levels: a higher numbers of TILs are linked with increased frequencies of all immune cell subpopulations analysed. Pearson correlation coefficients are represented by different colours defined in the scale bar on the right side of the correlation map. The immune cell subpopulations analysed by MSI revealed higher numbers of CD3+ T cells (K), CD3+CD8+ T cells and CD163+ macrophages (M2) (L) in WA. No relevant difference in the frequency of CD20+ B cells was shown. However, in GER samples, the frequency of Tregs was slightly higher when compared to those in all regions of SSA. Except for the log-rank tests, all p-values were estimated in multivariate analyses and are adjusted for differences in age, grading, quality score, stage, IHC subtype and region of origin as confounding factors. All p-values are shown in the graphs.
Figure 2:
Figure 2:. Spatial immune cell distribution in synopsis with PD-L1 expression in BC of SSA.
Boxplots (line represents the mean) showing that regardless of PD-L1 expression, a closer proximity of CD3+CD8 and CD3+CD8+ T cells is evident for Western SSA (WA) samples (A). A closer spatial proximity of CD3+ T cells and CD163+ macrophages exist in WA (B). Finally, a closer spatial proximity of CD3+CD8+ T cells and tumor cells was present in WA samples as well (C). Depending on the PD-L1 status, minor differences in the spatial proximity of CD3+CD8+ T cells and tumor cells could be shown, with a slightly higher proximity in PD-L1-positive samples (D). Representative IHC staining of BC samples without (E) and with low (F) and high (G) PD-L1 expression. Scale bars depict 50 μm. The prevalence of both BC samples positive for PD-L1, analysed with the immune cell score (H) and the tumor proportion score (I), was higher in triple-negative BC (TNBC). However, only minor differences were seen in the respective regions within SSA (J), while PD-L1 expression was significantly lower in GER samples. Kaplan-Meier curves show better OS of patients with PD-L1 BC in both (K) Her2+ and (L) TNBC subtypes. Except for the log-rank tests, all p-values were estimated in multivariate analyses and are adjusted for differences in age, grading, quality score, stage, IHC subtype and region of origin as confounding factors.
Figure 3:
Figure 3:. Cytokine expression and its influence on immune cell infiltration.
The expression of (A) interleukin (IL)-10 and (B) interferon-gamma (IFN-γ) is visualized with forest plots. Only samples with detectable RNA of the respective genes were considered. The different sample sizes correspond to the number of specimens for which data were available for all variables examined in each test. Pearson correlation map (C) showing the connection of IFN-γ expression and tumor-infiltrating lymphocytes (TILs) and immune cell subpopulations. Pearson correlation coefficient is displayed by different colours defined in the scale bar on the right-hand side of the figure.
Figure 4:
Figure 4:. JAK/STAT signalling and MHC class I pathway component expression in SSA.
Representative IHC stainings of BC samples with MHC class I HC (A, D), β2-m (B, E) and the APM component tpn (C, F) are shown with no or weak and strong staining patterns, respectively. A lower expression of HC (H), β2-m (I) and tpn (J) was found in WA, while no differences can be demonstrated in the respective intrinsic subtypes (G). (K) The prognostic influence of MHC class I expression is representatively shown for HC. Kaplan-Meier curve illustrates poor survival in patients with low HC expression in SSA (p = 0.006, log-rank test). Activation of IFN-γ signalling via phosphorylated pSTAT1 is shown with representative low, intermediate and high nuclear expression analysed by IHC (L-M). All p-values were estimated in multivariate analyses and are adjusted for differences in age, grading, quality score, stage, IHC subtype and region of origin as confounding factors.

Comment in

References

    1. Ferlay J, Colombet M, Soerjomataram I, Mathers C, Parkin DM, Piñeros M, et al. Estimating the global cancer incidence and mortality in 2018: GLOBOCAN sources and methods. Int J Cancer. 2019. Apr 15;144(8):1941–53. - PubMed
    1. Hamdi Y, Abdeljaoued-Tej I, Zatchi AA, Abdelhak S, Boubaker S, Brown JS, et al. Cancer in Africa: The Untold Story. Front Oncol. 2021;11:650117. - PMC - PubMed
    1. Sung H, Ferlay J, Siegel RL, Laversanne M, Soerjomataram I, Jemal A, et al. Global Cancer Statistics 2020: GLOBOCAN Estimates of Incidence and Mortality Worldwide for 36 Cancers in 185 Countries. CA Cancer J Clin. 2021. May;71(3):209–49. - PubMed
    1. Weiner CM, Mathewos A, Addissie A, Ayele W, Aynalem A, Wondemagegnehu T, et al. Characteristics and follow-up of metastatic breast cancer in Ethiopia: A cohort study of 573 women. Breast Edinb Scotl. 2018. Dec;42:23–30. - PubMed
    1. McKenzie F, Zietsman A, Galukande M, Anele A, Adisa C, Parham G, et al. Drivers of advanced stage at breast cancer diagnosis in the multicountry African breast cancer - disparities in outcomes (ABC-DO) study. Int J Cancer. 2018. Apr 15;142(8):1568–79. - PMC - PubMed

Publication types