

Peripheral Intravenous Waveform Analysis Responsiveness to Subclinical Hemorrhage in a Rat Model
- PMID: 37058731
- PMCID: PMC11578258
- DOI: 10.1213/ANE.0000000000006349
Peripheral Intravenous Waveform Analysis Responsiveness to Subclinical Hemorrhage in a Rat Model
Abstract
Background: Early detection and quantification of perioperative hemorrhage remains challenging. Peripheral intravenous waveform analysis (PIVA) is a novel method that uses a standard intravenous catheter to detect interval hemorrhage. We hypothesize that subclinical blood loss of 2% of the estimated blood volume (EBV) in a rat model of hemorrhage is associated with significant changes in PIVA. Secondarily, we will compare PIVA association with volume loss to other static, invasive, and dynamic markers.
Methods: Eleven male Sprague Dawley rats were anesthetized and mechanically ventilated. A total of 20% of the EBV was removed over ten 5 minute-intervals. The peripheral intravenous pressure waveform was continuously transduced via a 22-G angiocatheter in the saphenous vein and analyzed using MATLAB. Mean arterial pressure (MAP) and central venous pressure (CVP) were continuously monitored. Cardiac output (CO), right ventricular diameter (RVd), and left ventricular end-diastolic area (LVEDA) were evaluated via transthoracic echocardiogram using the short axis left ventricular view. Dynamic markers such as pulse pressure variation (PPV) were calculated from the arterial waveform. The primary outcome was change in the first fundamental frequency (F1) of the venous waveform, which was assessed using analysis of variance (ANOVA). Mean F1 at each blood loss interval was compared to the mean at the subsequent interval. Additionally, the strength of the association between blood loss and F1 and each other marker was quantified using the marginal R2 in a linear mixed-effects model.
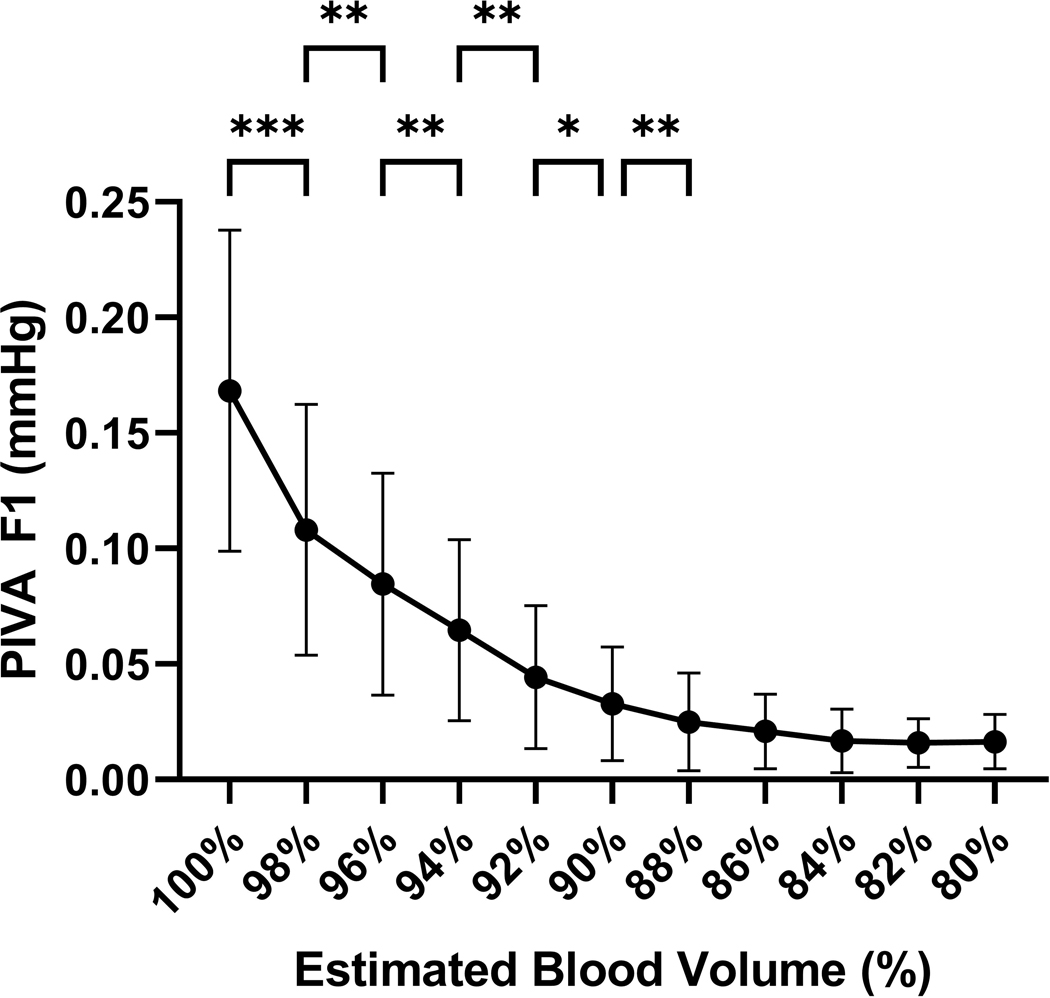
Results: PIVA derived mean F1 decreased significantly after hemorrhage of only 2% of the EBV, from 0.17 to 0.11 mm Hg, P = .001, 95% confidence interval (CI) of difference in means 0.02 to 0.10, and decreased significantly from the prior hemorrhage interval at 4%, 6%, 8%, 10%, and 12%. Log F1 demonstrated a marginal R2 value of 0.57 (95% CI 0.40-0.73), followed by PPV 0.41 (0.28-0.56) and CO 0.39 (0.26-0.58). MAP, LVEDA, and systolic pressure variation displayed R2 values of 0.31, and the remaining predictors had R2 values ≤0.2. The difference in log F1 R2 was not significant when compared to PPV 0.16 (95% CI -0.07 to 0.38), CO 0.18 (-0.06 to 0.04), or MAP 0.25 (-0.01 to 0.49) but was significant for the remaining markers.
Conclusions: The mean F1 amplitude of PIVA was significantly associated with subclinical blood loss and most strongly associated with blood volume among the markers considered. This study demonstrates feasibility of a minimally invasive, low-cost method for monitoring perioperative blood loss.
Copyright © 2023 International Anesthesia Research Society.
Conflict of interest statement
Conflicts of Interest: See Disclosures at the end of the article.
Figures


References
-
- Trauma CTJ and Special Emergencies. In: Ellinas HMK, ALrayashi W, Bilge A ed. Clinical Pediatric Anesthesiology. McGraw Hilla; 2021:265.
-
- Blain S, Paterson N. Paediatric massive transfusion. Bja Education. 2016;16(8):269–275.
-
- Gan H, Cannesson M, Chandler JR, Ansermino JM. Predicting fluid responsiveness in children: a systematic review. Anesth Analg. 2013;117(6):1380–1392. - PubMed
-
- Stricker PA, Lin EE, Fiadjoe JE, et al. Evaluation of central venous pressure monitoring in children undergoing craniofacial reconstruction surgery. Anesth Analg. 2013;116(2):411–419. - PubMed
-
- Gelman S, Warner DS, Warner MA. Venous function and central venous pressure: a physiologic story. The Journal of the American Society of Anesthesiologists. 2008;108(4):735–748. - PubMed
Publication types
MeSH terms
Grants and funding
LinkOut - more resources
Full Text Sources
