

From adenoma to CRC stages: the oral-gut microbiome axis as a source of potential microbial and metabolic biomarkers of malignancy
- PMID: 37058886
- PMCID: PMC10130693
- DOI: 10.1016/j.neo.2023.100901
From adenoma to CRC stages: the oral-gut microbiome axis as a source of potential microbial and metabolic biomarkers of malignancy
Abstract
Background: Approximately 95% of Colorectal cancers (CRC) consist of adenocarcinomas originating from colonic Adenomatous polyps (AP). Increasing importance in CRC occurrence and progression has been attributed to the gut microbiota; however, a huge proportion of microorganisms inhabit the human digestive system. So, to comprehensively study the microbial spatial variations and their role in CRC progression, from AP to the different CRC phases, a holistic vision is imperative, including the simultaneous evaluation of multiple niches from the gastrointestinal system. Through an integrated approach, we identified potential microbial and metabolic biomarkers, able to discriminate human CRC from AP and/or also the different Tumor node metastasis (TNM) staging. In addition, as the microbiota contributes to the production of essential metabolic products detectable in fecal samples, we analysed and compared metabolites obtained from CRC and AP patients by using a Nuclear magnetic resonance (NMR) approach.
Methods: In this observational study, saliva, tissue and stool samples from 61 patients, have been collected, including 46 CRC and 15 AP patients, age and sex-matched, undergoing surgery in 2018 at the Careggi University Hospital (Florence, Italy). First, the microbiota in the three-district between CRC and AP patients has been characterized, as well as in different CRC TNM stages. Subsequently, proton NMR spectroscopy has been used in combination with multivariate and univariate statistical approaches, to define the fecal metabolic profile of a restricted group of CRC and AP patients.
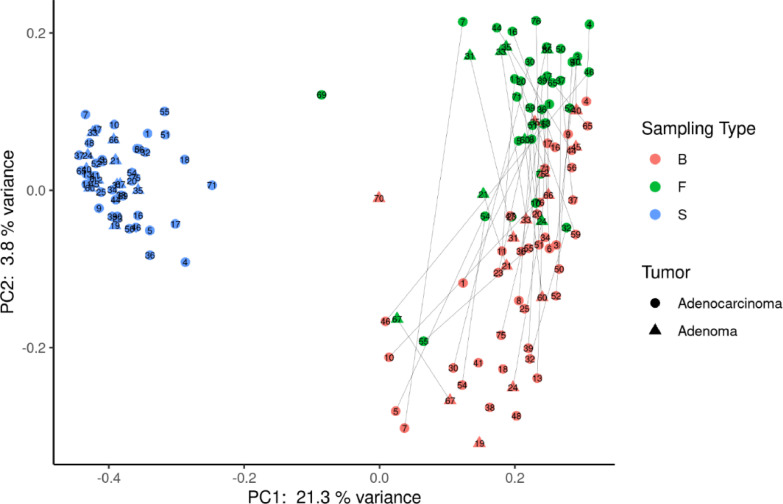
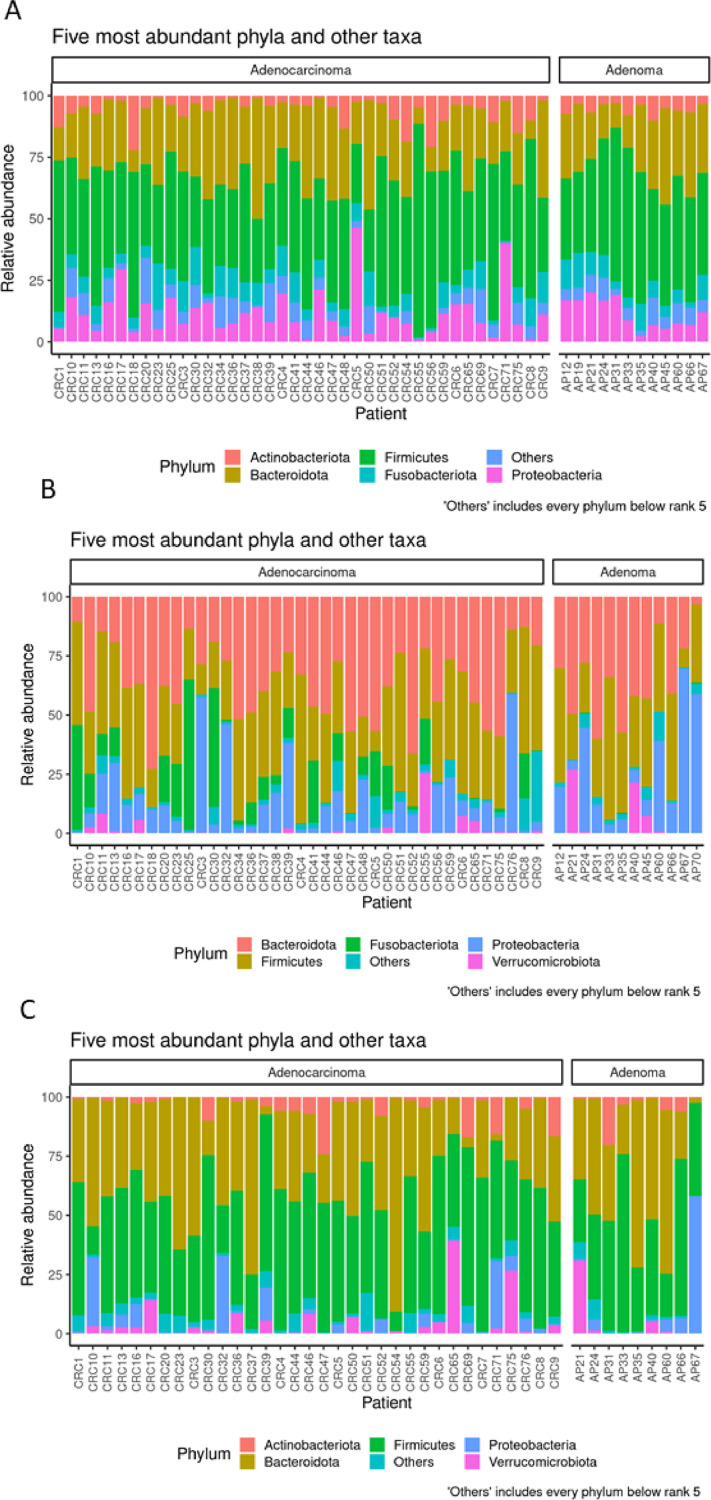
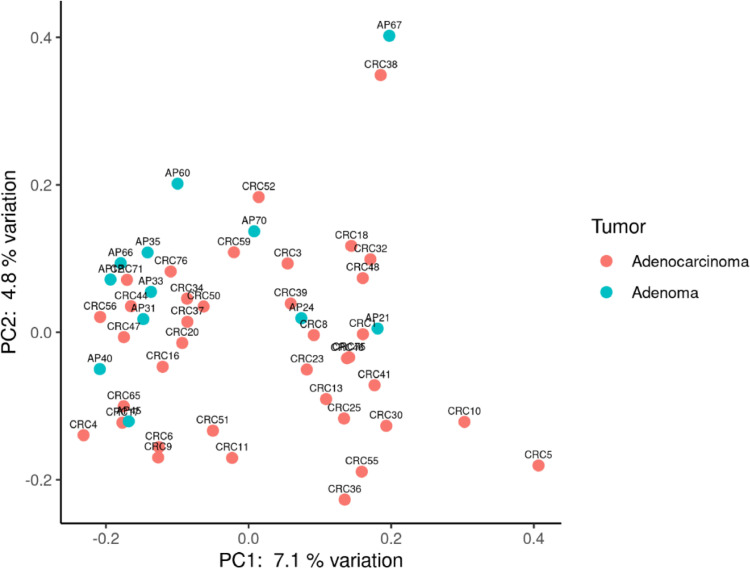
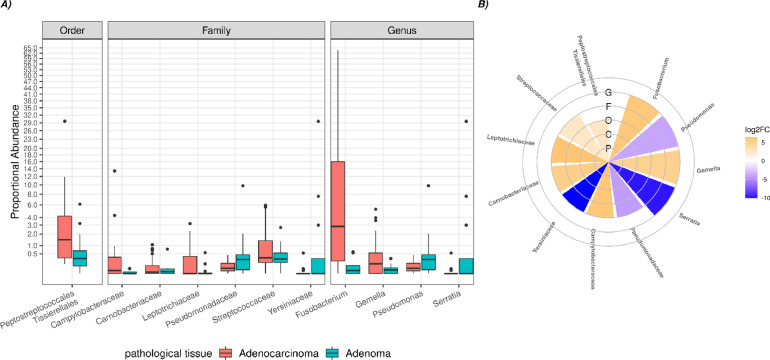
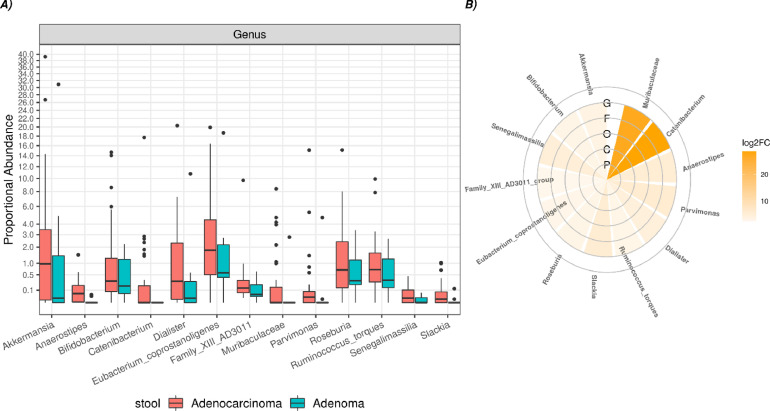
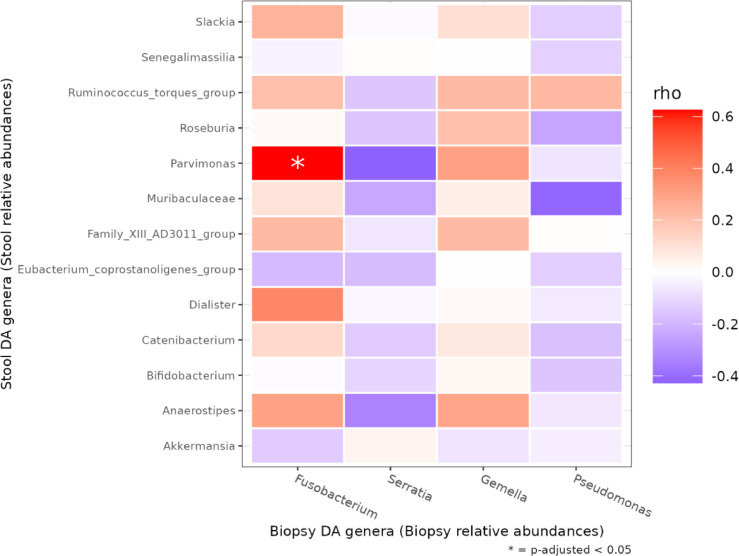
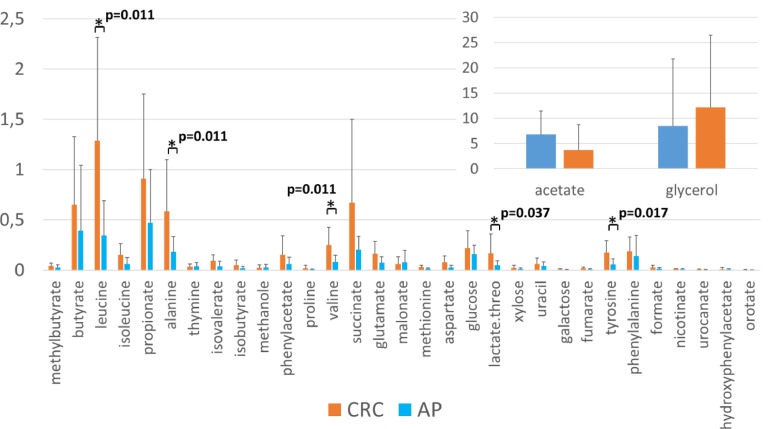
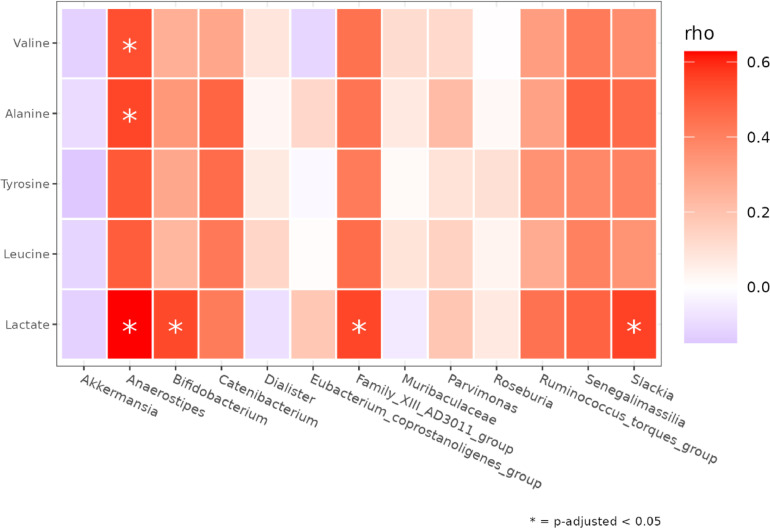
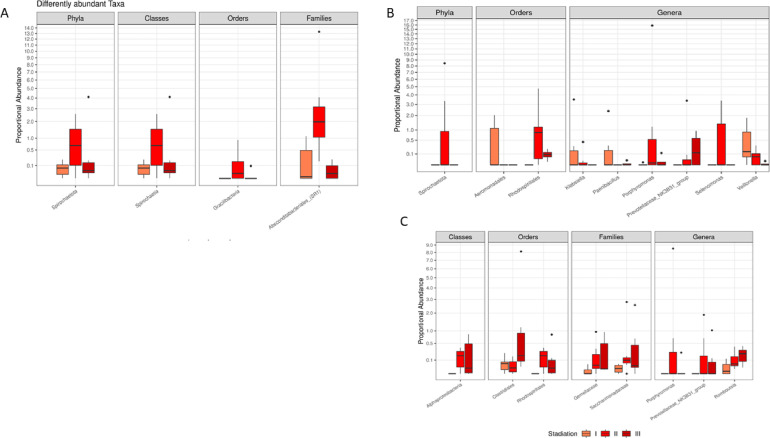
Results: CRC patients display a different profile of tissue and fecal microbiota with respect to AP patients. Significant differences have been observed in CRC tissue microbial clades, with a rise of the Fusobacterium genus. In addition, significant taxa increase at the genus level has been observed in stool samples of CRC patients. Furthermore, Fusobacterium found in intestinal tissue has been positively correlated with fecal Parvimonas, for the first time. Moreover, as predicted by metagenomics pathway analysis, a significant increase of lactate (p=0.037) has been observed in the CRC fecal metabolic profiles, and positively correlated with Bifidobacterium (p=0.036). Finally, minor bacterial differences in CRC patients at stage T2 (TNM classification) have been detected, with a raise of the Spirochaetota phylum in CRC samples, with a slight increase of the Alphaproteobacteria class in fecal samples.
Conclusion: Our results suggest the importance of microbiota communities and oncometabolites in CRC development. Further studies on CRC/AP management with a focus on CRC assessment are needed to investigate novel microbial-related diagnostic tools aimed to improve therapeutic interventions.
Keywords: Microbiota; biomarkers; cancer staging; colonic adenomatous polyps; colorectal cancer; metabolomics; microbiota.
Copyright © 2023. Published by Elsevier Inc.
Conflict of interest statement
Declaration of Competing Interest No conflict of interest.
Figures
References
-
- Russo Edda, A.A., The Role of the Microbiota in the Genesis of Gastrointestinal Cancers, in Frontiers in Anti-Infective Drug Discovery. Pp. 1-44 (44).
-
- Wong S.H., Yu J. Gut microbiota in colorectal cancer: mechanisms of action and clinical applications. Nat Rev Gastroenterol Hepatol. 2019;16(11):690–704. - PubMed
Publication types
MeSH terms
Substances
LinkOut - more resources
Full Text Sources
Medical
Molecular Biology Databases
