. 2023 Jun:62:102698.
doi: 10.1016/j.redox.2023.102698. Epub 2023 Apr 10.

NOX4 as a critical effector mediating neuroinflammatory cytokines, myeloperoxidase and osteopontin, specifically in astrocytes in the hippocampus in Parkinson's disease

Affiliations

NOX4 as a critical effector mediating neuroinflammatory cytokines, myeloperoxidase and osteopontin, specifically in astrocytes in the hippocampus in Parkinson's disease

Napissara Boonpraman et al. Redox Biol. 2023 Jun.

Abstract

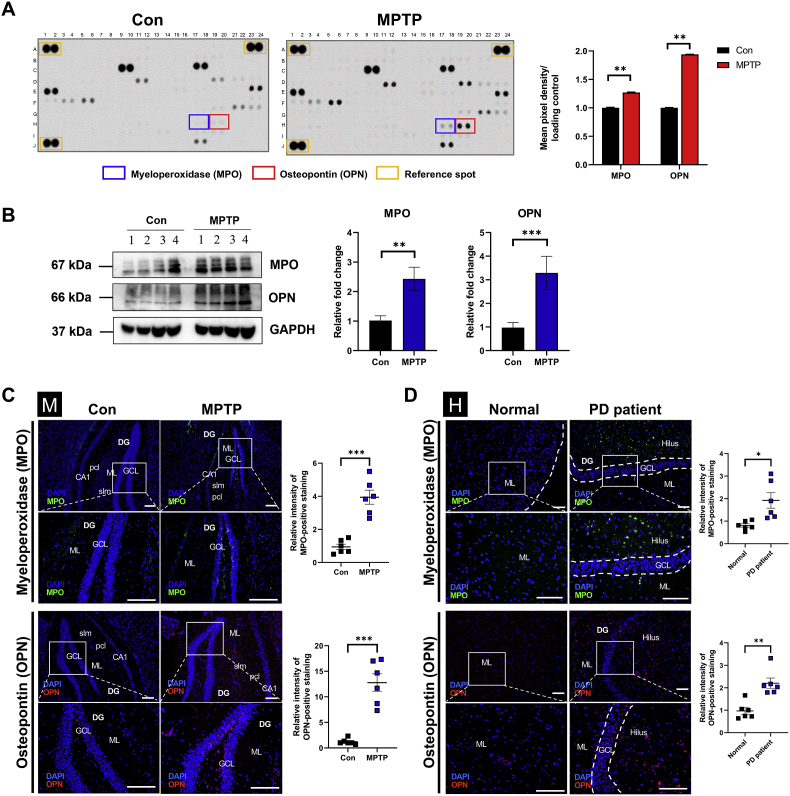
Oxidative stress and mitochondrial dysfunction have been believed to play an important role in the pathogenesis of aging and neurodegenerative diseases, including Parkinson's disease (PD). The excess of reactive oxygen species (ROS) increases with age and causes a redox imbalance, which contributes to the neurotoxicity of PD. Accumulating evidence suggests that NADPH oxidase (NOX)-derived ROS, especially NOX4, belong to the NOX family and is one of the major isoforms expressed in the central nervous system (CNS), associated with the progression of PD. We have previously shown that NOX4 activation regulates ferroptosis via astrocytic mitochondrial dysfunction. We have previously shown that activation of NOX4 regulates ferroptosis through mitochondrial dysfunction in astrocytes. However, it remains unclear why an increase in NOX4 in neurodegenerative diseases leads to astrocyte cell death by certain mediators. Therefore, this study was designed to evaluate how NOX4 in the hippocampus is involved in PD by comparing an MPTP-induced PD mouse model compared to human PD patients. We could detect that the hippocampus was dominantly associated with elevated levels of NOX4 and α-synuclein during PD and the neuroinflammatory cytokines, myeloperoxidase (MPO) and osteopontin (OPN), were upregulated particularly in astrocytes. Intriguingly, NOX4 suggested a direct intercorrelation with MPO and OPN in the hippocampus. Upregulation of MPO and OPN induces mitochondrial dysfunction by suppressing five protein complexes in the mitochondrial electron transport system (ETC) and increases the level of 4-HNE leading to ferroptosis in human astrocytes. Overall, our findings indicate that the elevation of NOX4 cooperated with the MPO and OPN inflammatory cytokines through mitochondrial aberration in hippocampal astrocytes during PD.

Keywords: Hippocampus; Mitochondria; Myeloperoxidase; NADPH oxidase 4 (NOX4); Osteopontin; Parkinson's disease.


Conflict of interest statement

Declaration of competing interest The authors declare that they have no known competing financial interests or personal relationships that could have appeared to influence the work reported in this paper.

Figures

Image 1
Graphical abstract
Fig. 1
Fig. 1
NOX4 is significantly upregulated in astrocytes of the hippocampus in PD models. (A, B) Images and quantification of NOX4 expression in different regions of the human brain (hippocampus and cerebellum) and the PD mice model (striatum, hippocampus, substantia nigra, cerebellum). (C, D) Representative double-immunofluorescence images and quantification of PD patients and PD mouse models for NOX4 using Alexa flour 488 (green) in combination with the astrocyte marker GFAP (Texas red) or with the neuron-specific marker NeuN (Texas red). Cell nuclei were stained with DAPI (blue) for visualization. Scale bar: 125 and 300 μm (E) Immunoblot analysis and quantification of NOX4, GFAP, and NeuN levels from hippocampal lysates of a MPTP-induced PD mouse model compared to control. GAPDH was used as a loading control. Values are means ± standard error of the mean (SEM). *, p < 0.05; **, p < 0.01; ***, p < 0.001 (one-way ANOVA test or Student's t-test) vs control, aca: anterior commissure, anterior part, CA1: field CA1 hippocampus; Cpu: Caudate putamen (striatum); DG: Dentate gyrus; GCL: granular layer; ML: molecular layer; PBP: parabrachial pigmented nucleus of the VTA; pcl: pyramidal cell layer; PCL: purkinje cell layer; slm: stratum lacunosum-molecular; SNc: substantia nigra pars compacta; SNr: substantia nigra pars reticulate; VTA: ventral tegmental area. (For interpretation of the references to colour in this figure legend, the reader is referred to the Web version of this article.)
Fig. 2
Fig. 2
Myeloperoxidase (MPO) and Osteopontin (OPN) are dominantly elevated in hippocampus in PD models. (A) Representative images and quantification of the Proteome Profiler Mouse XL Cytokines Array immunoblot analysis of 111 different cytokines, chemokines, growth factors, or extracellular signaling molecules of the MPTP hippocampus and control groups. (B) Representative immunoblot analysis and quantification of OPN and MPO levels in MPTP groups compared to control groups. For immunoblots, GAPDH was used as a loading control. Data are representative of three independent experiments. (C, D) Immunofluorescence staining and quantification of MPO and OPN, labeled with Alexa Fluor 546-conjugated antibody (red) in the hippocampal brain of MPTP mice and a PD patient. Scale bar: 300 and 125 μm. Cell nuclei were stained using DAPI (blue) for visualization. Scale bar: 300 μm and 125 μm. DG: Dentate gyrus; ML: molecular layer; GCL: granule cell layer. Data are mean ± standard error of the mean (SEM); *, p < 0.05; **, p < 0.01; ***, p < 0.001 vs control by Student's two-tailed t-test. (For interpretation of the references to colour in this figure legend, the reader is referred to the Web version of this article.)
Fig. 3
Fig. 3
Myeloperoxidase (MPO) and Osteopontin (OPN) are highly increased in hippocampal astrocytes in PD models. (A, B) Representative visualization by immunofluorescence of OPN or MPO (red) expression on astrocyte markers (GFAP) and neuronal markers (NeuN) (green) in PD mice and humans. Cell nuclei were stained using DAPI (blue) for visualization. (C, D) Quantification of MPO and OPN in the hippocampal brain of MPTP mice and PD patients co-localized with GFAP and NeuN. Scale bar: 125 μm. DG: Dentate gyrus; ML: molecular layer; GCL: granule cell layer. Data are mean ± standard error of the mean (SEM); *, p < 0.05; **, p < 0.01; ***, p < 0.001 vs. control by Student's two-tailed t-test. (For interpretation of the references to colour in this figure legend, the reader is referred to the Web version of this article.)
Fig. 4
Fig. 4
Myeloperoxidase (MPO) and Osteopontin (OPN) expressions mediated by NOX4 in astrocytes in PD models. Representative images of immunofluorescence staining and quantification for OPN or MPO (red) expressing on astrocyte markers (GFAP) (green) in the hippocampus of control, MPTP, NOX4 knockout and NOX4 knockout mice with MPTP administration. Cell nuclei were stained using DAPI (blue) for visualization. Scale bar: 125 μm. DG: Dentate gyrus; ML: molecular layer; GCL: granule cell layer. Data are mean ± standard error of the mean (SEM); *, p < 0.05; **, p < 0.01; ***, p < 0.001 vs. control by Student's two-tailed t-test. (For interpretation of the references to colour in this figure legend, the reader is referred to the Web version of this article.)
Fig. 5
Fig. 5
Upregulation of Myeloperoxidase (MPO) and Osteopontin (OPN) induces cell death in human astrocytes. (A) Representative images of human astrocytes transfected with MPO- or OPN- GFP-tagged plasmids. (B) Representative 3D images of control and MPO and OPN overexpression in human astrocytes. (C) Quantification of the morphological dead cells (%) in control compared to MPO and OPN overexpressing human astrocytes. Scale bars: 20 μm. Data are mean ± standard error of the mean (SEM); *, p < 0.05; **, p < 0.01; ***, p < 0.001 vs. control by Student's two-tailed t-test.
Fig. 6
Fig. 6
Elevated Myeloperoxidase (MPO) and Osteopontin (OPN) promote mitochondrial dysfunction and increase lipid peroxidation in human astrocytes. (A) Images and quantification of immunoblot analysis for five mitochondrial ETC protein levels, including Complex I (CI (NDUFB8)), Complex II (CII (SDHB)), Complex III (CIII (UQCRC2)), Complex IV (CIV (MTCO1)), and Complex V (CV (ATP5F1A)) in control and overexpressing MPO and OPN human astrocytes. (B) Representative images of immunofluorescence for 4-HNE expression (red) with astrocyte marker (GFAP) (green) and percentage of 4-HNE-positive cells on overexpression of MPO and OPN in human astrocytes compared to control. DAPI staining is shown in blue. Scale bar; 125 μm. (C) Immunoblot analysis images and quantification of 4-HNE protein levels of MPO and OPN overexpressing human astrocytes. (D) mtROS levels and quantification using MitoSOX staining in human astrocytes of control (Con) and MPO and OPN overexpression. Data are mean ± standard error of the mean (SEM); *, p < 0.05; **, p < 0.01; ***, p < 0.001 vs. control by Student's two-tailed t-test. (For interpretation of the references to colour in this figure legend, the reader is referred to the Web version of this article.)
Fig. 7
Fig. 7
Schematic diagram of a possible pathway contributing to PD in the astrocytic hippocampus. The red arrows indicate growth. The yellow arrows follow the MPO path, and the orange arrows follow the OPN path. (For interpretation of the references to colour in this figure legend, the reader is referred to the Web version of this article.)
Fig S1.
Fig S1
Schematic representation of the experimental procedure, drug administration, and behavioral test. In an animal model of chronic phase Parkinson’s disease, MPTP∙HCl (30 mg·kg-1·d-1) is injected intraperitoneally into male C57BL/6j mice for 30 days and a control group is treated with 0.9% saline. Movement deficits were tested with a rotarod on day 7 after treatment (post-intoxication). Then, the brain and blood samples are extracted, followed by histological and protein analysis.
Fig S2.
Fig S2
Chronic MPTP treatment leads to dopaminergic neuron loss in mice. (A) Representative images and quantification of Nissl-stained neurons in the substantia nigra (B) Immunohistochemistry images and quantification of TH-positive dopaminergic neurons in the substantia nigra. (C) Immunohistochemistry images and quantification of TH-positive fibers in the striatum after chronic MPTP intoxication of mice compared to the control. Scale bar 300 μm. Values are means ± standard error of the mean (SEM). *, p < 0.05; **, p < 0.01; ***, p < 0.001 vs. control by Student’s t-test, aca: anterior commissure, anterior part, Cpu: Caudate putamen (striatum); PBP: parabrachial pigmented nucleus of the VTA; slm: stratum lacunosum-moleculare; SNc: substantia nigra Pars compacta; SNr: substantia nigra pars reticulate; VTA: ventral tegmental area.
Fig S3.
Fig S3
Measurement of body weight, food intake and water consumption in the control and MPTP groups (n = 12 per group). Body weight was measured at the same time each day for seven weeks. Data are the mean ± standard error of the mean (SEM).
Fig S4.
Fig S4
MPTP induces alpha-synuclein in the hippocampus and disrupts motor function in a PD mice model. (A) Representative images and quantification of immunohistochemistry for alpha-synuclein of PD patients and MPTP-induced PD mice models. Scale bar 300 μm. (B) The effect of rotarod test in a mouse model of Parkinson’s disease (PD) induced by MPTP at a fixed speed at 10, 20, 30 and 40 rpm for 120 s. The animals were tested three times at each speed with a 5 min break between each trial. Values are means ± standard error of the mean (SEM). *, p < 0.05; **, p < 0.01; ***, p < 0.001 (one-way ANOVA test or Student’s t-test) vs. control.
Fig S5.
Fig S5
NOX4 expression on microglia cells in the hippocampus of patients with PD and MPTP-treated mice. Representative double-immunofluorescence images of PD patients and MPTP mice models for NOX4 using Alexa flour 594 (red) in combination with the Iba-1-positive microglial markers (green) in the hippocampus. DAPI-stained nuclei are shown in blue. Scale bar: 125 µm. DG: Dentate gyrus; ML: molecular layer; GCL: granule cell layer. Data are mean ± standard error of the mean (SEM); *, p < 0.05; **, p < 0.01; ***, p < 0.001 vs. control by Student’s two-tailed t-test.
Fig S6.
Fig S6
Profiling proteins of array membranes blot of hippocampal lysates. (A) Representative images of the Proteome Profiler Mouse XL Cytokines Array for immunoblot analysis of 111 different cytokines, chemokines, growth factors or extracellular signaling molecules from MPTP and control group hippocampi. (B) The quantification of immunoblot analysis between control and MPTP mice. Reference spots are used as a loading control.
Fig S7.
Fig S7
The expression of Myeloperoxidase (MPO) and Osteopontin (OPN) in control and NOX4 knockout mice. Representative images of immunofluorescence staining and quantification of OPN or MPO (red) expression on astrocyte markers (GFAP) and neuronal markers (NeuN) (green) in the control hippocampal brain and that of NOX4 knockout mice. Cell nuclei were stained using DAPI (blue) for visualization. Scale bar: 125 µm. DG: Dentate gyrus; ML: molecular layer; GCL: granule cell layer. Data are mean ± standard error of the mean (SEM); *, p < 0.05; **, p < 0.01; ***, p < 0.001 vs control by Student’s two-tailed t-test.

References

    1. Aarsland D., Batzu L., Halliday G.M., Geurtsen G.J., Ballard C., Ray Chaudhuri K., Weintraub D. Parkinson disease-associated cognitive impairment. Nat. Rev. Dis. Prim. 2021;7(1):47. - PubMed
    1. Zaman V., Shields D.C., Shams R., Drasites K.P., Matzelle D., Haque A., Banik N.L. Cellular and molecular pathophysiology in the progression of Parkinson's disease. Metab. Brain Dis. 2021;36(5):815–827. - PMC - PubMed
    1. Wright R. Mitochondrial dysfunction and Parkinson's disease. Nat. Neurosci. 2022;25(1):2. - PubMed
    1. Winklhofer K.F., Haass C. Mitochondrial dysfunction in Parkinson's disease. Biochim. Biophys. Acta. 2010;1802(1):29–44. - PubMed
    1. Dias V., Junn E., Mouradian M.M. The role of oxidative stress in Parkinson's disease. J. Parkinsons Dis. 2013;3(4):461–491. - PMC - PubMed

Further reading

    1. Davies M.J., Hawkins C.L. The role of myeloperoxidase in biomolecule modification, chronic inflammation, and disease. Antioxidants Redox Signal. 2020;32(13):957–981. - PubMed
    1. Volkman R., Ben-Zur T., Kahana A., Garty B.Z., Offen D. Myeloperoxidase deficiency inhibits cognitive decline in the 5XFAD mouse model of alzheimer's disease. Front. Neurosci. 2019;13:990. - PMC - PubMed

Publication types