. 2023 Jun:62:102696.
doi: 10.1016/j.redox.2023.102696. Epub 2023 Apr 5.

Elevated branched-chain amino acid promotes atherosclerosis progression by enhancing mitochondrial-to-nuclear H2O2-disulfide HMGB1 in macrophages

Affiliations

Elevated branched-chain amino acid promotes atherosclerosis progression by enhancing mitochondrial-to-nuclear H2O2-disulfide HMGB1 in macrophages

Shuai Zhao et al. Redox Biol. 2023 Jun.

Abstract

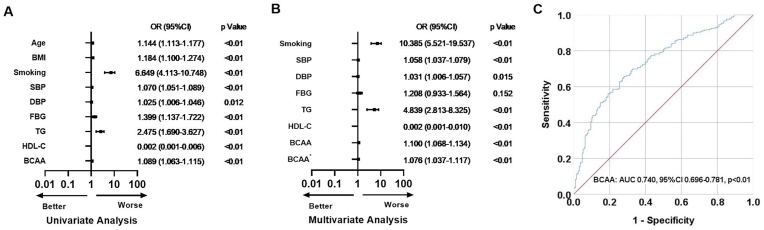
As the essential amino acids, branched-chain amino acid (BCAA) from diets is indispensable for health. BCAA supplementation is often recommended for patients with consumptive diseases or healthy people who exercise regularly. Latest studies and ours reported that elevated BCAA level was positively correlated with metabolic syndrome, diabetes, thrombosis and heart failure. However, the adverse effect of BCAA in atherosclerosis (AS) and its underlying mechanism remain unknown. Here, we found elevated plasma BCAA level was an independent risk factor for CHD patients by a human cohort study. By employing the HCD-fed ApoE-/- mice of AS model, ingestion of BCAA significantly increased plaque volume, instability and inflammation in AS. Elevated BCAA due to high dietary BCAA intake or BCAA catabolic defects promoted AS progression. Furthermore, BCAA catabolic defects were found in the monocytes of patients with CHD and abdominal macrophages in AS mice. Improvement of BCAA catabolism in macrophages alleviated AS burden in mice. The protein screening assay revealed HMGB1 as a potential molecular target of BCAA in activating proinflammatory macrophages. Excessive BCAA induced the formation and secretion of disulfide HMGB1 as well as subsequent inflammatory cascade of macrophages in a mitochondrial-nuclear H2O2 dependent manner. Scavenging nuclear H2O2 by overexpression of nucleus-targeting catalase (nCAT) effectively inhibited BCAA-induced inflammation in macrophages. All of the results above illustrate that elevated BCAA promotes AS progression by inducing redox-regulated HMGB1 translocation and further proinflammatory macrophage activation. Our findings provide novel insights into the role of animo acids as the daily dietary nutrients in AS development, and also suggest that restricting excessive dietary BCAA consuming and promoting BCAA catabolism may serve as promising strategies to alleviate and prevent AS and its subsequent CHD.

Keywords: Atherosclerosis (AS); Branched-chain amino acid (BCAA); HMGB1; Hydrogen peroxide (H(2)O(2)); Inflammation; Macrophage; Mitochondria.


Conflict of interest statement

Declaration of competing interest The authors declare no competing interests.

Figures

Image 1
Graphical abstract
Fig. 1
Fig. 1
Elevated plasma BCAA level is an independent risk factor for CHD (A) Univariate logistic regression analysis for discrimination of CHD. (B) Multivariate logistic regression analysis for discrimination of CHD. (C) Areas under the receiver operating curve of BCAA for discrimination of CHD. BMI, body mass index; SBP, systolic blood pressure; DBP, diastolic blood pressure; FBG, fasting blood glucose; TG, triglyceride; HDL-C, high density lipoprotein cholesterol; BCAA, branched-chain amino acid. *Age, BMI, TG, TC, LDL-C, HDL-C and BCAA were included in multivariate logistic regression analysis.
Fig. 2
Fig. 2
Elevated BCAA enhances AS progression in HCD-fed apoE−/− mice (A) Schematic diagram of animal study. (B) Plasma BCAA level in mice. (C) Plasma BCKA level in mice. (D) Oil Red O staining of the plaque area. (E) Masson's trichrome staining of the collagen content. (F) Alpha-smooth muscle actin (α-SMA) positive cells by immunofluorescence staining showing the smooth muscle cells (SMCs). (G) F4/80 and iNOS positive cells by immunofluorescence staining showing macrophages. (H) Serum IL-1β and TNF-α levels in mice. Data were expressed as mean ± SEM, n = 5. All data were analyzed with one-way ANOVA followed by Tukey's multiple comparisons test. *P < 0.05; **P < 0.01. (For interpretation of the references to colour in this figure legend, the reader is referred to the Web version of this article.)
Fig. 3
Fig. 3
Elevated BCAA activates proinflammatory macrophages (A) Schematic diagram of experimental procedure for human circulating monocytes. (B) BCAA level in CHD patients' circulating monocytes. (C) BCKA level in CHD patients' circulating monocytes. (D) Protein levels of BCKDHA and p-BCKDHA/BCKDHA in CHD patients' circulating monocytes. (E) Expression levels of BCAA catabolism-promoting genes in CHD patients' circulating monocytes. (F) CD11C positive cells in CHD patients' circulating monocytes. (G) IL-1β and TNF-α levels in CHD patients' circulating monocytes. (H) Schematic diagram of experimental procedure for mice abdominal macrophages. (I) BCAA level in HCD-fed ApoE−/− mice’ abdominal macrophages. (J) BCKA level in HCD-fed ApoE−/− mice’ abdominal macrophages. (K) Protein levels of BCKDHA and p-BCKDHA/BCKDHA in HCD-fed ApoE−/− mice’ abdominal macrophages. (L) Expression levels of BCAA catabolism-promoting genes in HCD-fed ApoE−/− mice’ abdominal macrophages. (M) IL-1β and TNF-α levels in HCD-fed ApoE−/− mice’ abdominal macrophages. (N) Schematic diagram of experimental procedure for RAW 264.7 macrophages (O) BCAA level in BCKDHA-KD RAW 264.7 macrophages. (P) BCKA level in BCKDHA-KD RAW 264.7 macrophages. (Q) CD11C positive cells in BCKDHA-KD RAW 264.7 macrophages. (R) Expression levels of the proinflammatory macrophage marker in BCKDHA-KD RAW 264.7 macrophages. (S) IL-1β and TNF-α levels in BCKDHA-KD RAW 264.7 macrophages. Data were expressed as mean ± SEM of three independent experiments. B–M: data were analyzed with unpaired Student t-test; O–S: data were analyzed with one-way ANOVA followed by Tukey's multiple comparisons test. **P < 0.01; n.s, not significant.
Fig. 4
Fig. 4
Mitochondrial H2O2 contributes to BCAA-activated proinflammatory macrophages (A) Schematic diagram of experimental procedure for RAW 264.7 macrophages. (B)Mitochondrial H2O2 level in RAW 264.7 macrophages by confocal microscopy and flow cytometry. (C) Schematic diagram of experimental procedure for RAW 264.7 macrophages with mCAT overexpression. (D) Mitochondrial H2O2 level in RAW 264.7 macrophages with mCAT overexpression by confocal microscopy and flow cytometry. (E) CD11C positive cells in RAW 264.7 macrophages with mCAT overexpression. (F) Expression levels of proinflammatory macrophage marker in RAW 264.7 macrophages with mCAT overexpression. (G) IL-1β and TNF-α levels in RAW 264.7 macrophages with mCAT overexpression. Data were expressed as mean ± SEM of three independent experiments. B: data were analyzed with unpaired Student t-test; D–G: data were analyzed with one-way ANOVA followed by Tukey's multiple comparisons test. *P < 0.05; **P < 0.01.
Fig. 5
Fig. 5
HMGB1 signaling mediates the proinflammatory macrophages stimulated by BCAA (A) Schematic diagram of experimental procedure. (B) Inflammatory cytokines screening by antibody array assay. (C) Cellular HMGB1 level in RAW 264.7 macrophages. (D) Extracellular HMGB1 level in RAW 264.7 macrophages. (E) Protein levels of TLR4, p65, p-p65, IκBα and nuclear p65 in RAW 264.7 macrophages. (F) Schematic diagram of experimental procedure HMGB1-KD RAW 264.7 macrophages. (G) Extracellular HMGB1 level in HMGB1-KD RAW 264.7 macrophages. (H) Expression levels of p65, p-p65, IκBα and nuclear p65 in HMGB1-KD RAW 264.7 macrophages. (I) CD11C positive cells in HMGB1-KD RAW 264.7 macrophages. (J) Expression levels of proinflammatory macrophage markers in HMGB1-KD RAW 264.7 macrophages. (K) IL-1β and TNF-α levels in HMGB1-KD RAW 264.7 macrophages. (L) Schematic diagram of experimental procedure for RAW 264.7 macrophages with mCAT overexpression. (M) Extracellular HMGB1 level in RAW 264.7 macrophages with mCAT overexpression. (N) Protein levels of TLR4, p65, p-p65, IκBα and nuclear p65 in RAW 264.7 macrophages with mCAT overexpression. Data were expressed as mean ± SEM of three independent experiments. B–E: data were analyzed with unpaired Student t-test; G–N: data were analyzed with one-way ANOVA followed by Tukey's multiple comparisons test. *P < 0.05; **P < 0.01.
Fig. 5
Fig. 5
HMGB1 signaling mediates the proinflammatory macrophages stimulated by BCAA (A) Schematic diagram of experimental procedure. (B) Inflammatory cytokines screening by antibody array assay. (C) Cellular HMGB1 level in RAW 264.7 macrophages. (D) Extracellular HMGB1 level in RAW 264.7 macrophages. (E) Protein levels of TLR4, p65, p-p65, IκBα and nuclear p65 in RAW 264.7 macrophages. (F) Schematic diagram of experimental procedure HMGB1-KD RAW 264.7 macrophages. (G) Extracellular HMGB1 level in HMGB1-KD RAW 264.7 macrophages. (H) Expression levels of p65, p-p65, IκBα and nuclear p65 in HMGB1-KD RAW 264.7 macrophages. (I) CD11C positive cells in HMGB1-KD RAW 264.7 macrophages. (J) Expression levels of proinflammatory macrophage markers in HMGB1-KD RAW 264.7 macrophages. (K) IL-1β and TNF-α levels in HMGB1-KD RAW 264.7 macrophages. (L) Schematic diagram of experimental procedure for RAW 264.7 macrophages with mCAT overexpression. (M) Extracellular HMGB1 level in RAW 264.7 macrophages with mCAT overexpression. (N) Protein levels of TLR4, p65, p-p65, IκBα and nuclear p65 in RAW 264.7 macrophages with mCAT overexpression. Data were expressed as mean ± SEM of three independent experiments. B–E: data were analyzed with unpaired Student t-test; G–N: data were analyzed with one-way ANOVA followed by Tukey's multiple comparisons test. *P < 0.05; **P < 0.01.
Fig. 6
Fig. 6
BCAA stimulates disulfide HMGB1 secretion via mitochondria-to-nuclear H2O2 (A) Schematic diagram of experimental procedure. (B) The level of disulfide HMGB1 in RAW 264.7 macrophages. (C) Schematic diagram of experimental procedure for RAW 264.7 macrophages with nCAT overexpression. (D) Nuclear H2O2 level in RAW 264.7 macrophages with nCAT overexpression. (E) Nuclear MDA level in RAW 264.7 macrophages with nCAT overexpression. (F) Nuclear 8-OHdG level in RAW 264.7 macrophages with nCAT overexpression. (G) The level of disulfide HMGB1 in RAW 264.7 macrophages with nCAT overexpression. (H) Extracellular HMGB1 level in RAW 264.7 macrophages with nCAT overexpression. (I) Protein levels of TLR4, p65, p-p65, IκBα and nuclear p65 in RAW 264.7 macrophages with nCAT overexpression. (J) CD11C positive cells in RAW 264.7 macrophages with nCAT overexpression. (K) Expression levels of proinflammatory macrophage markers in RAW 264.7 macrophages with nCAT overexpression. (L) IL-1β and TNF-α levels in RAW 264.7 macrophages with nCAT overexpression. (M) Schematic diagram of experimental procedure for RAW 264.7 macrophages with mCAT overexpression. (N) Nuclear H2O2 level in RAW 264.7 macrophages with mCAT overexpression. (O) Nuclear MDA level in RAW 264.7 macrophages with mCAT overexpression. (P) Nuclear 8-OHdG level in RAW 264.7 macrophages with nCAT overexpression. Data were expressed as mean ± SEM of three independent experiments. All data were analyzed with one-way ANOVA followed by Tukey's multiple comparisons test. *P < 0.05; **P < 0.01.
Fig. 6
Fig. 6
BCAA stimulates disulfide HMGB1 secretion via mitochondria-to-nuclear H2O2 (A) Schematic diagram of experimental procedure. (B) The level of disulfide HMGB1 in RAW 264.7 macrophages. (C) Schematic diagram of experimental procedure for RAW 264.7 macrophages with nCAT overexpression. (D) Nuclear H2O2 level in RAW 264.7 macrophages with nCAT overexpression. (E) Nuclear MDA level in RAW 264.7 macrophages with nCAT overexpression. (F) Nuclear 8-OHdG level in RAW 264.7 macrophages with nCAT overexpression. (G) The level of disulfide HMGB1 in RAW 264.7 macrophages with nCAT overexpression. (H) Extracellular HMGB1 level in RAW 264.7 macrophages with nCAT overexpression. (I) Protein levels of TLR4, p65, p-p65, IκBα and nuclear p65 in RAW 264.7 macrophages with nCAT overexpression. (J) CD11C positive cells in RAW 264.7 macrophages with nCAT overexpression. (K) Expression levels of proinflammatory macrophage markers in RAW 264.7 macrophages with nCAT overexpression. (L) IL-1β and TNF-α levels in RAW 264.7 macrophages with nCAT overexpression. (M) Schematic diagram of experimental procedure for RAW 264.7 macrophages with mCAT overexpression. (N) Nuclear H2O2 level in RAW 264.7 macrophages with mCAT overexpression. (O) Nuclear MDA level in RAW 264.7 macrophages with mCAT overexpression. (P) Nuclear 8-OHdG level in RAW 264.7 macrophages with nCAT overexpression. Data were expressed as mean ± SEM of three independent experiments. All data were analyzed with one-way ANOVA followed by Tukey's multiple comparisons test. *P < 0.05; **P < 0.01.
Fig. 7
Fig. 7
Improving BCAA catabolism of macrophages alleviates AS burden (A) Schematic diagram of experimental procedure for RAW 264.7 macrophages with BCKDHA overexpression. (B) Mitochondrial H2O2 level in RAW 264.7 macrophages with BCKDHA overexpression by confocal microscopy and flow cytometry. (C) Nuclear H2O2 level in RAW 264.7 macrophages with BCKDHA overexpression by confocal microscopy. (D) Nuclear MDA level in RAW 264.7 macrophages with BCKDHA overexpression. (E) Nuclear 8-OHdG level in RAW 264.7 macrophages with BCKDHA overexpression. (F) Cellular disulfide HMGB1 in RAW 264.7 macrophages with BCKDHA overexpression. (G) Extracellular HMGB1 level in RAW 264.7 macrophages with BCKDHA overexpression. (H) Protein levels of TLR4, p65, p-p65, IκBα and nuclear p65 in RAW 264.7 macrophages with BCKDHA overexpression. (I) CD11C positive cells in RAW 264.7 macrophage with BCKDHA overexpression. (J) Expression levels of proinflammatory macrophage markers in RAW 264.7 macrophages with BCKDHA overexpression. (K) IL-1β and TNF-α levels in RAW 264.7 macrophages with BCKDHA overexpression. (L) Schematic diagram of animal study with the bone marrow transplantation. (M) Oil Red O staining of the plaque area. (N) Masson's trichrome staining of the collagen content. (O) Alpha-smooth muscle actin (α-SMA) positive cells by immunofluorescence staining showing SMCs. (P) F4/80 and iNOS positive cells by immunofluorescence staining showing macrophages. (Q) TNF-α positive cells by immunofluorescence staining showing the activation of proinflammatory macrophages. B–J: Data were expressed as mean ± SEM of three independent experiments. M–Q: Data were expressed as mean ± SEM, n = 6. All data were analyzed with one-way ANOVA followed by Tukey's multiple comparisons test. *P < 0.05; **P < 0.01. (For interpretation of the references to colour in this figure legend, the reader is referred to the Web version of this article.)
Fig. 7
Fig. 7
Improving BCAA catabolism of macrophages alleviates AS burden (A) Schematic diagram of experimental procedure for RAW 264.7 macrophages with BCKDHA overexpression. (B) Mitochondrial H2O2 level in RAW 264.7 macrophages with BCKDHA overexpression by confocal microscopy and flow cytometry. (C) Nuclear H2O2 level in RAW 264.7 macrophages with BCKDHA overexpression by confocal microscopy. (D) Nuclear MDA level in RAW 264.7 macrophages with BCKDHA overexpression. (E) Nuclear 8-OHdG level in RAW 264.7 macrophages with BCKDHA overexpression. (F) Cellular disulfide HMGB1 in RAW 264.7 macrophages with BCKDHA overexpression. (G) Extracellular HMGB1 level in RAW 264.7 macrophages with BCKDHA overexpression. (H) Protein levels of TLR4, p65, p-p65, IκBα and nuclear p65 in RAW 264.7 macrophages with BCKDHA overexpression. (I) CD11C positive cells in RAW 264.7 macrophage with BCKDHA overexpression. (J) Expression levels of proinflammatory macrophage markers in RAW 264.7 macrophages with BCKDHA overexpression. (K) IL-1β and TNF-α levels in RAW 264.7 macrophages with BCKDHA overexpression. (L) Schematic diagram of animal study with the bone marrow transplantation. (M) Oil Red O staining of the plaque area. (N) Masson's trichrome staining of the collagen content. (O) Alpha-smooth muscle actin (α-SMA) positive cells by immunofluorescence staining showing SMCs. (P) F4/80 and iNOS positive cells by immunofluorescence staining showing macrophages. (Q) TNF-α positive cells by immunofluorescence staining showing the activation of proinflammatory macrophages. B–J: Data were expressed as mean ± SEM of three independent experiments. M–Q: Data were expressed as mean ± SEM, n = 6. All data were analyzed with one-way ANOVA followed by Tukey's multiple comparisons test. *P < 0.05; **P < 0.01. (For interpretation of the references to colour in this figure legend, the reader is referred to the Web version of this article.)
Fig. 8
Fig. 8
Schematic of BCAA promoted AS by enhancing mitochondrial-to-nuclear H2O2-disulfide HMGB1 in macrophages

References

    1. Neinast M., Murashige D., Arany Z. Branched chain amino acids. Annu. Rev. Physiol. 2019;81:139–164. - PMC - PubMed
    1. Holeček M. Branched-chain amino acids in health and disease: metabolism, alterations in blood plasma, and as supplements. Nutr. Metab. 2018;15:33. - PMC - PubMed
    1. Wang T.J., Larson M.G., Vasan R.S., et al. Metabolite profiles and the risk of developing diabetes. Nat. Med. 2011;17:448–453. - PMC - PubMed
    1. Lian K., Du C., Liu Y., et al. Impaired adiponectin signaling contributes to disturbed catabolism of branched-chain amino acids in diabetic mice. Diabetes. 2015;64:49–59. - PubMed
    1. Sun H., Olson K.C., Gao C., et al. Catabolic defect of branched-chain amino acids promotes heart failure. Circulation. 2016;133:2038–2049. - PMC - PubMed

Publication types