. 2023 May 8;41(5):871-886.e10.
doi: 10.1016/j.ccell.2023.03.015. Epub 2023 Apr 13.

Lymphocyte networks are dynamic cellular communities in the immunoregulatory landscape of lung adenocarcinoma

Affiliations

Lymphocyte networks are dynamic cellular communities in the immunoregulatory landscape of lung adenocarcinoma

Giorgio Gaglia et al. Cancer Cell. .

Abstract

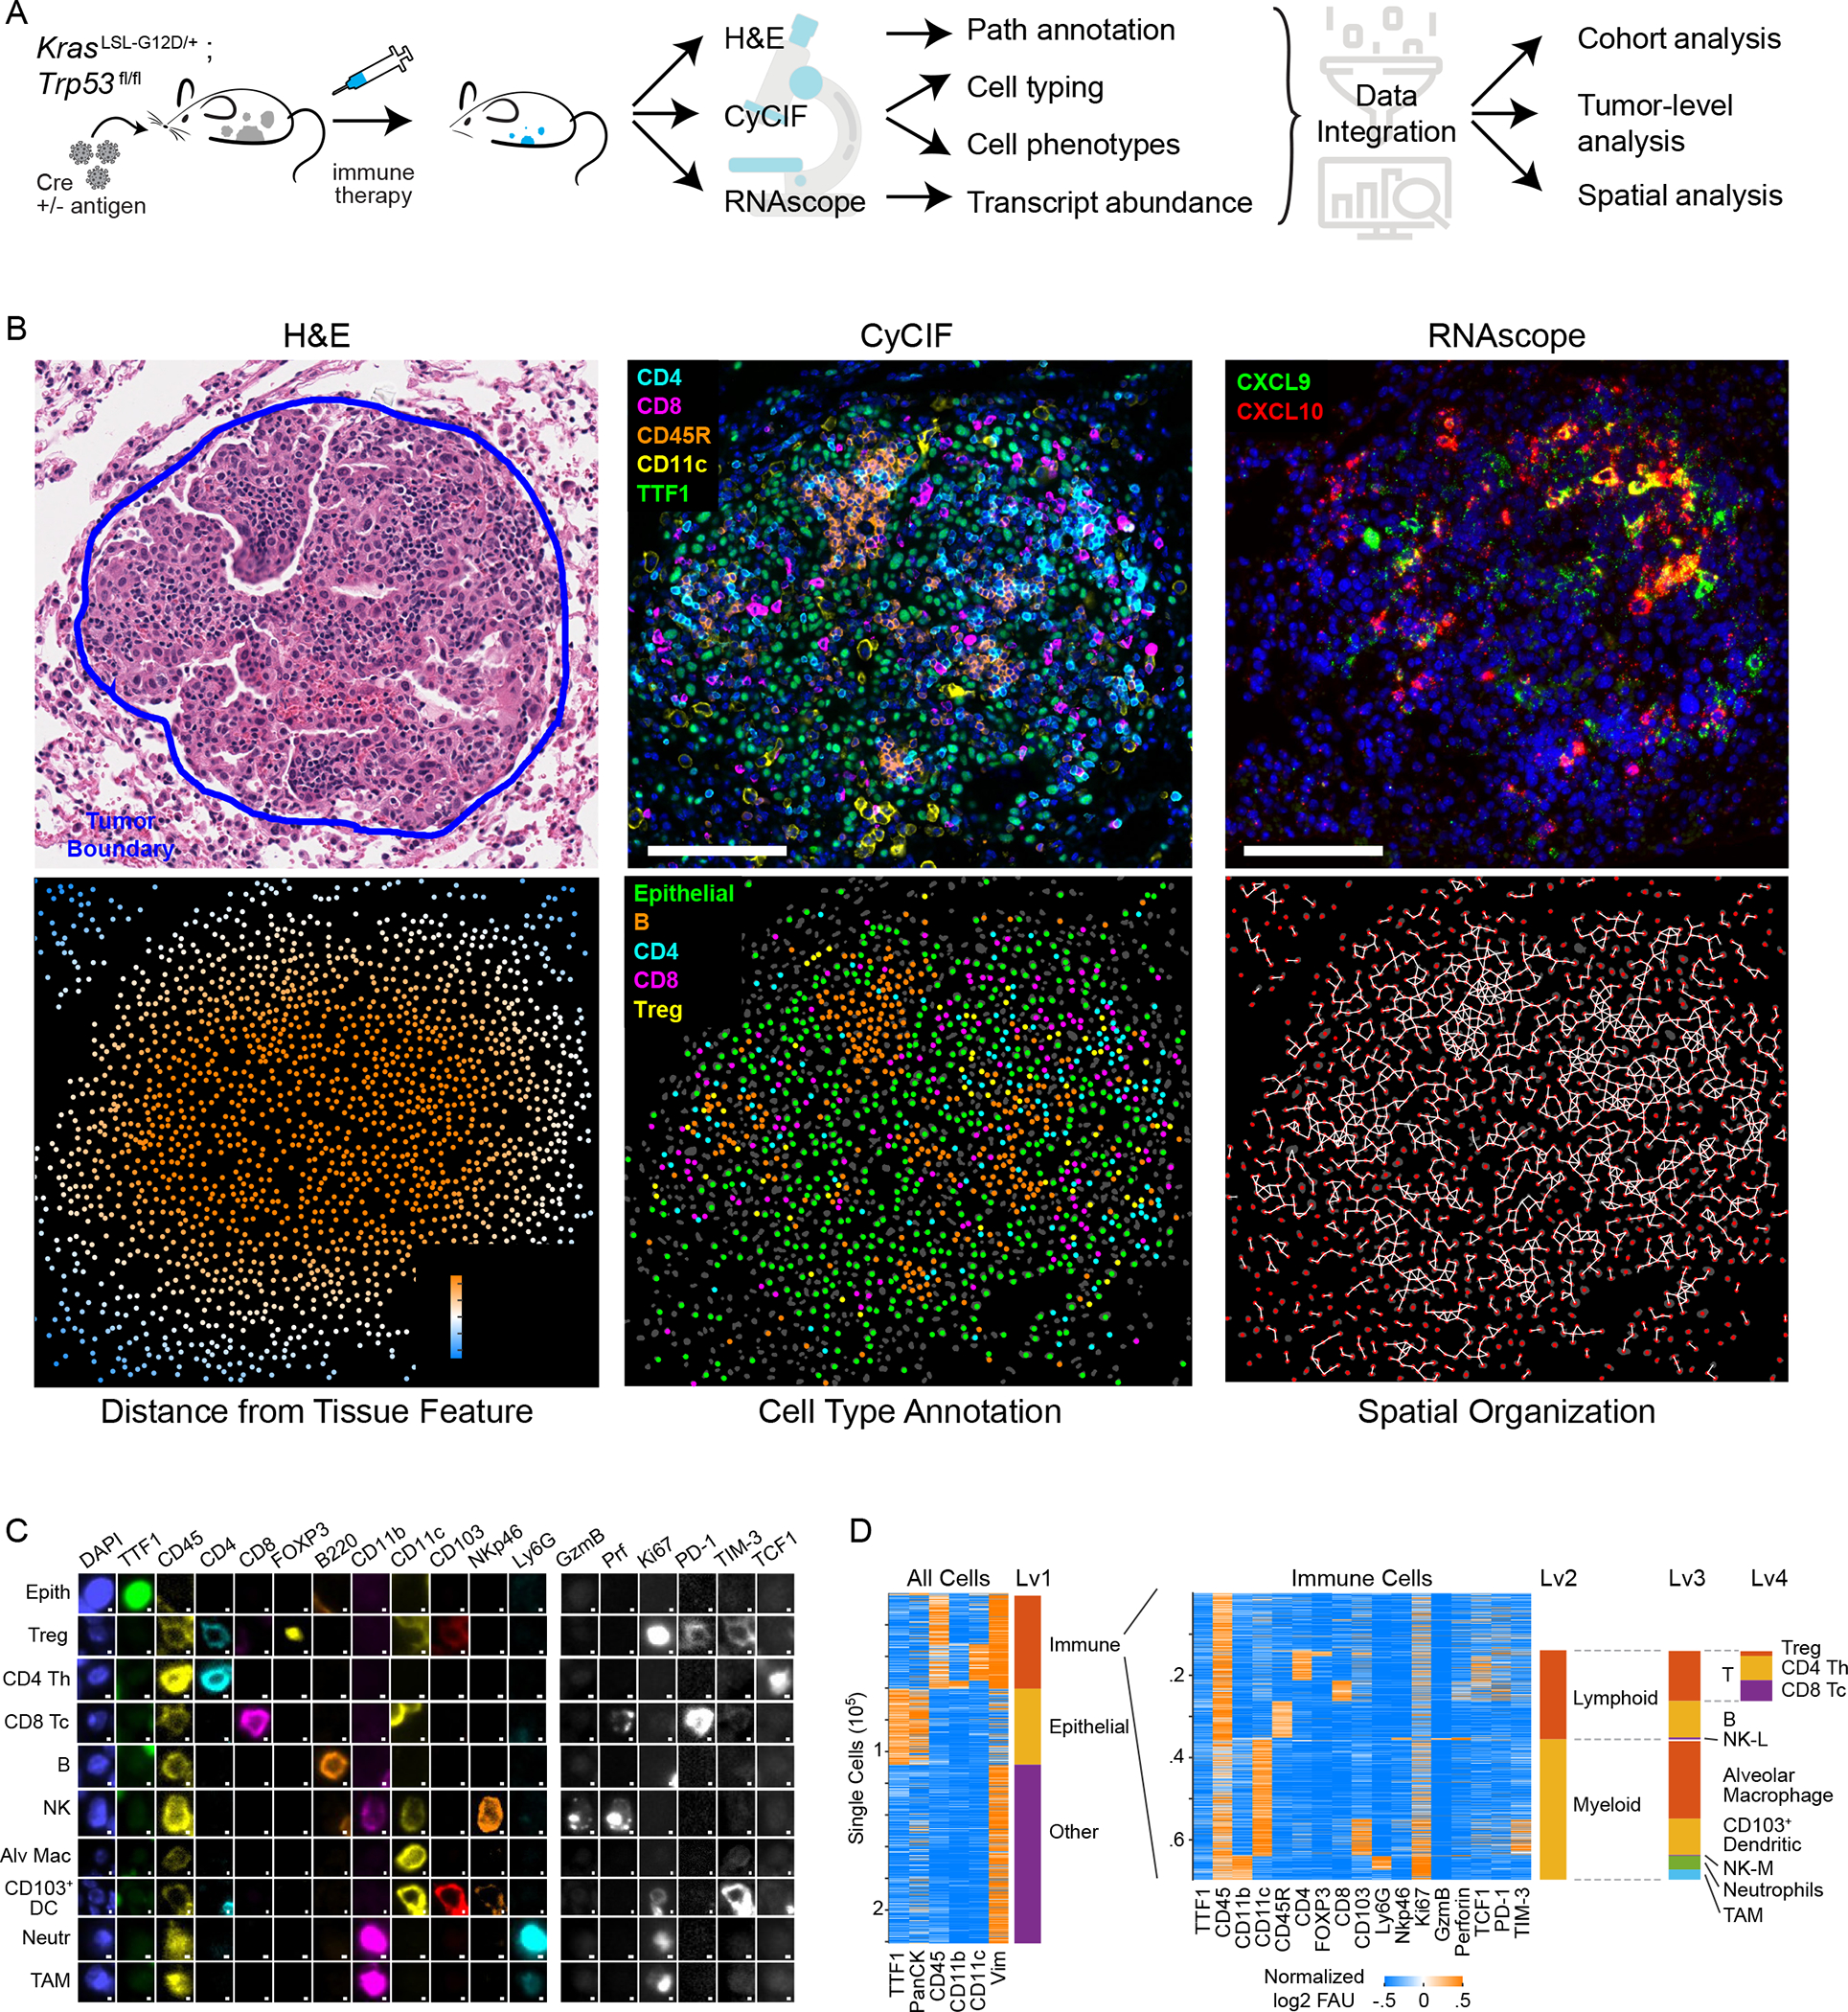
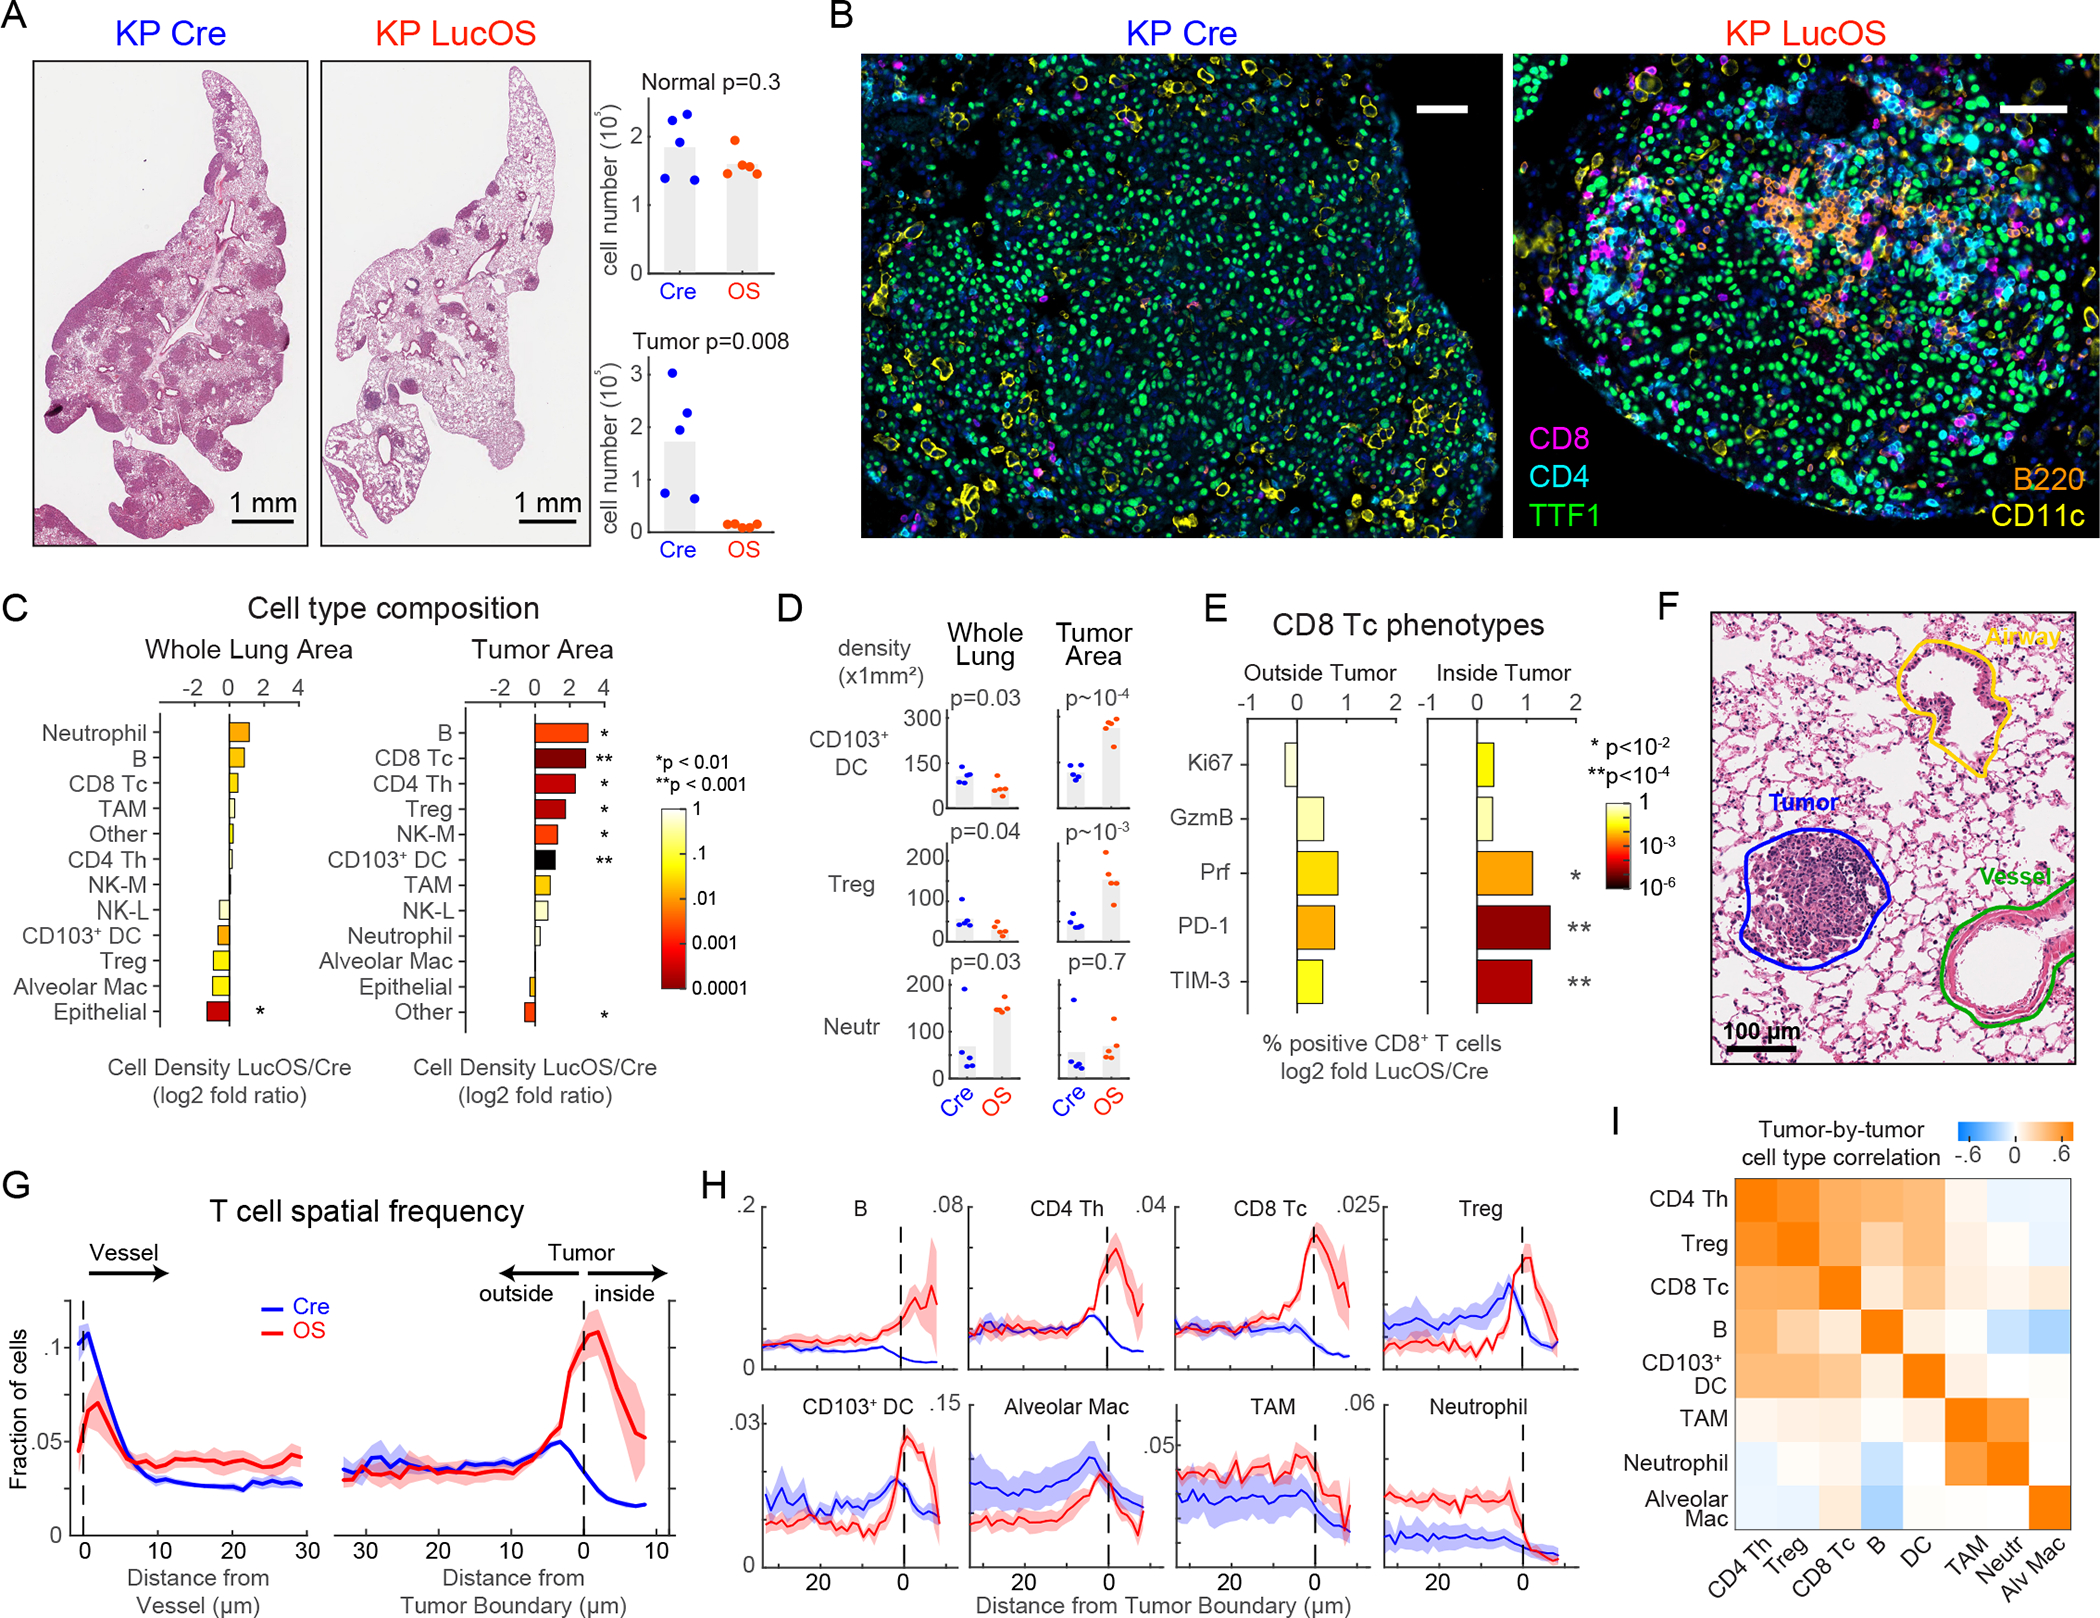
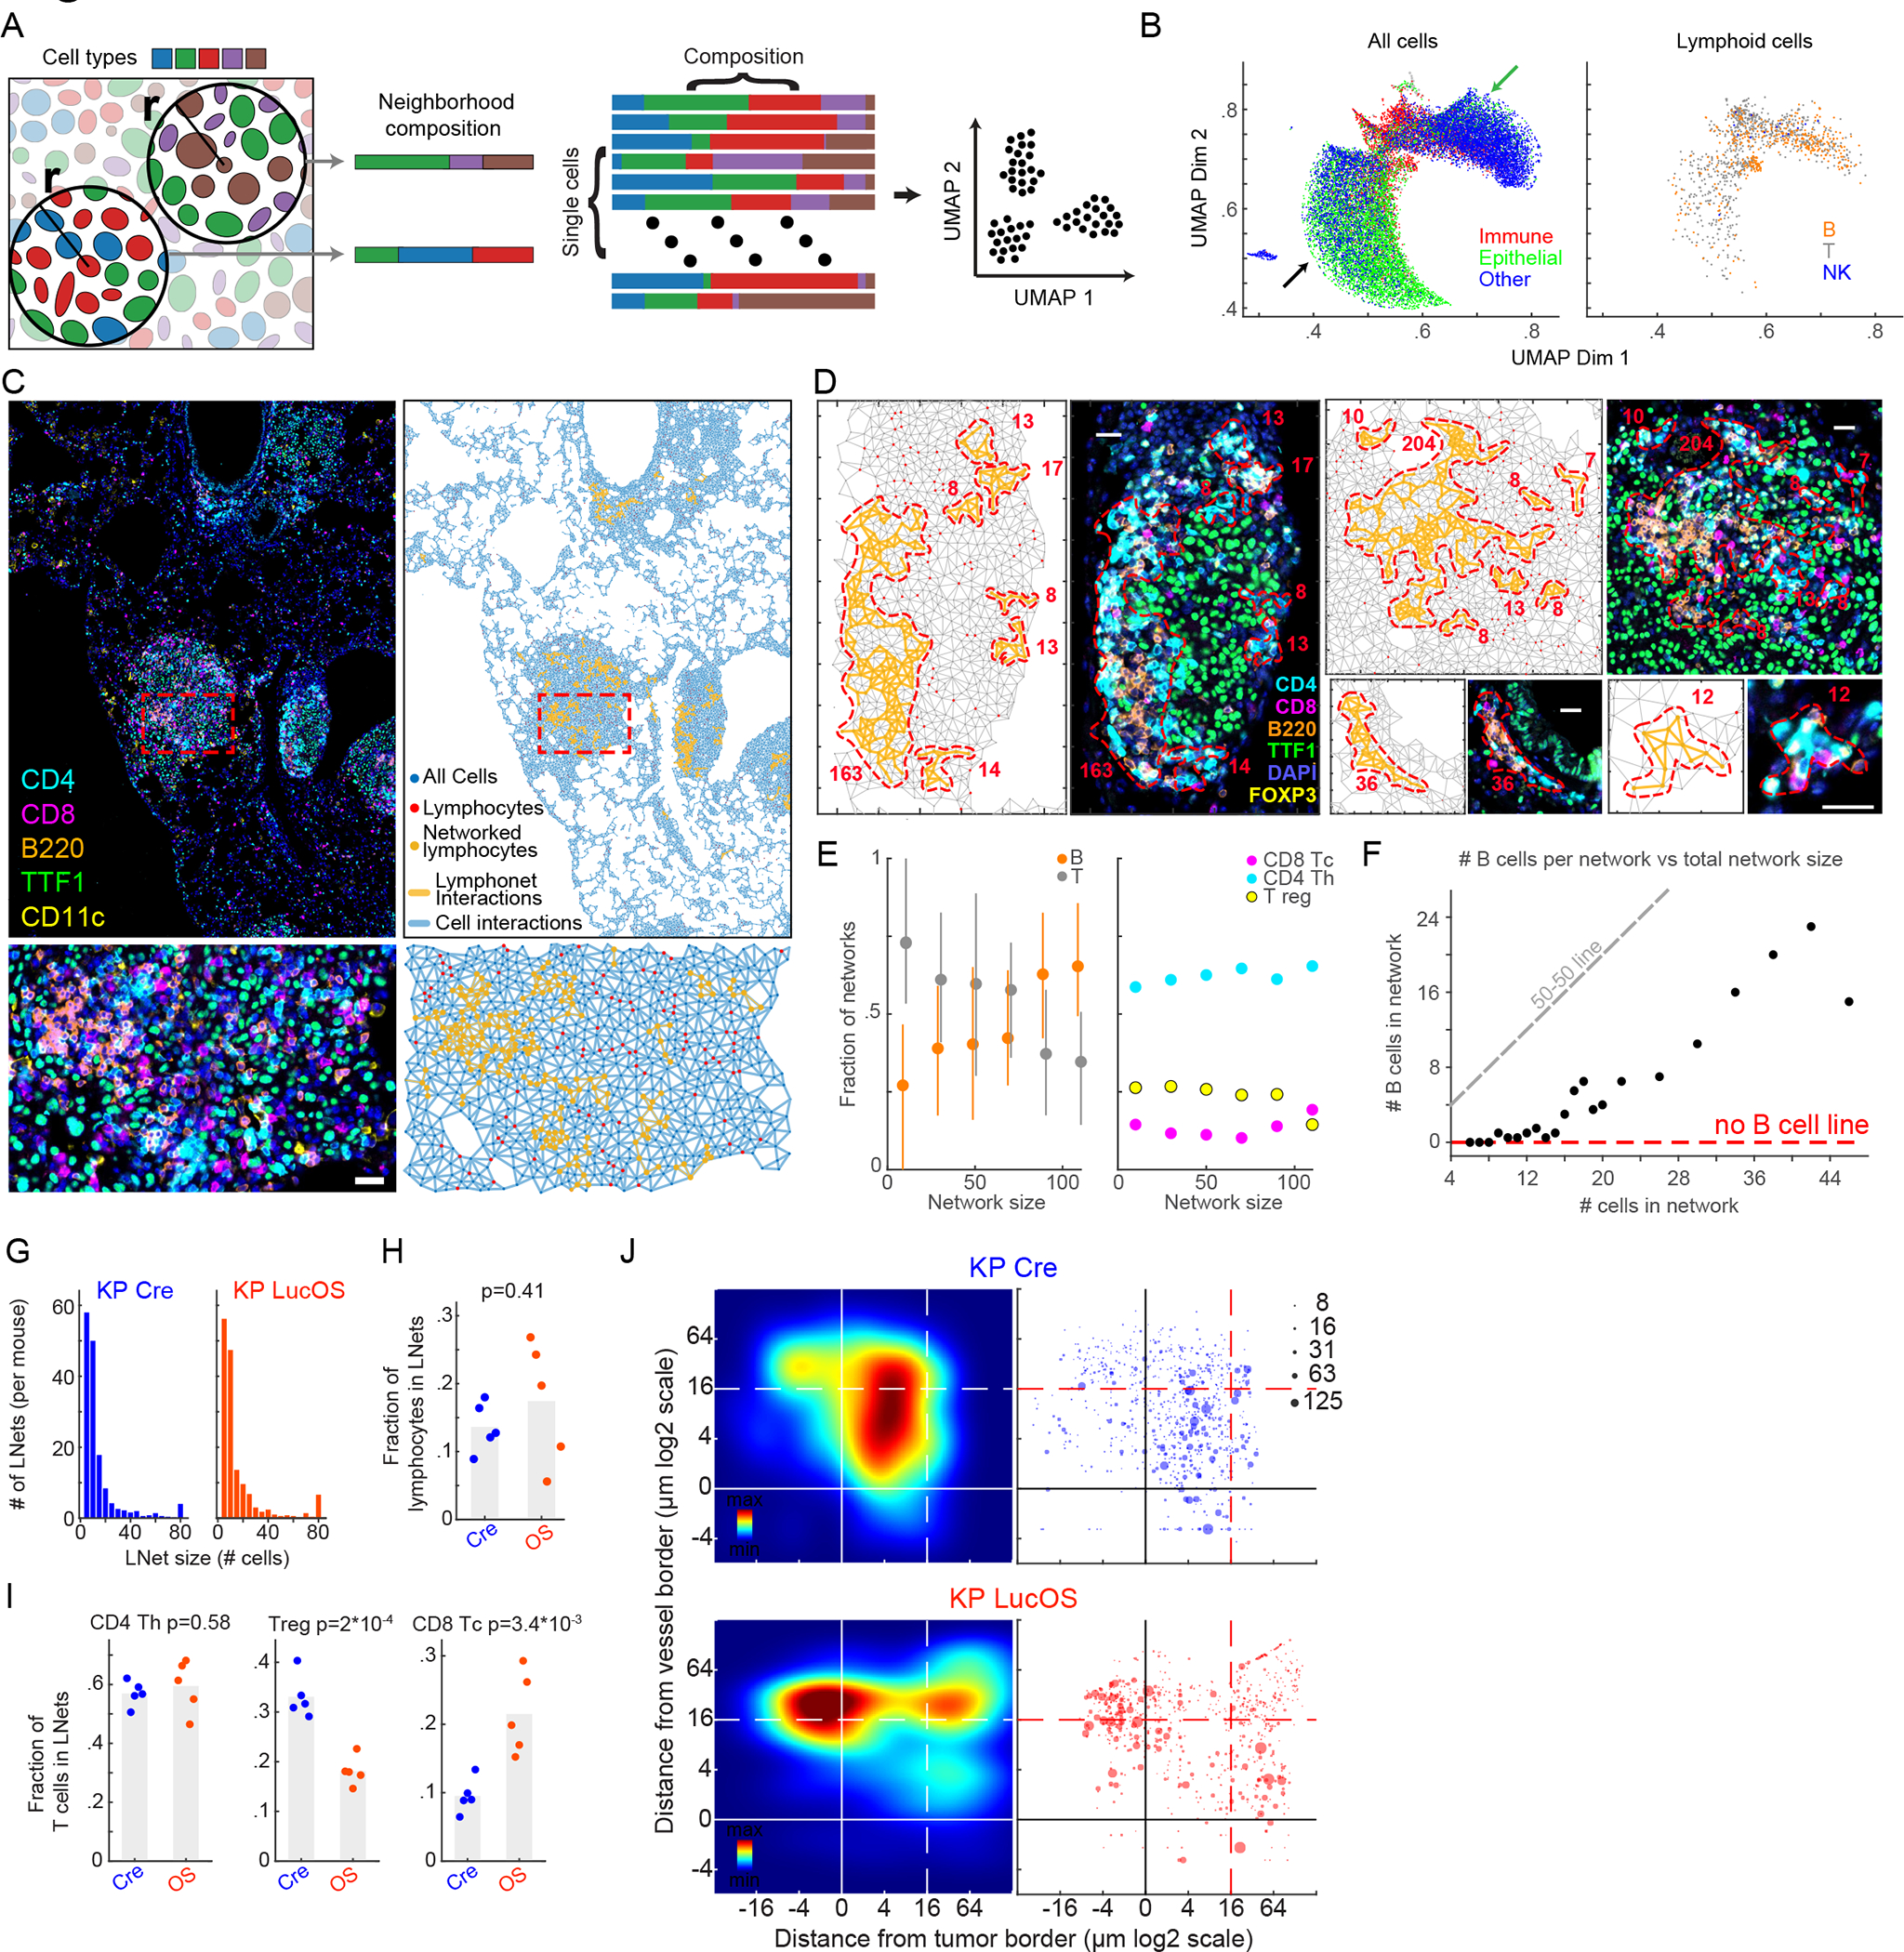
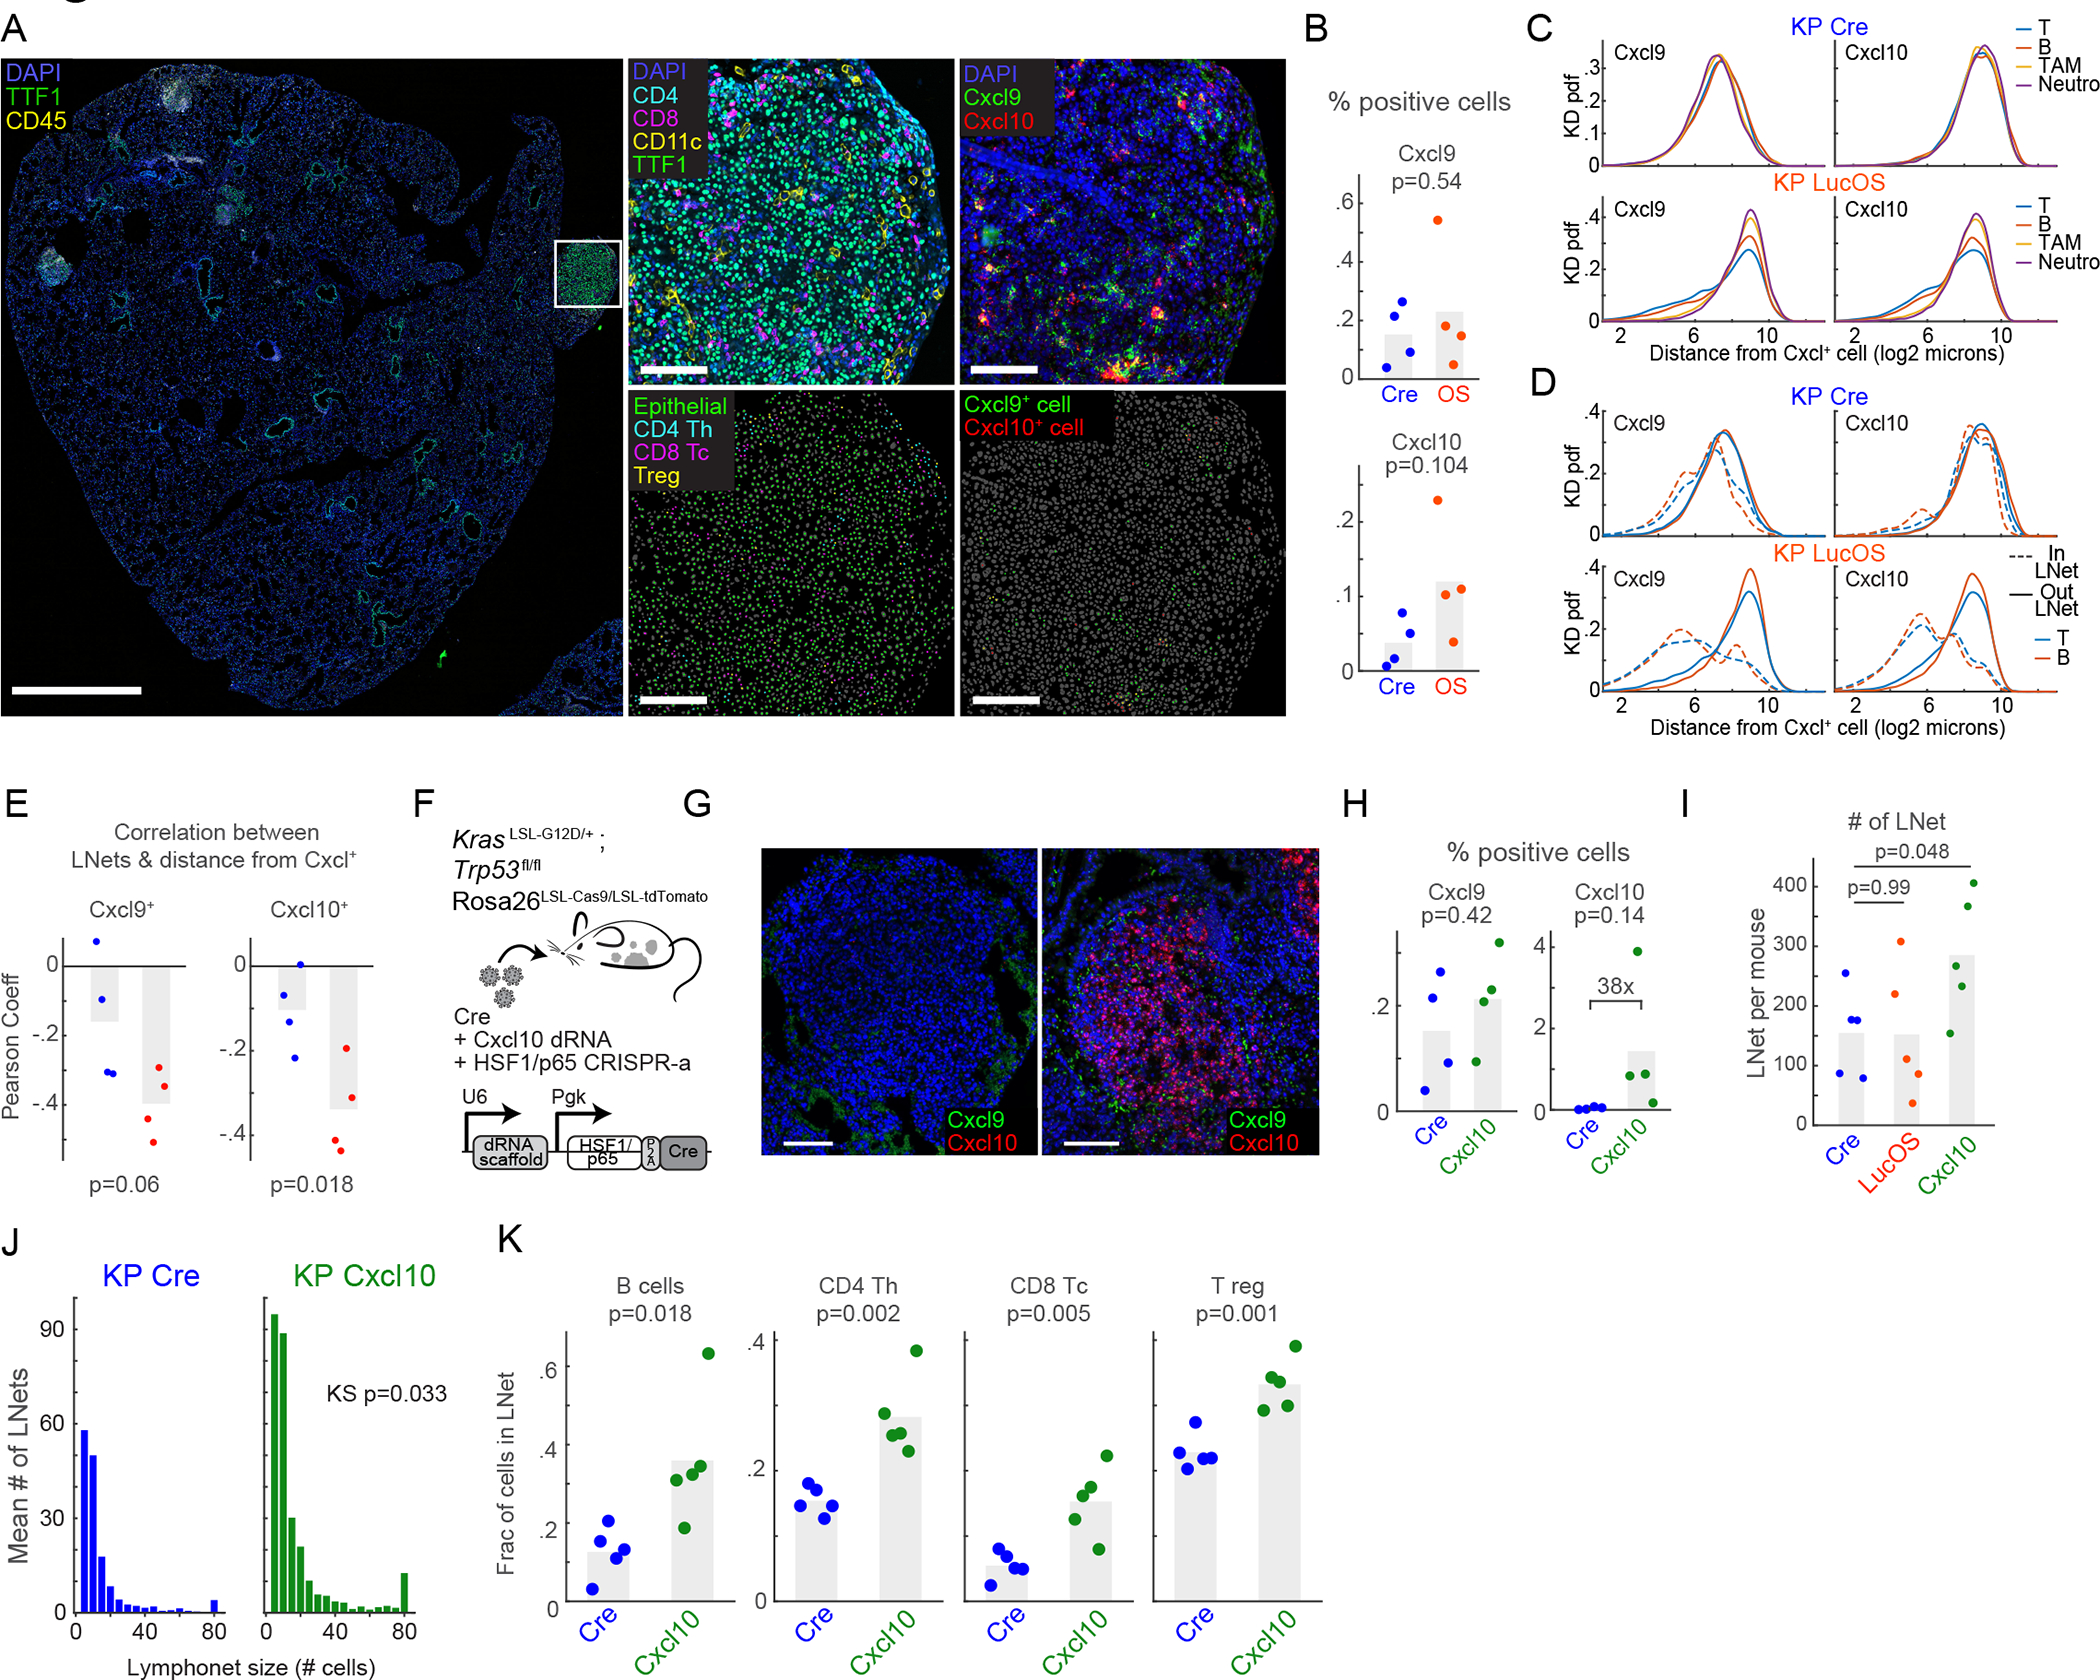
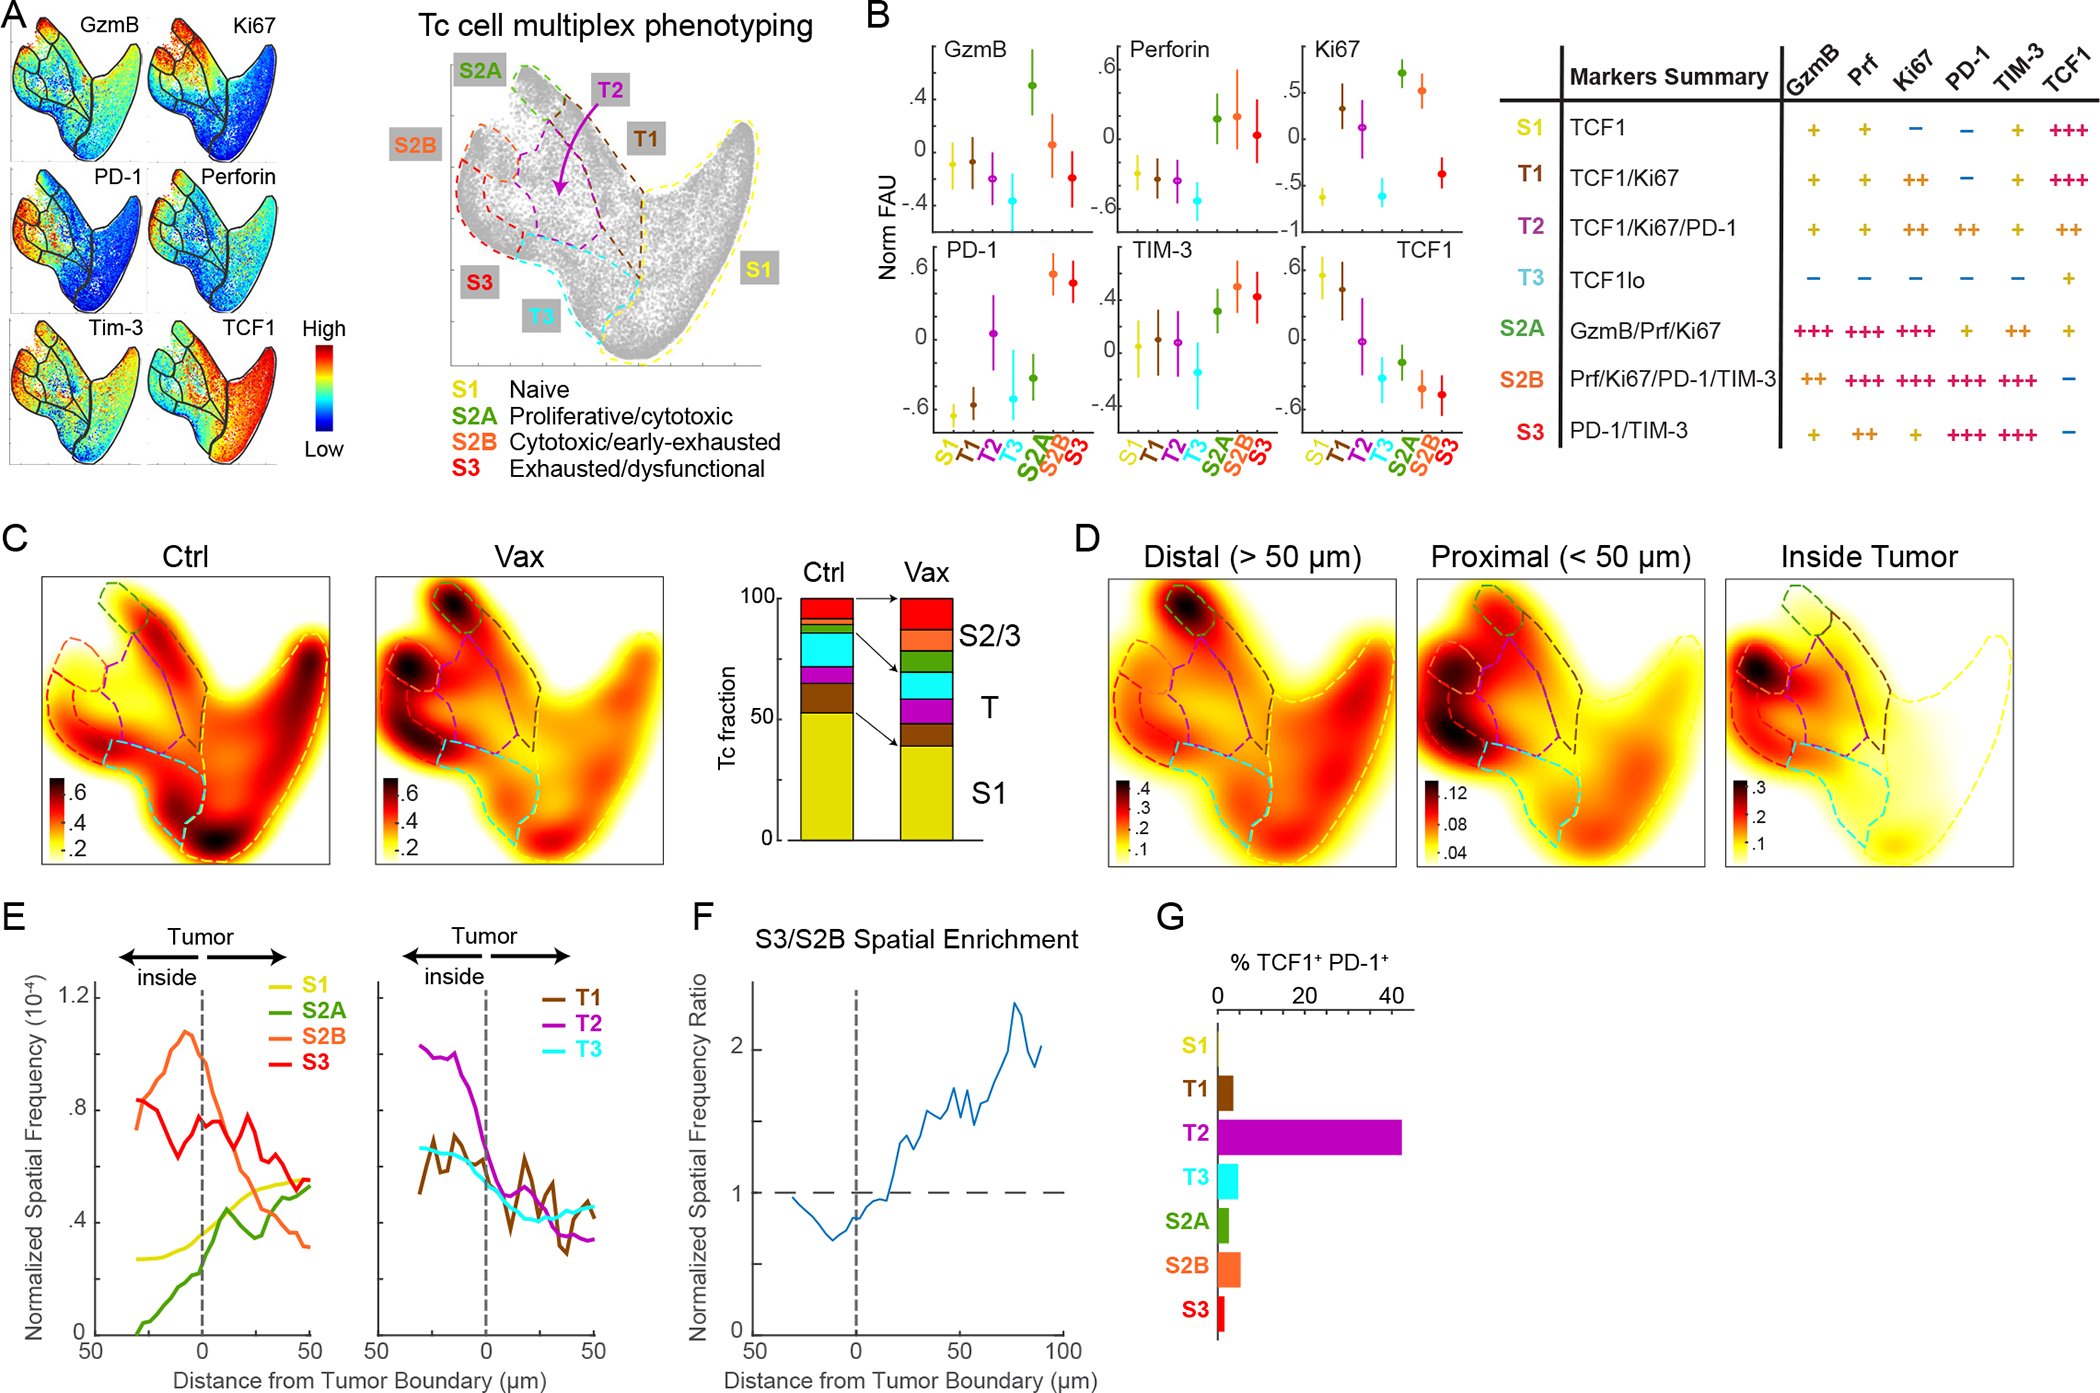
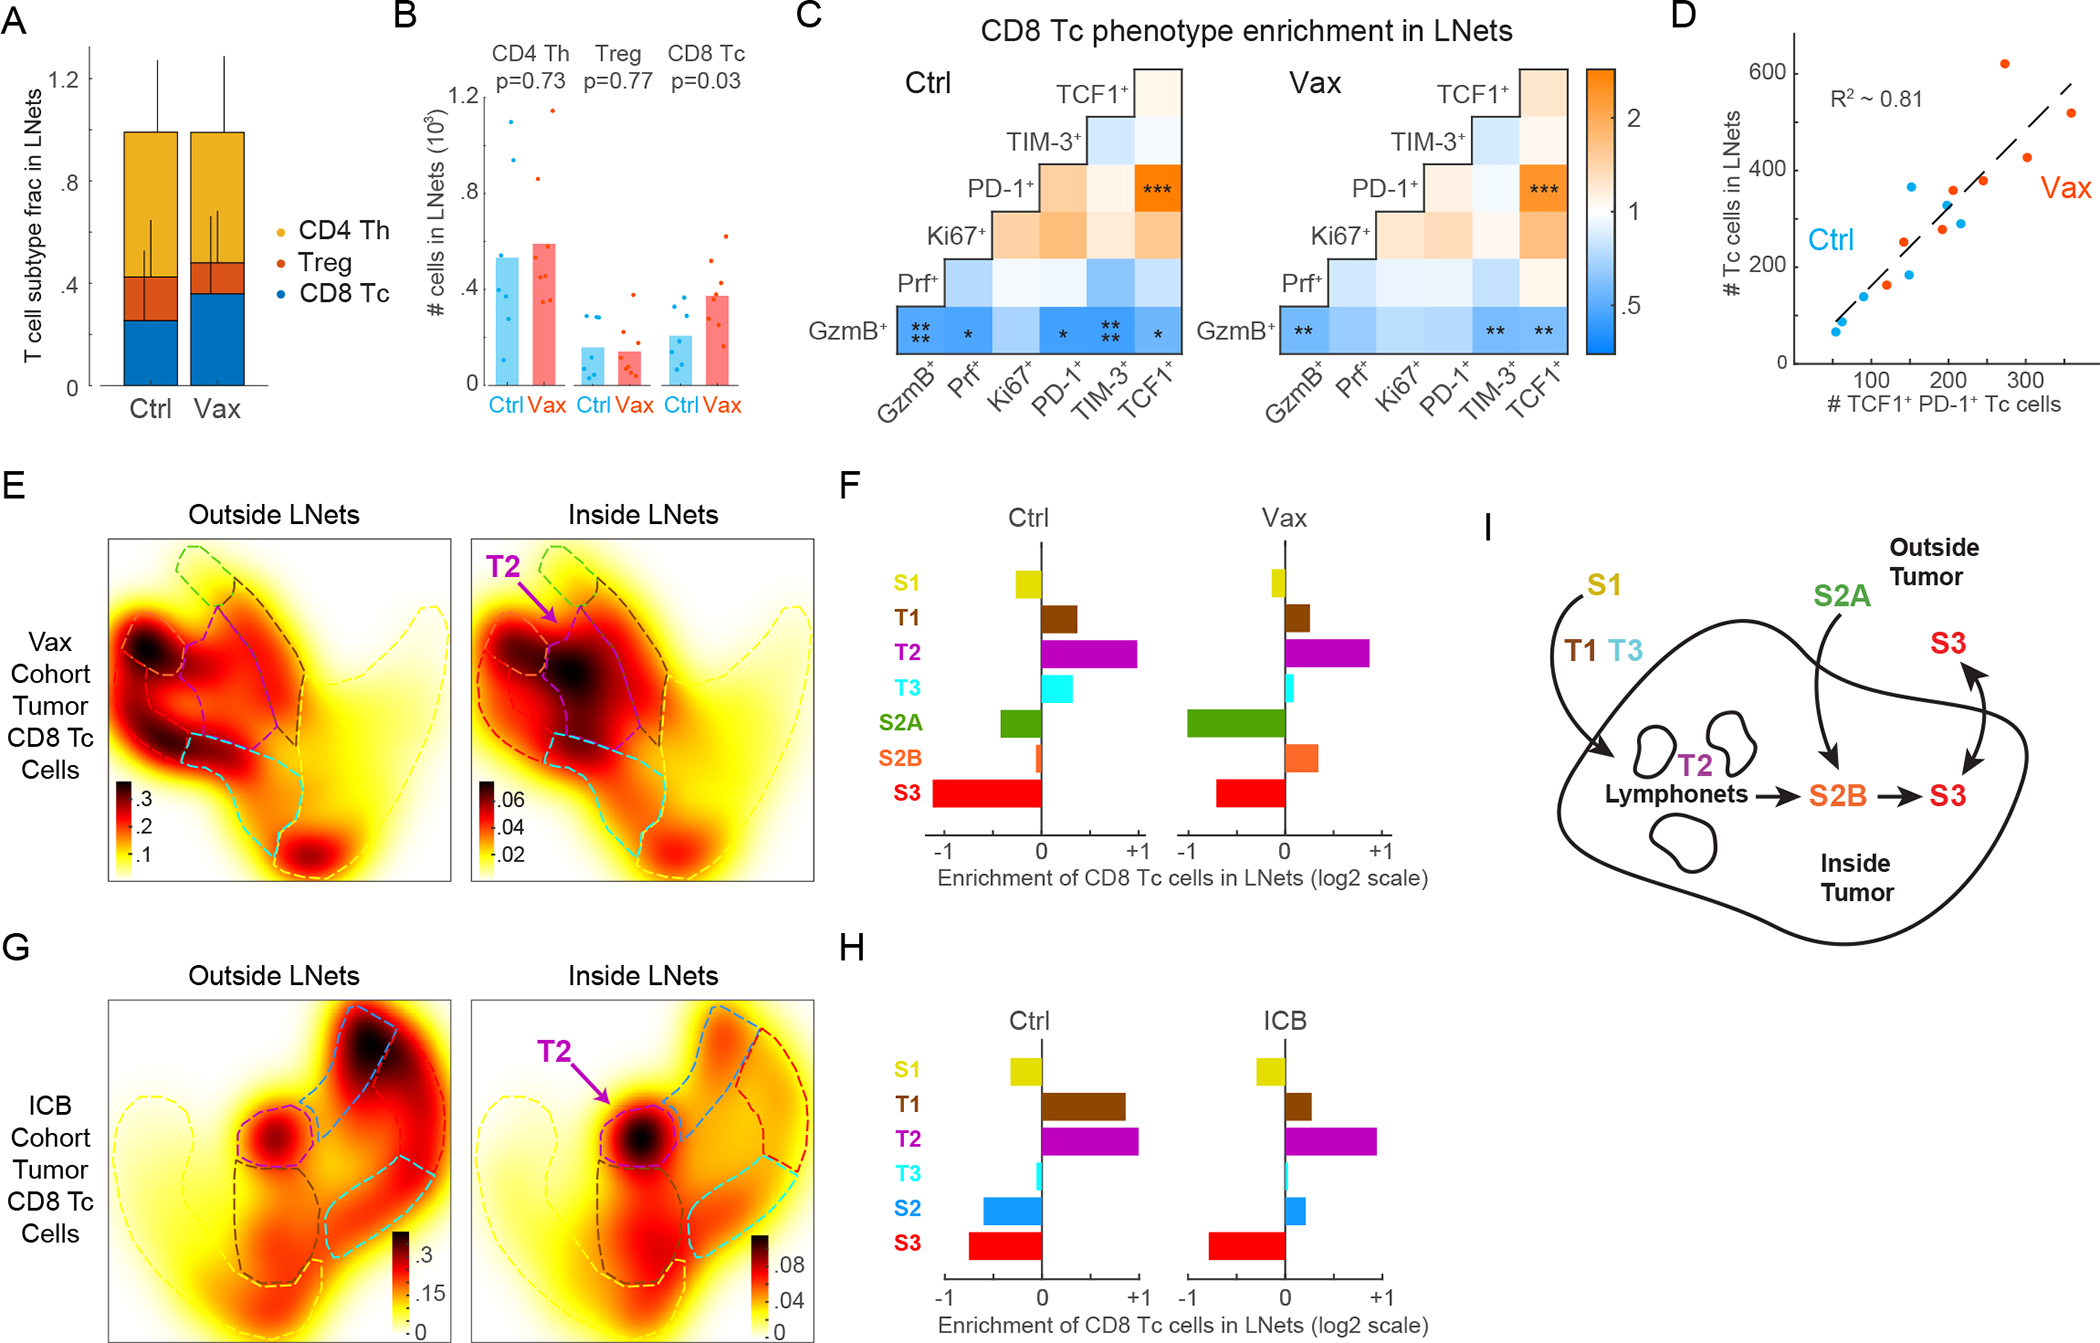
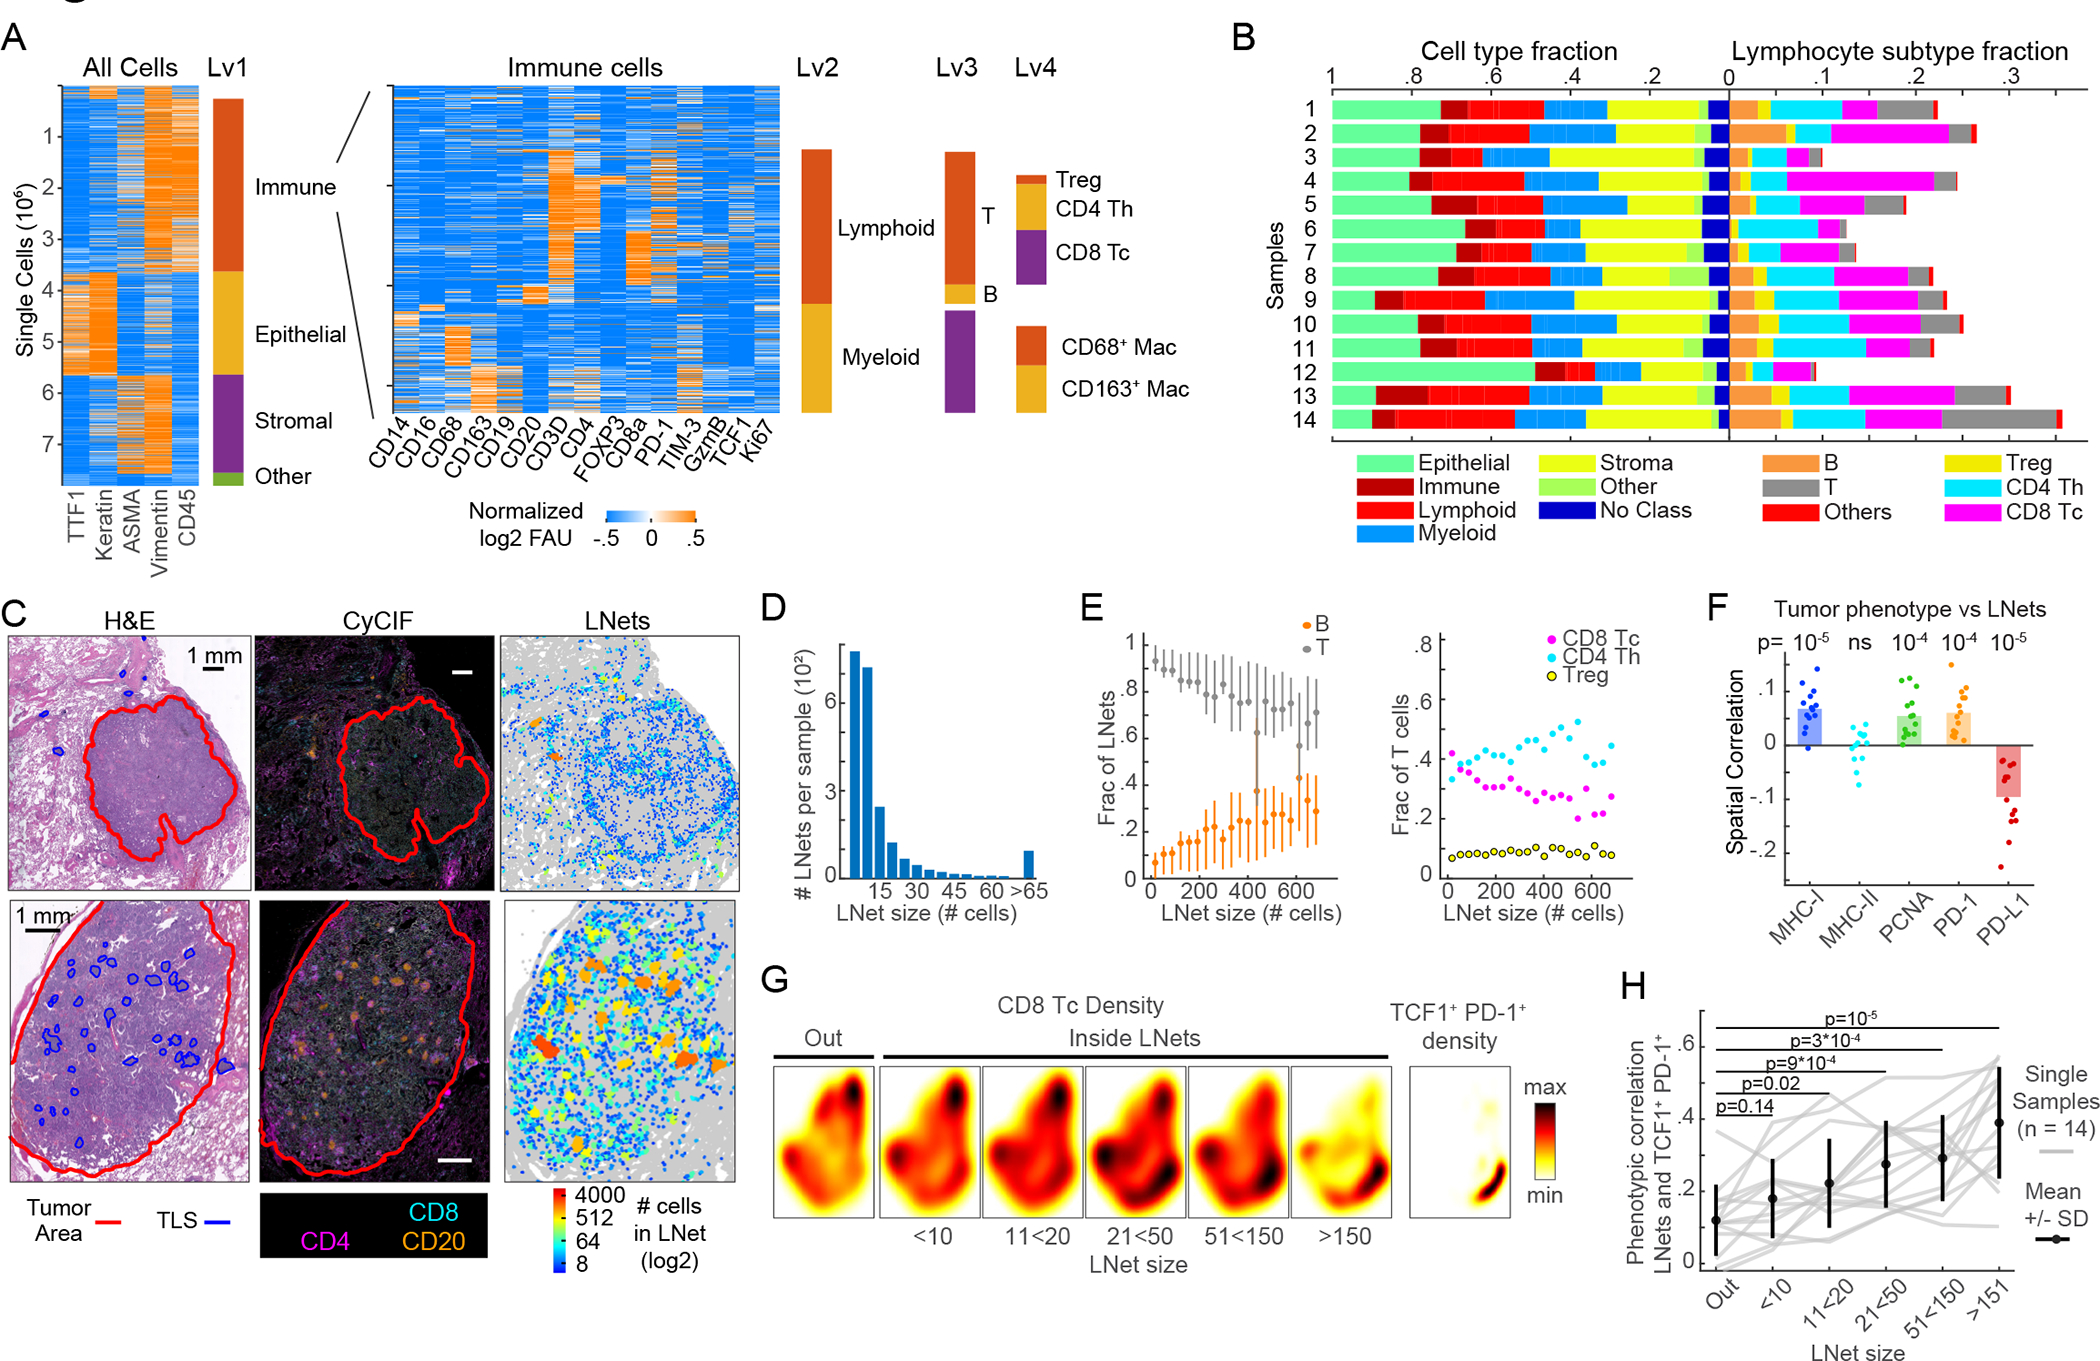
Lymphocytes are key for immune surveillance of tumors, but our understanding of the spatial organization and physical interactions that facilitate lymphocyte anti-cancer functions is limited. We used multiplexed imaging, quantitative spatial analysis, and machine learning to create high-definition maps of lung tumors from a Kras/Trp53-mutant mouse model and human resections. Networks of interacting lymphocytes ("lymphonets") emerged as a distinctive feature of the anti-cancer immune response. Lymphonets nucleated from small T cell clusters and incorporated B cells with increasing size. CXCR3-mediated trafficking modulated lymphonet size and number, but T cell antigen expression directed intratumoral localization. Lymphonets preferentially harbored TCF1+ PD-1+ progenitor CD8+ T cells involved in responses to immune checkpoint blockade (ICB) therapy. Upon treatment of mice with ICB or an antigen-targeted vaccine, lymphonets retained progenitor and gained cytotoxic CD8+ T cell populations, likely via progenitor differentiation. These data show that lymphonets create a spatial environment supportive of CD8+ T cell anti-tumor responses.

Keywords: CyCIF; cancer vaccines; computational biology; immunotherapy; lung adenocarcinoma; multimodal data integration; multiplexed imaging; spatial biology; spatial profiling; systems biology.


Conflict of interest statement

Declaration of interests P.K.S. is a BOD member of Applied Biomath and Glencoe Software (co-founder), SAB member for RareCyte, NanoString, and Montai Health, and consultant for Merck. T.J. is a BOD member of Amgen and ThermoFisher, co-founder of Dragonfly Therapeutics and T2-Biosystems, SAB member of Dragonfly Therapeutics, SQZ Biotech, and Skyhawk Therapeutics, and President of Break-Through-Cancer. Jacks lab receives funding from J&J Lung Cancer Initiative and Lustgarten Foundation (not supporting research in this manuscript). These affiliations do not represent a conflict of interest in this manuscript with respect to design/execution/interpretation.

Figures

Figure 1.
Figure 1.. Spatial analysis of KP GEMM tumor-immune microenvironment by multimodal data integration
(A) Schematic: KP lung cancer GEMM, treatments, and multi-modality data integration. (B) Images acquired from KP-LucOS GEMM tumor nodule (expressing CD8+ T cell antigens): H&E, multiplexed CyCIF image of immune/tumor markers (DNA, blue), Cxcl9, Cxcl10 RNAScope (DNA, blue) (serial sections), map showing distance of cells from tumor edge, cell-type annotation map, and ‘graph’ map of physically interacting cells (Delaunay Triangulation). (C) Gallery of lineage, cell-state, and functional markers from CyCIF images of KP LucOS. Scalebar: 1μm. (D) Sequential clustering of CyCIF data using marker combinations in Figure S1C for immune, epithelial/tumor, stromal populations (rows=individual cells). See also Figure S1 and Table S1.
Figure 2.
Figure 2.. Tumor antigen expression reorganizes KP lung cancer immune landscape
(A-B) H&E, CyCIF images (taken from whole-slide images) of KP-Cre versus KP-LucOS (antigen-expressing) tumors and quantification of normal and tumor-cell number (n=5 mice/group, bar=mean). (C) Log2 fold ratio of cell-type densities between LucOS and Cre in whole-lung and tumor areas (n=5 mice/group, color: p-value). (D) Cell-density measurements for indicated immune cell types in whole-lung and tumor areas (n=5 mice/group, bar=mean). (E) Log2 ratio between LucOS and Cre density of CD8+ T cells positive for indicated single phenotypic markers (right, inside tumor; left, outside tumor, n=5 mice/group). (F) Representative pathology annotation of H&E. (G-H) T cell spatial frequency relative to vessels and tumor boundaries (G); (H) frequency of indicated cell types from tumor boundaries (Cre and LucOS, n=5 mice/group, mean±SEM). (I) Tumor-by-tumor correlation values within LucOS-tumor nodules for indicated cell types (n=29 tumors). In all mouse experiments in this manuscript, all tumor nodules were analyzed from 2–3 lung lobes/mouse for each experiment. p-values, two-tailed t-test on mean of n=5 mice/group. See also Figure S1 and S2, and Table S2.
Figure 3.
Figure 3.. Antigen expression is associated with intratumoral localization of lymphonets
(A) Schematic of Visinity neighborhood quantification. Each cell is assigned to a unique neighborhood (all cells within a specified radius to the reference cell). Feature vectors are calculated representing weighted presence of each cell type within a neighborhood. Similar neighborhood vectors correspond to spatial patterns. (B) Visinity embedding of Cre and LucOS; arrows indicate immune neighborhoods enriched in normal (green) and tumor areas (black). (C) CyCIF images and corresponding graphic maps of interacting cell populations (Delaunay Triangulation) in LucOS. (D) Example lymphonets. (E) Lymphonet composition across network sizes. Left, B, T cells; right, T cell subtypes (mean±25th percentile). (F) Number of B cells/network versus lymphonet size (mean). (G) Number of lymphonets identified/mouse of indicated size in Cre- and LucOS-lung tissue. (H) Fraction of B and T lymphocytes and (I) T cell subsets in lymphonets in Cre versus LucOS (n=5 mice/group, bar=mean, two-tailed t-test). (J) Left, density plots of lymphonets by distance from closest blood vessel (y-axis) and tumor (x-axis) in Cre and LucOS. Dot size represents lymphonet size (n=5 mice/group). See also Figure S3 and Table S2.
Figure 4.
Figure 4.. CXCR3 ligands modulate lymphonet formation and size but not intratumoral localization
(A) CyCIF and RNAScope images from LucOS tumor (serial sections); cell type/state calls indicated. (B) %total cells expressing Cxcl9 and Cxcl10 mRNA in Cre- versus LucOS-lung tissue (n=4 mice/group, bar=mean). (C-D) Probability density functions of distance of (C) indicated immune-cell populations or (D) T and B cells in or out of lymphonets from Cxcl9 and Cxcl10 mRNA-expressing cells in Cre and LucOS. (E) Correlation between likelihood of lymphocytes belonging to lymphonets and their distance to the closest Cxcl9 or Cxcl10 mRNA-expressing cells in Cre (blue) and LucOS (red) (n=4 mice/group, bar=mean). (F) Schematic: lentiviral system to deliver dRNAs and HSF1/p65 activation complex for CRISPR-a Cxcl10 in KP Cas9 mice. (G) Images of Cxcl9 and Cxcl10 mRNAs using RNAscope in KP-Cre versus KP Cxcl10-activated tumor nodules. (H) %total cells expressing Cxcl9 and Cxcl10 mRNA in KP-Cre versus KP-Cxcl10 (n=4 mice/group, bar=mean). (I) Number of lymphonets/mouse in KP-Cre, KP-LucOS, and KP-Cxcl10 (n=5 mice/group, bar=mean). (J) Histogram of mean number of lymphonets/mouse of indicated size in KP-Cre and KP-Cxcl10 (n=5 mice/group, two-tailed KS test). (K) Plots of fraction of lymphocyte populations within lymphonets in KP-Cre and KP-Cxcl10 (n=5 mice/group, bar=mean,). All p-value are from two-tailed t-test unless specified. See also Figure S4 and Table S2.
Figure 5.
Figure 5.. Spatial analysis reveals dynamic shifts in Tc cell states and localization with immunotherapy
(A) Palantir projection of CD8+ Tc populations in KP-LucOS mice treated with SIINFEKL (SIIN) and SIYRYYGL (SIY) long-peptide vaccine (Vax) or PBS/Ctrl (n=104 cells sampled from n=8 and 7 mice/treatment). Expression levels of indicated markers are color mapped (normalized between 0.1 and 99thpercentile). Tc states (S1, S2A, S2B, S3) defined by multiparameter measurements indicated at extremes of representation, connected by transitional phenotypes (T1-T3); schematic, right. (B) Normalized fluorescence units for markers in indicated Tc cell states and transitions (mean±25th percentile); summary of Tc states and transitions; table, right. (C) Heat map of Tc cell densities in Palantir projections for Ctrl and Vax groups (n=104 cells/treatment). Right, stacked-bar graph of Tc cell fractions in each state and transition. (D) Heat map of Tc densities in Palantir projections for LucOS following Vax by indicated distance from tumor boundary and (E) their spatial frequency from tumor boundary (Vax). (F) Enrichment of S3 versus S2B relative to boundary. (G) %Tc cells that are TCF1+ PD-1+ in Tc cell states/transitions. See also Figure S5 and Table S2.
Figure 6.
Figure 6.. TCF1+ PD-1+ progenitor CD8+ T cells reside within intratumoral lymphonets
(A) Proportion of T cell subtypes in lymphonets (Ctrl n=7, Vax n=8 mice, mean+SD, same LucOS cohort in Figure 5). (B) Number of T cell subtypes present in lymphonets (bar=mean, two-tailed t-test). (C) Pairwise enrichment analysis of marker co-expression in Tc cells in Ctrl and Vax groups (KS p-value *p<0.05,**p<0.01,***p<10−3,****p<10−4). (D) Plot of Tc cells present in lymphonets versus TCF1+ PD-1+ cells in Ctrl and Vax per mouse (dotted line, linear regression, R2=0.81). (E) Heat map of cell densities of tumor-localized Tc cells present outside and inside lymphonets in Palantir projections for Vax-treated cohort (n=3,736 and 806 cells, respectively). (F) Enrichment of tumor-localized Tc cells in lymphonets for Ctrl and Vax mice. (G) Heat map of cell densities of tumor-localized Tc cells present outside and inside lymphonets in Palantir projections for anti-PD-1 and anti-CTLA-4 treated (ICB) cohort (n=6 mice/group, n=4,276 and 1,041 cells, respectively). (H) Enrichment of tumor-localized Tc cells in lymphonets for Ctrl and ICB mice (n=6 mice/group). (I) Schematic of data interpretation from Figures 5 and 6. See also Figure S6 and Table S2.
Figure 7.
Figure 7.. Lymphonets enriched for TCF1+ PD-1+ progenitor CD8 T cells are abundant in early-stage human lung adenocarcinoma
(A) Sequential clustering of immune, epithelial/tumor, stromal and ‘other’ cell populations (Lv1); immune cells were further clustered into lymphoid and myeloid (Lv2) and immune subsets (Lv3, Lv4). Rows=individual cells. 7.8 × 10⁶ cells plotted from n=14 human lung adenocarcinomas. Immune clusters shown in heat map (right). (B) Horizontal-stacked bar graphs of cell-type fractions (Lv1–2) and lymphocyte-subtype fractions (Lv3-Lv4). (C) H&E, CyCIF representative images; map indicates lymphonet size. Top: tumor with small lymphonets (n<64 cells). Bottom: tumor with large lymphonets (n>64 cells). Scalebar: 1mm. (D) Histogram: average number of lymphonets/sample (n=14) by lymphonet size. (E) Composition of lymphonets by lymphocyte type across different network sizes (mean±25th percentile). (F) Spatial correlation of lymphocytes’ likelihood of belonging to a lymphonet and the likelihood of non-lymphoid cells expressing the indicated markers (n=14 samples, bar=mean, Pearson correlation and p-values). (G) Heat map of density of total Tc in and out of lymphonets of different sizes; density of TCF1+ PD-1+ CD8+ T cells in Palantir projection from 14 human lung adenocarcinomas (n=21*103 cells sampled from n=14 samples). (H) Phenotypic correlation of Palantir distributions of TCF1+ PD-1+ CD8+ Tc cells and lymphonets binned by lymphonet size (correlation of likelihood of CD8+ Tc belonging to a lymphonet (binned by size) and the likelihood of CD8+ Tc being TCF1+ PD-1+); gray lines represent data from individual tumors (n=14, n=3000 cells/sample); black line=mean±SD; Pearson correlation and two-tailed t-test. See also Figure S7, Tables S3 and S4.

Comment in

References

    1. Hanahan D (2022). Hallmarks of Cancer: New Dimensions. Cancer Discovery 12, 31–46. 10.1158/2159-8290.CD-21-1059. - DOI - PubMed
    1. Nirmal AJ, Maliga Z, Vallius T, Quattrochi B, Chen AA, Jacobson CA, Pelletier RJ, Yapp C, Arias-Camison R, Chen Y-A, et al. (2022). The spatial landscape of progression and immunoediting in primary melanoma at single cell resolution. Cancer Discov, candisc.1357.2021. 10.1158/2159-8290.CD-21-1357. - DOI - PMC - PubMed
    1. Bailey C, Black JRM, Reading JL, Litchfield K, Turajlic S, McGranahan N, Jamal-Hanjani M, and Swanton C (2021). Tracking Cancer Evolution through the Disease Course. Cancer Discov 11, 916–932. 10.1158/2159-8290.CD-20-1559. - DOI - PMC - PubMed
    1. Pelka K, Hofree M, Chen JH, Sarkizova S, Pirl JD, Jorgji V, Bejnood A, Dionne D, Ge WH, Xu KH, et al. (2021). Spatially organized multicellular immune hubs in human colorectal cancer. Cell 184, 4734–4752.e20. 10.1016/j.cell.2021.08.003. - DOI - PMC - PubMed
    1. Lin J-R, Wang S, Coy S, Chen Y-A, Yapp C, Tyler M, Nariya MK, Heiser CN, Lau KS, Santagata S, et al. (2023). Multiplexed 3D atlas of state transitions and immune interaction in colorectal cancer. Cell 186, 363–381.e19. 10.1016/j.cell.2022.12.028. - DOI - PMC - PubMed

Publication types