. 2023 May;299(5):104703.
doi: 10.1016/j.jbc.2023.104703. Epub 2023 Apr 12.

A family-wide assessment of latent STAT transcription factor interactions reveals divergent dimer repertoires

Affiliations

A family-wide assessment of latent STAT transcription factor interactions reveals divergent dimer repertoires

Andreas Begitt et al. J Biol Chem. 2023 May.

Abstract

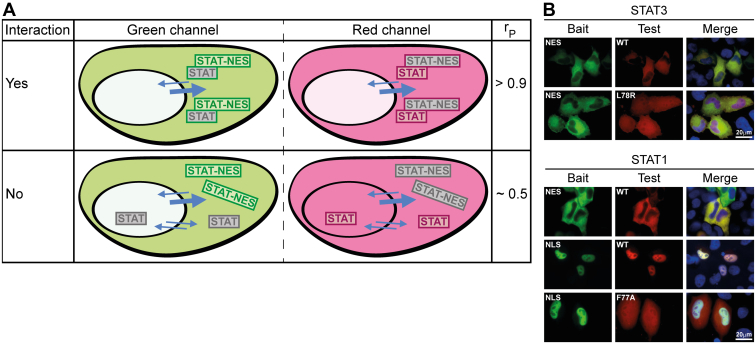
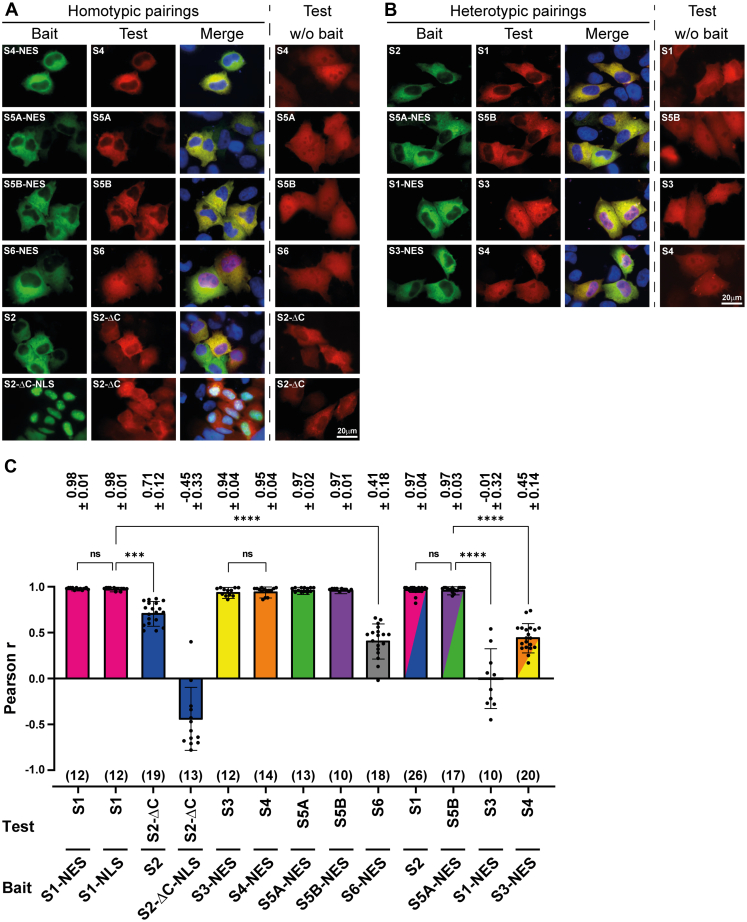
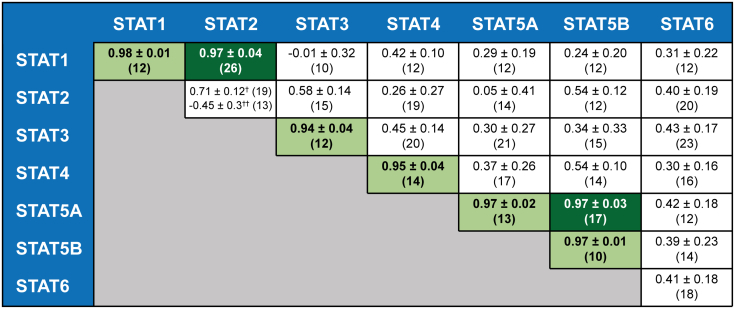
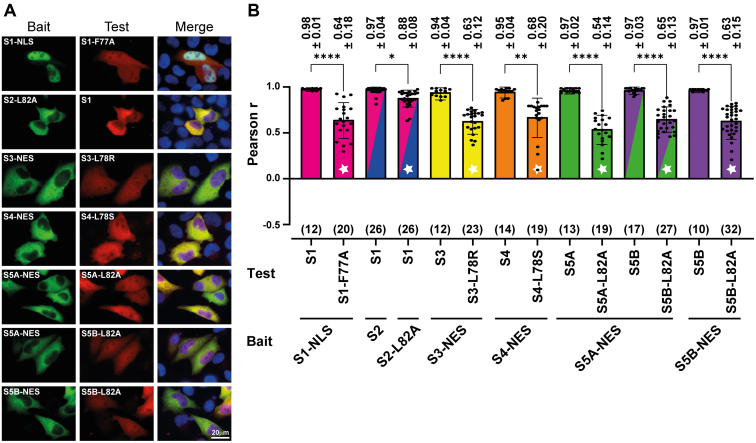
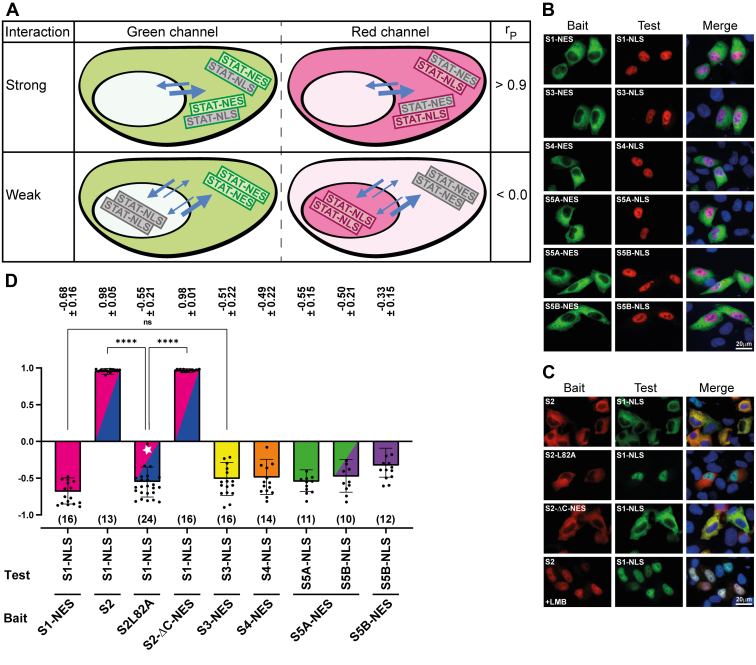
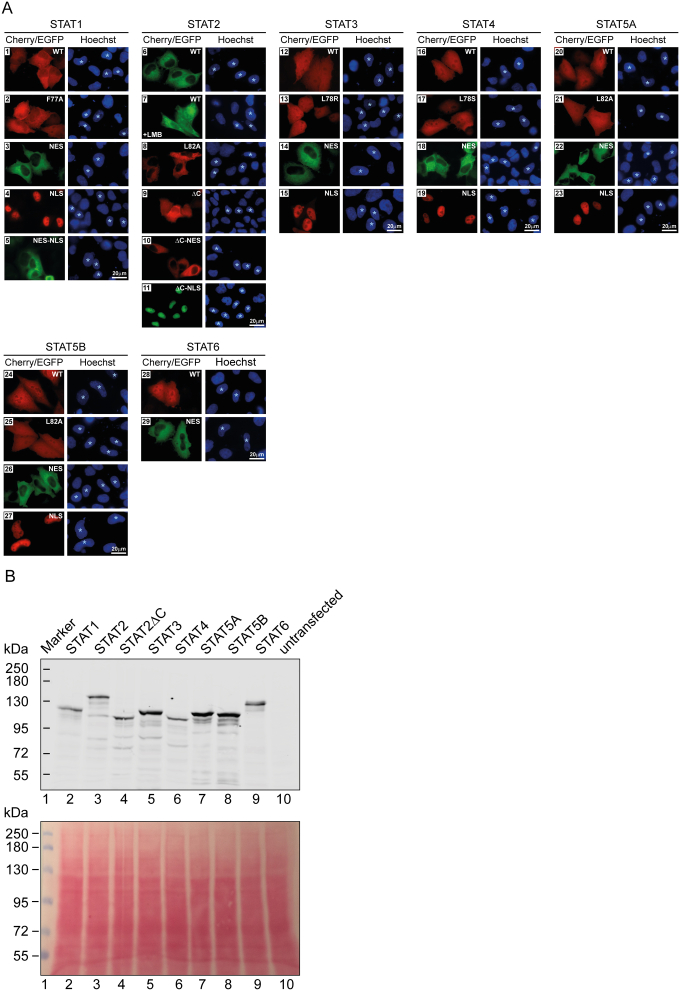
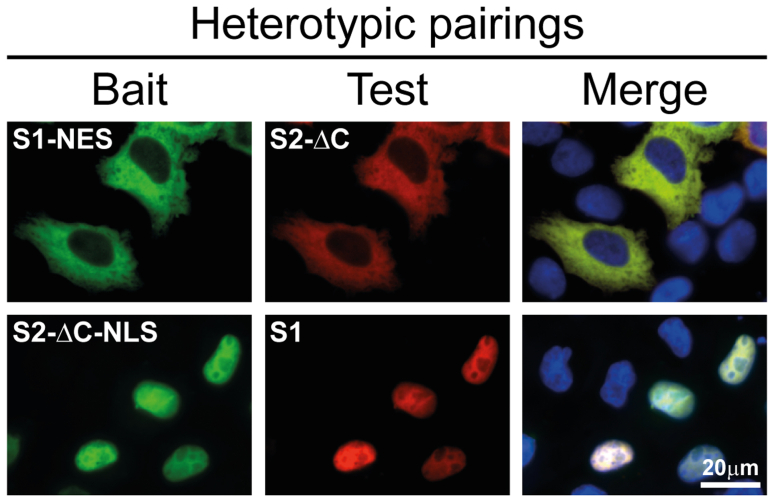
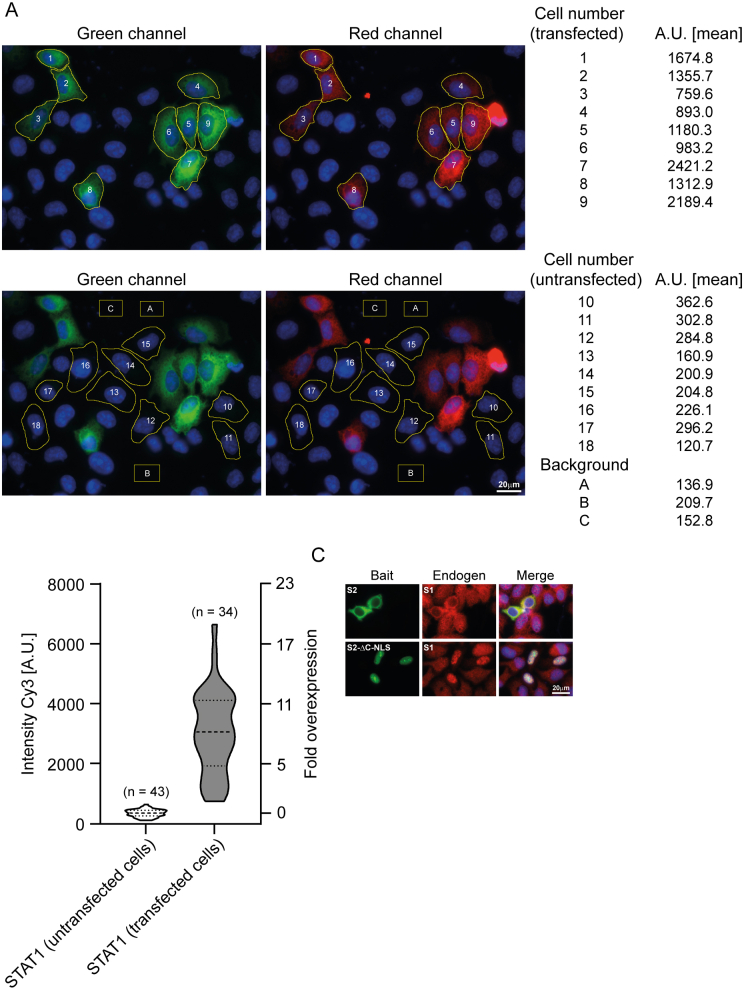
The conversion of signal transducer and activator of transcription (STAT) proteins from latent to active transcription factors is central to cytokine signaling. Triggered by their signal-induced tyrosine phosphorylation, it is the assembly of a range of cytokine-specific STAT homo- and heterodimers that marks a key step in the transition of hitherto latent proteins to transcription activators. In contrast, the constitutive self-assembly of latent STATs and how it relates to the functioning of activated STATs is understood less well. To provide a more complete picture, we developed a co-localization-based assay and tested all 28 possible combinations of the seven unphosphorylated STAT (U-STAT) proteins in living cells. We identified five U-STAT homodimers-STAT1, STAT3, STAT4, STAT5A, and STAT5B-and two heterodimers-STAT1:STAT2 and STAT5A:STAT5B-and performed semi-quantitative assessments of the forces and characterizations of binding interfaces that support them. One STAT protein-STAT6-was found to be monomeric. This comprehensive analysis of latent STAT self-assembly lays bare considerable structural and functional diversity in the ways that link STAT dimerization before and after activation.

Keywords: STAT1; STAT2; STAT3; STAT4; STAT5A; STAT5B; STAT6; dimerization; heterodimer; homodimer; interaction assay; nuclear export signal; nuclear import signal; transcription factor.


Conflict of interest statement

Conflict of interest The authors declare that they have no conflicts of interest with the contents of this article.

Figures

Figure 1
Figure 1
Outline and validation of co-localization as an assay to probe dimerization of latent STATs.A, schematics describing expected subcellular distributions of (top) interacting and (bottom) non-interacting bait (green fluorescence) and test proteins (red fluorescence). Shown are the anticipated outcomes obtained in green and red channels together with associated Pearson correlation coefficients, rP, which quantify the degree of co-localization of the fluorophores, obtained with the co-localization assay. The bait protein is fused to a nuclear export signal (NES), directing it to the cytoplasm, whereas the test protein is without heterologous translocation signal. Arrow orientation and width signify the direction and relative efficiency of nucleocytoplasmic translocation of the different protein species. B, fluorescence micrographs of representative HeLa cells co-expressing bait and test protein combinations for STAT3 (top) and STAT1 (bottom). Baits were directed to the cytoplasm or nucleus through appended NES or NLS signal sequences as indicated in the panels. Homotypic STAT protein interactions were probed by co-expressing bait and wild-type (WT) STATs; mutant STAT1 (F77A) and STAT3 (L78R) were used to examine the consequences of known dimer-dissociating mutations on the co-localization of bait and test STAT proteins. Shown are green channel, red channel, and merged channels, which includes visualization of nuclei using Hoechst dye (blue).
Figure 2
Figure 2
Latent STATs assemble five homodimers and two heterodimers via N-domain interactions.A and B, fluorescence micrographs of representative HeLa cells co-expressing the indicated homotypic (A) and heterotypic (B) bait and test STAT protein pairings. Shown are the green channel, red channel, and merged channels, which includes visualisation of nuclei using Hoechst dye (blue). The rightmost columns show the distribution of test proteins in cells that do not co-express the bait (w/o bait). C, bar diagram depicting corresponding Pearson correlation coefficients (rP) for the experiments shown in (A) and (B) with the individual data points (black dots) super imposed. Co-localization was determined in eligible cells, that is, cells that expressed bait and test proteins from equimolar amounts up to a 4-fold excess of bait protein. ∗p < 0.05; ∗∗p < 0.01; ∗∗∗p < 0.001; ∗∗∗∗p < 0.0001 using a Kruskal–Wallis test; ns, not significant. Rp numerical values ± SD are given above the bars; the number of cells analyzed in each experiment are shown in brackets below bars. Error bars, SD.
Figure 3
Figure 3
Homo- and heterotypic dimerization of the unphosphorylated STAT proteins. Summary of Pearson correlation coefficients obtained with the translocation assay for the 28 possible pairings of unphosphorylated STAT proteins. Data are obtained with NES fusion proteins and wild-type STAT2 as the baits. STAT2 homodimer data are for U-STAT2:STAT2ΔC (†) and U-STAT2ΔC-NLS:STAT2ΔC (††). Given are means ± standard deviation. Light and dark green highlighting marks stable homo- and heterodimers, respectively. Number of cells analyzed in each experiment are shown in brackets. See data availability section for source data.
Figure 4
Figure 4
Dimer assembly of latent STATs requires N-domain interactions.A, fluorescence micrographs of representative HeLa cells co-expressing bait and test STAT proteins. Bait proteins were directed to the nucleus or cytoplasm by appending heterologous NLS or NES signals (endogenous NES activity was used for STAT2), and the effect of single, potentially dimer-disrupting N-domain residues was probed on the co-localization of bait and test proteins. Presented are the green channel, red channel, and merged channels, which includes visualisation of nuclei using Hoechst dye (blue). B, bar diagram depicting corresponding Pearson correlation coefficients (rP) for the experiments shown in (A) with the individual data points (black dots) super imposed. Co-localization was determined as described in Figure 2C. ∗p < 0.05; ∗∗p < 0.01; ∗∗∗p < 0.001; ∗∗∗∗p < 0.0001 using a Kruskal–Wallis test. Rp numerical values ± SD are given above the bars; the number of cells analysed in each experiment are shown in brackets below bars. White stars signify homo- or heterodimers containing the indicated N-domain mutations. Error bars, SD.
Figure 5
Figure 5
U-STAT1:STAT2 heterodimers are exceptionally stable compared to the other latent STAT dimers.A, schematics describing a co-localization assay for probing the interaction strength of dimer-forming STATs. Antagonistic heterologous translocation activities (NES or NLS) are appended to bait (green fluorescence) and test (red fluorescence) proteins, respectively, whereby NES activity is dominant. Arrow orientation and width signify the direction and relative efficiency of signal-mediated protein translocation. B, fluorescence micrographs of representative HeLa cells co-expressing bait and test STAT proteins. Shown are the consequences for the co-localization of bait and test STAT proteins if they each were fused to one of the two opposed translocation signals (NES or NLS) as indicated. Presented are the green channel, red channel, and merged channels, which includes the Hoechst-stained cell nuclei (blue). C, same as (B). Where indicated (+LMB), cells were treated for 4 h with leptomycin B before imaging to inhibit NES-mediated nuclear export. D, bar diagram depicting corresponding Pearson correlation coefficients (rP) for experiments shown in (B) and (C) with the individual data points (black dots) super imposed. Co-localization was determined as described in Figure 2C. ∗∗∗∗p < 0.0001 using a Kruskal–Wallis test; ns, not significant. White star signifies heterodimer containing the indicated N-domain mutation. Rp numerical values ± SD are given above the bars; the number of cells analysed in each experiment are shown in brackets below bars. Error bars, SD.
Supporting Figure S1
Characterization of STAT variant proteins used.A, Representative micrographs of HeLa cells expressing the indicated STAT variant proteins. The intracellular distributions of the following STAT-fluorophore fusion proteins are shown. Wild-type STAT1-6; N-domain mutated STATs (F77A, L78R/S, L82A); full-length STATs with heterologous signal sequence for either nuclear export (NES) or nuclear import (NLS) appended; full-length STAT1 with both the export and import signal sequences appended (NES-NLS); truncated STAT2 devoid of the C-terminus (ΔC); C-terminally truncated STAT2 with heterologous signal sequence for either nuclear export (NES) or nuclear import (NLS) appended. Presented are the green or red channels, and the Hoechst-stained cell nuclei (blue). Where there was treatment with leptomycin B (+LMB) it was for 4 h. The nuclei of interest are labelled with white asterisks to facilitate the matching of the GFP/Cherry signals and the Hoechst staining. B, Western blotting results using whole cell lysates (30 μl/lane) from HEK293T cells expressing mCherry fusion proteins of the full-length STATs or C-terminally truncated STAT2, as indicated. After blotting, total protein was stained with Ponceau S (bottom panel), followed by incubation with anti-mCherry antibody and immunodetection (top panel). In brief, experimental details were as follows. Twenty hours after transient transfection with vectors encoding STAT-mCherry fusion proteins as indicated, 4 × 106 HEK293T cells (transfection efficiency ∼70%) were lysed by boiling in 0.5 ml 2× SDS sample buffer (42 mM Tris-HCl, pH 6.8, 1.3% SDS (w/v), 233 mM DTT, 8.3% glycerol (v/v), 0.04 % Bromphenol blue). Proteins (30 μl/lane) were resolved by 7% SDS-PAGE followed by semi-dry protein transfer to a nitrocellulose membrane. Total protein loading was visualized by staining with 0.1% (w/v) Ponceau S in 1% (v/v) acetic acid for 1 min. Excess stain was removed with water (1 min), followed by blocking in 4% (w/v) dried skimmed milk powder in Tris-buffered saline containing 0.05% (v/v) Tween 20 (Sigma) and incubation with rabbit polyclonal anti-mCherry antibody (GTX128509, GeneTex). IRDye 800CW-coupled goat anti-rabbit secondary antibody (#926-32211) was from Li-Cor Bioscience. Blots were imaged by infrared fluorescence detection (Odyssey, Li-Cor Bioscience).
Supporting Figure S2
U-STAT1:STAT2 heterodimers do not require the C-terminal transactivation domain of STAT2. Representative micrographs of HeLa cells expressing the indicated bait and test protein pairings of variants of STAT1 and C-terminally truncated STAT2. (S1) wild-type STAT1; (S1-NES) full-length STAT1 with heterologous nuclear export signal appended; (S2-ΔC) truncated STAT2 devoid of the C-terminus and its intrinsic nuclear export activity; (S2-ΔC-NLS) C-terminally truncated STAT2 with heterologous nuclear import signal appended. Presented are the green channel, red channel, and merged channels, which includes the Hoechst-stained cell nuclei (blue).
Supporting Figure S3
Assessing the distribution of endogenous STAT1 and the level of STAT1 overexpression in transiently transfected HeLa cells used in this work.A, HeLa cells were transfected with STAT1-mEGFP expression plasmid as described under Cell Culture and Transfections in the main text using 1.2 μg DNA/well of a 24-well plate. After 20 h, cells were fixed as described under Fluorescence Imaging in the main text, followed by blocking for 1 h in 20% (v/v) FBS/PBS prior to 15 h incubation at 4 °C with primary anti-STAT1 monoclonal antibody (Becton-Dickinson 610186), washing in FBS/PBS and incubation for another hour with Cy3-coupled goat anti-mouse IgG secondary antibody (Jackson ImmunoResearch 115-165-062). Shown are four composite images of the same field of view. Top left, composite image of green channel (showing expression of transfected STAT1-mEGFP fusion protein) and blue channel (showing Hoechst-stained cell nuclei) with manually segmented transfected cells, based on EGFP fluorescence signals, numbered 1 to 9. Top right, composite of red and blue channels representing STAT1 overexpression in transfected cells. Bottom left, same as top left, but with segmentation of untransfected cells 10 to 18. Cell segmentations are based on green autofluorescence. Bottom right, composite of red and blue channels representing endogenous STAT1 in untransfected cells. Average red fluorescence intensities (A.U., background-subtracted) for cells 1 to 18 are listed on the right, together with average background fluorescence in cell-free areas recorded in the squares labelled (AC). B, Violin plots summarizing the distributions of fluorescence data for untransfected and transiently transfected Hela cells, representing endogenous and overexpressed STAT1 levels. Plots include the data collected from the micrograph shown in (A) and four more. The centre lines of the plots represent the group median, the top and bottom lines represent the 75th and 25th percentiles. Fluorescence intensities are background-subtracted. The number of cells analysed are shown in brackets. C, Hela cells expressing mEGFP fusion proteins of wild-type STAT2 (S2) or NLS-tagged C-terminally truncated STAT2 (S2-ΔC-NLS) are shown after labelling with anti-STAT1 antibody to detect the distribution of endogenous STAT1 as described above. Note co-localization of the native cellular STAT1 with the transfected bait proteins. STAT1 immunostaining was done as described in (A) above. Fluorescence emission intensities given as arbitrary light units (A.U.).
Supporting Figure S4
Calibration of image acquisition settings using a mCherry-mEGFP fusion protein.A, Quantitative imaging results of HeLa cells transiently expressing a fusion protein consisting of mEGFP and mCherry connected by a rigid α-helical linker. At each of the two [red/green] exposure time ratios of 1 and 0.5 used, three different cells each were imaged repeatedly using the exposure times listed in the Figure. Given are the readings for individual cells and the resulting regression curves. Note linear relationships of red and green fluorescence emissions for different exposure time lengths and ratios. Fluorescence emission intensities given as arbitrary light units (A.U.). B, Same as (A), but 32 different cells were imaged using the same exposure times of 30 ms and 68 ms for red and green channels, respectively. This [red/green] exposure time ratio of 0.44 resulted in nearly identical mEGFP and mCherry fluorescence emissions over a wide range of signal intensities. It was therefore used in all experiments to quantify the relative expression levels of co-expressed STAT proteins fused to these fluorophores. In the quantitative imaging experiments shown in Figure 2, Figure 3, Figure 4, Figure 5, exposure times between 15 ms and 300 ms were used for red fluorescence and respective times for green fluorescence. The inset shows a representative fluorescence micrograph of HeLa cells expressing the mEGFP-mCherry fusion protein.

Similar articles

Cited by

References

    1. Levy D.E., Darnell J.E., Jr. STATs: transcriptional control and biological impact. Nat. Rev. Mol. Cell Biol. 2002;3:651–662. - PubMed
    1. Morris R., Kershaw N.J., Babon J.J. The molecular details of cytokine signaling via the JAK/STAT pathway. Protein Sci. 2018;27:1984–2009. - PMC - PubMed
    1. O'Shea J.J., Schwartz D.M., Villarino A.V., Gadina M., McInnes I.B., Laurence A. The JAK-STAT pathway: impact on human disease and therapeutic intervention. Annu. Rev. Med. 2015;66:311–328. - PMC - PubMed
    1. Philips R.L., Wang Y., Cheon H., Kanno Y., Gadina M., Sartorelli V., et al. The JAK-STAT pathway at 30: much learned, much more to do. Cell. 2022;185:3857–3876. - PMC - PubMed
    1. Schindler C., Levy D.E., Decker T. JAK-STAT signaling: from interferons to cytokines. J. Biol. Chem. 2007;282:20059–20063. - PubMed

Publication types

MeSH terms