. 2023 Apr 14;6(6):e202201675.
doi: 10.26508/lsa.202201675. Print 2023 Jun.

Yolk-deprived Caenorhabditis elegans secure brood size at the expense of competitive fitness

Affiliations

Yolk-deprived Caenorhabditis elegans secure brood size at the expense of competitive fitness

Ellen Geens et al. Life Sci Alliance. .

Abstract

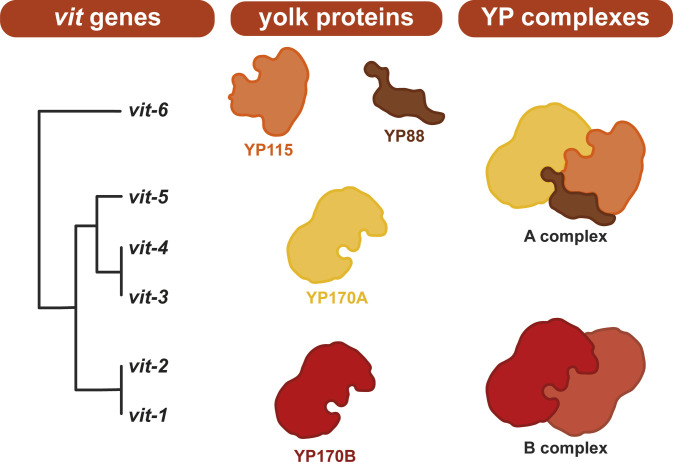
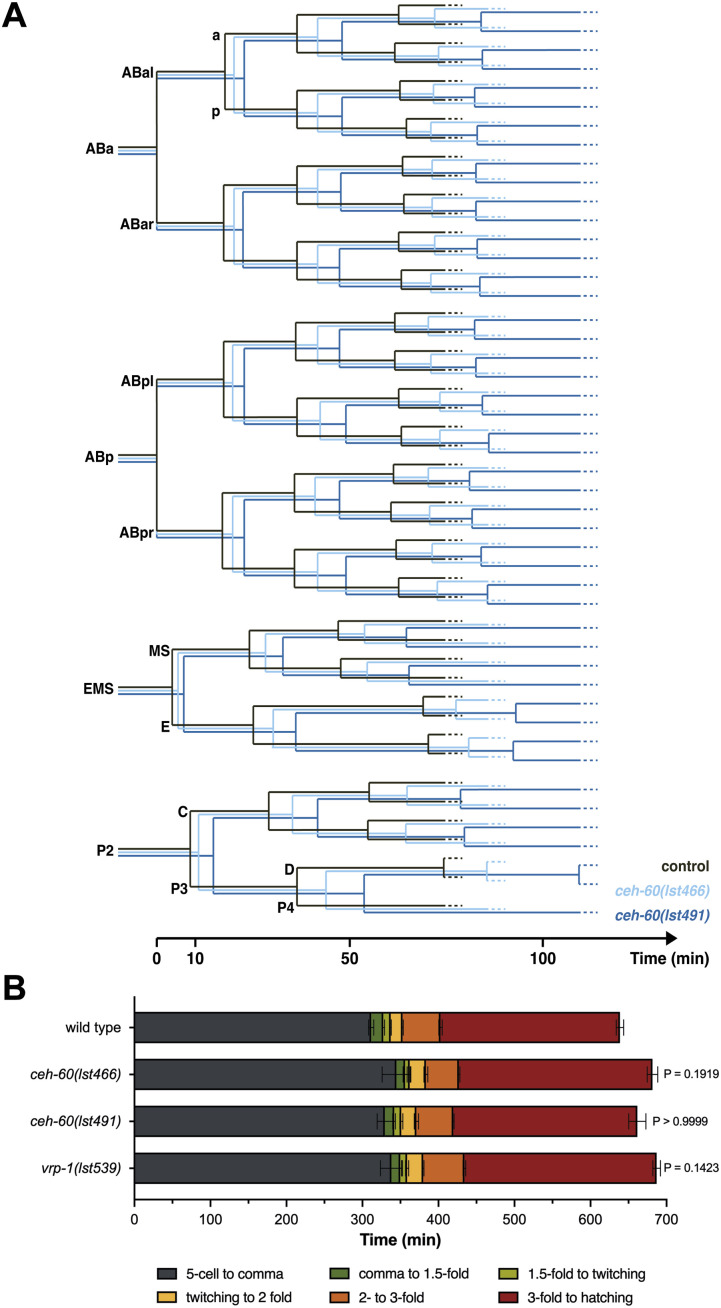
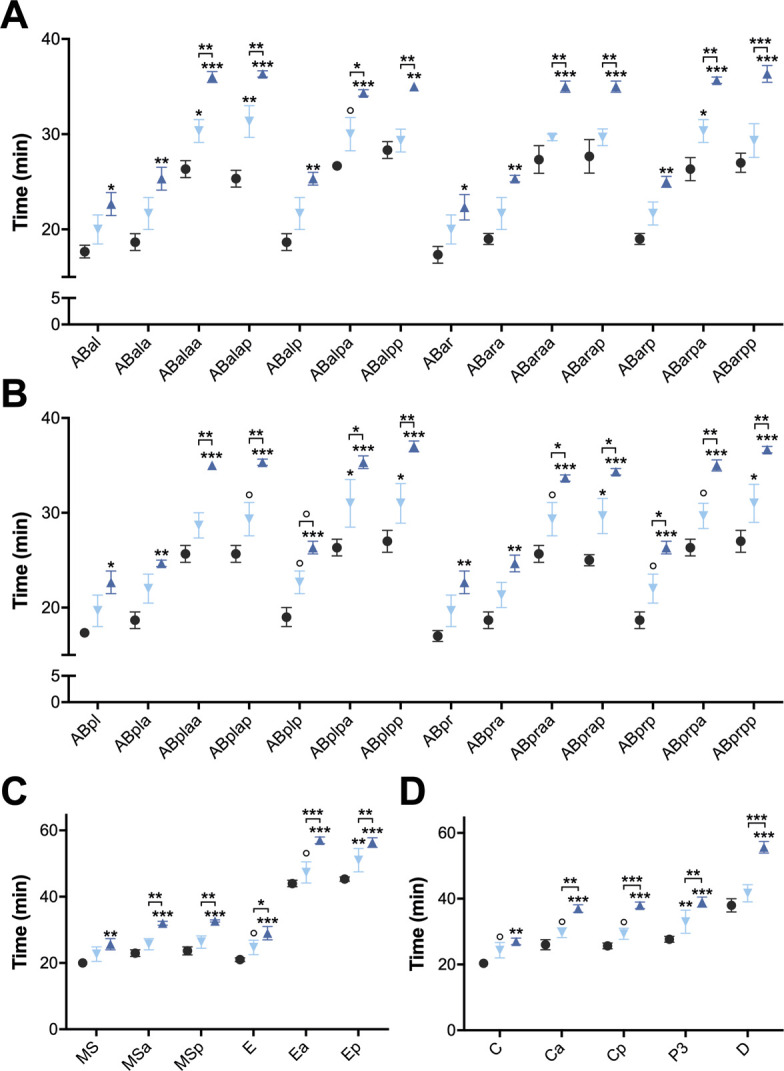
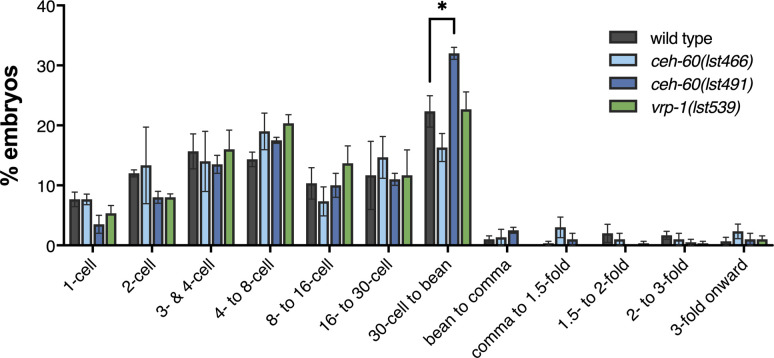
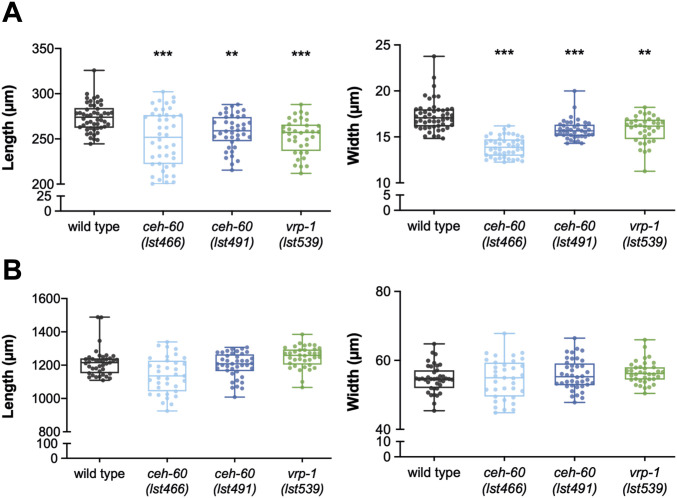
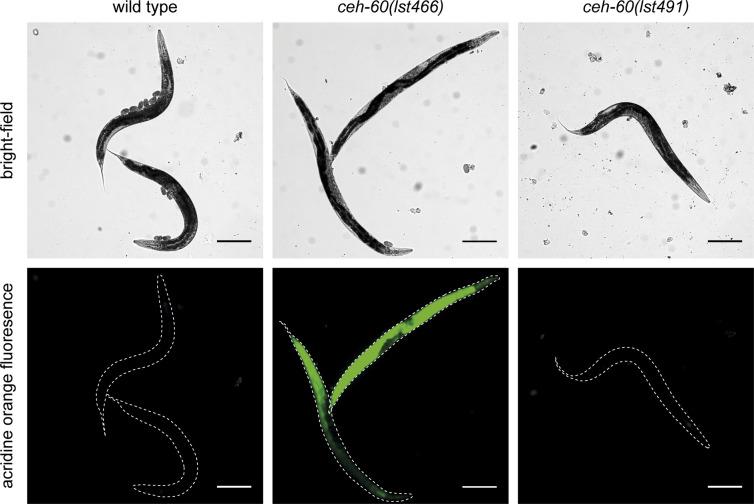
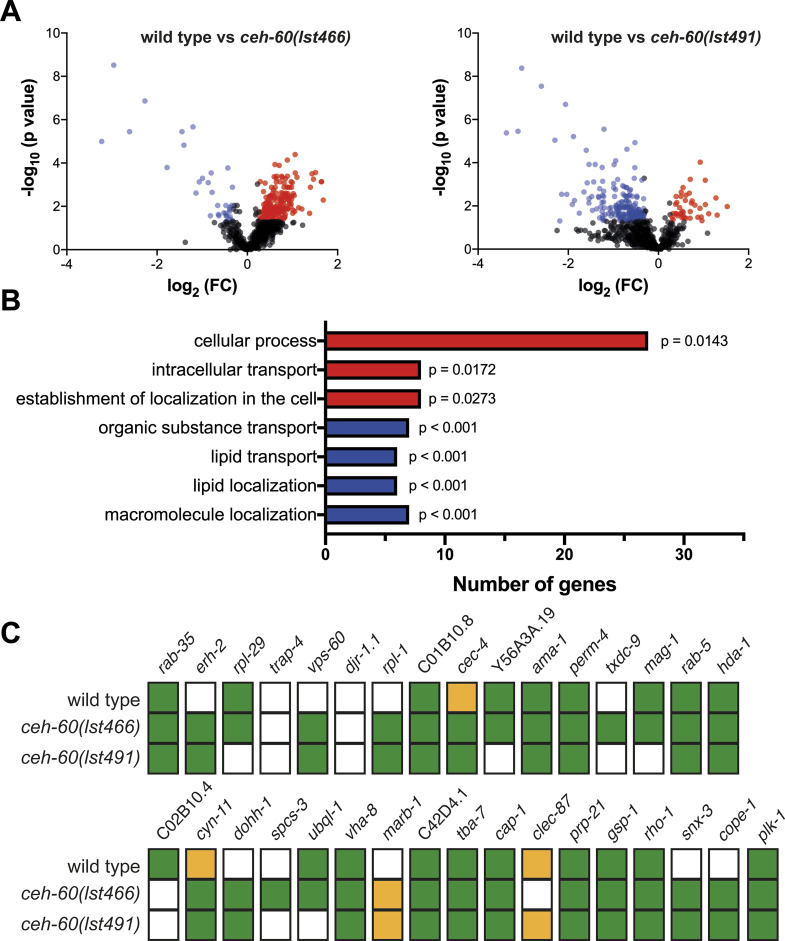
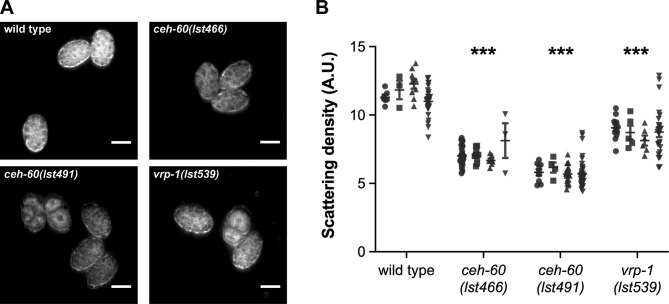
Oviparous animals support reproduction via the incorporation of yolk as a nutrient source into the eggs. In Caenorhabditis elegans, however, yolk proteins seem dispensable for fecundity, despite constituting the vast majority of the embryonic protein pool and acting as carriers for nutrient-rich lipids. Here, we used yolk protein-deprived C. elegans mutants to gain insight into the traits that may yet be influenced by yolk rationing. We show that massive yolk provisioning confers a temporal advantage during embryogenesis, while also increasing early juvenile body size and promoting competitive fitness. Opposite to species that reduce egg production under yolk deprivation, our results indicate that C. elegans relies on yolk as a fail-safe to secure offspring survival, rather than to maintain offspring numbers.


Conflict of interest statement

The authors declare that they have no conflict of interest.

Figures

Figure S1.
Figure S1.. Schematic overview of the formation of C. elegans yolk protein (YP) complexes.
C. elegans expresses six vitellogenin genes (vit-1 to -6) in its intestine which together give rise to four yolk proteins—two with a molecular weight of ∼170 kD, YP170B (encoded by vit-1/2) and YP170A (encoded by vit-3/4/5), and YP115 and YP88 (encoded by vit-6) with molecular weights of ∼115 and ∼88 kD, respectively. YP170A, YP115, and YP88 together form the A complex of yolk proteins, whereas YP170B dimerizes to form the B complex (Sharrock et al, 1990). vit genes lineage tree was adapted from the study of Perez and Lehner (2019). Shapes of the different yolk protein representations are illustrative and do not represent 3D structure of the corresponding yolk proteins.
Figure 1.
Figure 1.. Embryonic development is delayed in ceh-60 and vrp-1 mutants.
(A) Cell cycle measurements were used to construct an embryonic lineage tree of control, ceh-60(lst466) and ceh-60(lst491) worms expressing nuclear GFP (data from detailed tracking of three independently imaged embryos per condition). For both ceh-60 mutants, every tracked cell shows an increase in cell cycle duration in comparison with controls. Timing starts at the division of the ABa/p cells and observation continued until the D-cell division. After a founder cell has been born, all corresponding daughter cells are named based on their position across the anterior–posterior axis. The anterior (a) daughter cell is placed at the top of the branch, whereas the posterior (p) is placed at the bottom. Detailed statistical analysis can be found in Fig S2. (B) Overall, the embryonic development of the yolk protein–deprived ceh-60(lst466), ceh-60(lst491), and vrp-1(lst539) mutants exhibit a small, although not significant, delay in comparison to WT development. Indication of recognizable embryonic stages reveals that the yolk protein–deprived worms consistently require more time to reach a next stage, except when passing from the comma to 1.5-fold stage. P-values at the end of the bar plot compare the time needed for the embryo to hatch starting from the 5-cell stage (two-sided Kruskal–Wallis test with Dunn’s post hoc test, N ≥ 5). Error bars represent standard error of mean. Source data are available for this figure.
Figure S2.
Figure S2.. Cell cycle duration in yolk protein–deprived ceh-60 embryos is increased as early as the first embryonic cell divisions.
Comparison of cell cycle duration of embryonic cells born between the division of the ABa/p and the formation of the D cell of control (●), ceh-60(lst466) (), and ceh-60(lst491) () embryos for cells originating from the ABa (A), ABp (B), EMS (C), and P2 (D) cell. Although the increase in cell cycle duration is more pronounced in ceh-60(lst491) embryos, for both ceh-60 mutants, every tracked cell shows a consistent increase in cell cycle duration in comparison with the control. Statistical significance compared with control was determined using two-way ANOVA with Benjamini–Hochberg post hoc test. ° P ≤ 0.10, *P ≤ 0.05, **P ≤ 0.01, ***P ≤ 0.001. N = 3.
Figure S3.
Figure S3.. Embryos collected from WT, ceh-60, and vrp-1 worms do not differ in stage.
Embryos collected via hypochlorite treatment from WT, ceh-60, and vrp-1 worm populations at the first day of adulthood were staged, and the proportion of embryos from a certain stage were determined. Statistical significance compared with WT was determined using two-way ANOVA with Benjamini–Hochberg post hoc test. *P ≤ 0.05, ≥ 2 biological replicates with N ≥ 24. Source data are available for this figure.
Figure 2.
Figure 2.. The body size defect found in L1 juveniles of yolk protein–deprived ceh-60 and vrp-1 mutants has disappeared by adulthood.
(A) Both the length (midline) and width (at grinder) of L1 juveniles are significantly decreased in ceh-60(lst466), ceh-60(lst491), and vrp-1(lst539). (B) However, ceh-60 and vrp-1 mutants have a WT body size when reaching adulthood. Statistical significance compared with WT was determined using two-sided Kruskal–Wallis test with Dunn’s post hoc test (A, B left) and one-way ANOVA with Tukey’s post hoc test (B right). **P ≤ 0.01, ***P ≤ 0.001. N ≥ 35. Source data are available for this figure.
Figure S4.
Figure S4.. ceh-60(lst466), but not ceh-60(lst491) mutants have a more permeable cuticle.
As observed by Van de Walle et al (2019), acridine orange stains ceh-60(lst466) animals. In contrast, in ceh-60(lst491) mutants, no fluorescence signal can be observed after acridine orange staining similar to WT animals, indicating that ceh-60(lst491) does not have a more permeable cuticle as found in ceh-60(lst466) mutants. White dashed lines show the worm’s outline. Scale bar 200 μm.
Figure S5.
Figure S5.. Differential analysis of the protein content of yolk protein–deprived ceh-60 mutant compared with yolk protein–provided WT embryos.
(A) Volcano plot of differential proteins found in ceh-60(lst466) (left) and ceh-60(lst491) (right) versus WT embryos. Blue dots represented less abundant proteins, whereas red dots indicated more abundantly present proteins. Proteins with no significant difference are colored grey. (B) GO analysis of proteins more or less abundantly present in embryos of both ceh-60(lst466) and ceh-60(lst491) mutants. Terms linked to more and less abundantly present proteins are colored red and blue, respectively. After each biological process, the false discovery rate corrected P-value is given. GO analysis was carried out with PANTHER 17.0 using statistical overrepresentation test for biological processes (complete). Output files of PANTHER analysis can be found in Fig S5B Source Data (C) Summary of early reproduction screen to probe for relevance of differential proteomics hits to reproduction of ceh-60 mutants. Knockdown via RNAi of genes that caused a significant decrease in number of offspring compared with empty vector condition is colored green. Yellow boxes show significant increases. Targets are ordered based on their measured fold changes (Table S1). RNAi targeting plk-1 was used as a positive control. Because no correct RNAi constructs were available for elc-1, rps-5, and sart-3, we omitted these from our screen. Source data are available for this figure.
Figure S6.
Figure S6.. Lipid content is decreased in yolk protein–deprived ceh-60 and vrp-1 embryos independent of the embryonic stage.
(A) Representative dark field microscopy images of WT, ceh-60(lst466), ceh-60(lst491), and vrp-1(lst539) embryos. (B) Fat content of ceh-60 and vrp-1 embryos, measured by optical scattering (Fouad et al, 2017), is significantly reduced in comparison to WT embryos collected from day-1-old adults. Data per genotype are shown by embryonic stage: 1- to 8-cell (●), 8- to 16-cell (■), 16- to 30-cell (▲), and 30+-cell (▼). Scale bar 30 μm. Statistical significance compared with WT was determined using two-sided Kruskal–Wallis with Dunn’s post hoc test: ***P ≤ 0.001. N ≥ 44. A.U., arbitrary unit. Source data are available for this figure.
Figure 3.
Figure 3.. ceh-60 affects RME-2 levels and localization in oocytes and embryos.
(A) Fluorescent images of adult worms expressing rme-2p::rme-2::GFP::rme-2 3′UTR show that in WT and ceh-60(lst466) oocytes, RME-2 is primarily located at the plasma membrane, whereas a ceh-60(lst491) mutation leads to RME-2 signal in the cytoplasm. (A, B) However, oocytes of both ceh-60 mutants express the yolk protein receptor RME-2 in younger oocytes compared with WT worms. (C) Using quantitative RT–PCR, quantification at the RNA level showed that ceh-60 mutants do not contain more rme-2 transcripts, that is, they do not increase expression of the yolk protein receptor. (D) Fluorescence of WT, ceh-60(lst466) and ceh-60(lst491) embryos and (E) signal quantification revealed that RME-2 fluorescence in ceh-60(lst491) () embryos is maintained at high levels as embryogenesis continues, compared with near-absence of this signal in WT (●) and ceh-60(lst466) () embryos. (F) However, rme-2 transcript levels (measured via qRT-PCR) in ceh-60(lst491) embryos do not differ from those of WT and/or ceh-60(lst466) embryos. Fluorescent images are pseudocolored by pixel intensity, with calibration bar in (A) valid for all fluorescent images. Scale bar 20 μm. White dashed lines show the imaged worm’s or embryo’s outline. Statistical significance compared with WT in (B) was determined using two-sided Kruskal–Wallis with Dunn’s post hoc test (N ≥ 15). In (C, F), statistical significance compared with WT was determined using one-way ANOVA and Tukey’s post hoc test, based on four independent experiments with ≥ 1,450 and 13,500 individuals for (C) and (F), respectively. In (E), statistical significance compared with WT was determined using two-way ANOVA with Benjamini–Hochberg post hoc test (N ≥ 7) ns = not significant. *P ≤ 0.05; ***P ≤ 0.001. A.U., arbitrary unit; Rel., relative. Source data are available for this figure.
Figure 4.
Figure 4.. Survival of postembryonic starvation is affected in yolk protein–deprived L1 juveniles.
(A) Compared with WTs (●), the survival curves of ceh-60(lst466) (), ceh-60(lst491) (), and vrp-1(lst539) () L1 juveniles were significantly different (P < 0.001) when kept in complete absence of food. (B) Under the same conditions, decreasing YP170 levels lead to defective survival as apparent by the significant differences found in survival curves between WT (●) and YP170B-deprived () (vit-2(lst1671) vit-1(lst1678); P < 0.001), YP170(A&B)-deprived () (vit-5 RNAi–treated vit-2(lst1671) vit-1(lst1678); P < 0.001), and total YP-deprived L1s () (vit-5 RNAi–treated vit-6(lst1667); vit-2(lst1671) vit-1(lst1678); P < 0.001). Survival curves of YP170-deprived and total yolk protein–deprived L1s were not significantly different from each other, suggesting that vit-6 deletion does not determine the capacity of L1 juveniles to survive postembryonic starvation (P = 0.607). Statistical analysis was performed using a log-rank test of smoothed survival curves, based on averages of three independent replicates. Error bars represent standard error of mean. Source data are available for this figure.
Figure S7.
Figure S7.. Combinations of genetic and RNAi interventions affect YP170 levels as expected when influencing vit expression.
YP170B-deprived worms (vit-2(lst1671) vit-1(lst1678) X) exhibit a decrease in YP170 in comparison to WTs (+P = 0.0571). Additional YP170A deprivation achieved by vit-5 RNAi treatment further decreases the amount of YP170 present in the worms. A similar decrease in YP170 could be observed in vit-5 RNAi–treated WT animals indicating that the vit-5 RNAi construct not only targets vit-3 to -5 but also vit-1 and vit-2. Statistical significance compared with WT was determined using two-way ANOVA with Benjamini–Hochberg post hoc test. *P ≤ 0.05, ***P ≤ 0.001, ns, not significant. N ≥ 3. Error bars represent SEM. Source data are available for this figure.
Figure 5.
Figure 5.. Total YP170 matters to competitive fitness of C. elegans.
(A) Mutants of vitellogenesis regulators ceh-60 and vrp-1 exhibit a competitive disadvantage in comparison to yolk protein–provisioned WTs. (B) Abolishment of all YP170 (vit-5 RNAi–treated vit-2(lst1671) vit-1(lst1678)) and of all yolk proteins (vit-5 RNAi–treated vit-6(lst1667); vit-2(lst1671) vit-1(lst1678)), leads to a significant decrease in competitive fitness compared with WTs. In contrast, removal of YP115 and YP88 in vit-6(lst1667) animals, or of YP170B alone in vit-2(lst1671) vit-1(lst1678) worms, does not affect the competitive fitness of C. elegans. Statistical significance compared with WT was determined using two-sided Kruskal–Wallis with Dunn’s post hoc test. *P ≤ 0.05, **P ≤ 0.01, ***P ≤ 0.001. N ≥ 21. Source data are available for this figure.
Figure S8.
Figure S8.. YP170B- or YP115/YP88-deprived worms do not exhibit a competitive fitness defect on OP50.
Same as with the case when worms are kept on HT115 (Fig 5), YP170B-deprived worms (vit-2(lst1671) vit-1(lst1678)) and YP115- and YP88-deprived (vit-6(lst1667)) worms do not exhibit a decrease in competitive fitness in comparison to yolk protein–provisioned WTs (resp. P = 0.1120 and P = 0.6248). Statistical significance compared with WT was determined using one-way ANOVA with Tukey’s post hoc test. N ≥ 23. Source data are available for this figure.

References

    1. Ahringer J (1995) Embryonic tissue differentiation in Caenorhabditis elegans requires dif-1, a gene homologous to mitochondrial solute carriers. EMBO J 14: 2307–2316. 10.1002/j.1460-2075.1995.tb07225.x - DOI - PMC - PubMed
    1. Artyukhin AB, Schroeder FC, Avery L (2013) Density dependence in Caenorhabditis larval starvation. Sci Rep 3: 1–7. 10.1038/srep02777 - DOI - PMC - PubMed
    1. Aubret F, Bignon F, Bouffet-Halle A, Blanvillain G, Kok PJR, Souchet J (2017) Yolk removal generates hatching asynchrony in snake eggs. Sci Rep 7: 3041. 10.1038/s41598-017-03355-y - DOI - PMC - PubMed
    1. Balklava Z, Pant S, Fares H, Grant BD (2007) Genome-wide analysis identifies a general requirement for polarity proteins in endocytic traffic. Nat Cell Biol 9: 1066–1073. 10.1038/ncb1627 - DOI - PubMed
    1. Bao Z, Murray JI, Boyle T, Ooi SL, Sandel MJ, Waterston RH (2006) Automated cell lineage tracing in Caenorhabditis elegans. Proc Natl Acad Sci U S A 103: 2707–2712. 10.1073/pnas.0511111103 - DOI - PMC - PubMed

Publication types

LinkOut - more resources