. 2023 Apr 14;14(1):2144.
doi: 10.1038/s41467-023-37761-w.

Homology directed telomere clustering, ultrabright telomere formation and nuclear envelope rupture in cells lacking TRF2B and RAP1

Affiliations

Homology directed telomere clustering, ultrabright telomere formation and nuclear envelope rupture in cells lacking TRF2B and RAP1

Rekha Rai et al. Nat Commun. .

Erratum in

Abstract

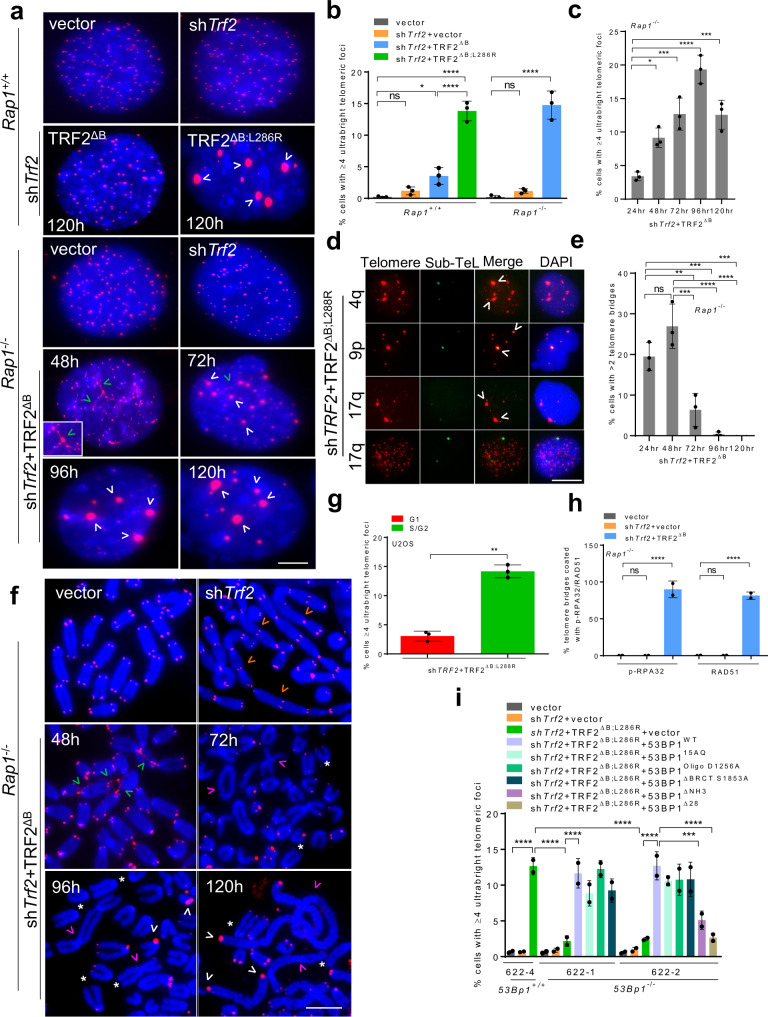
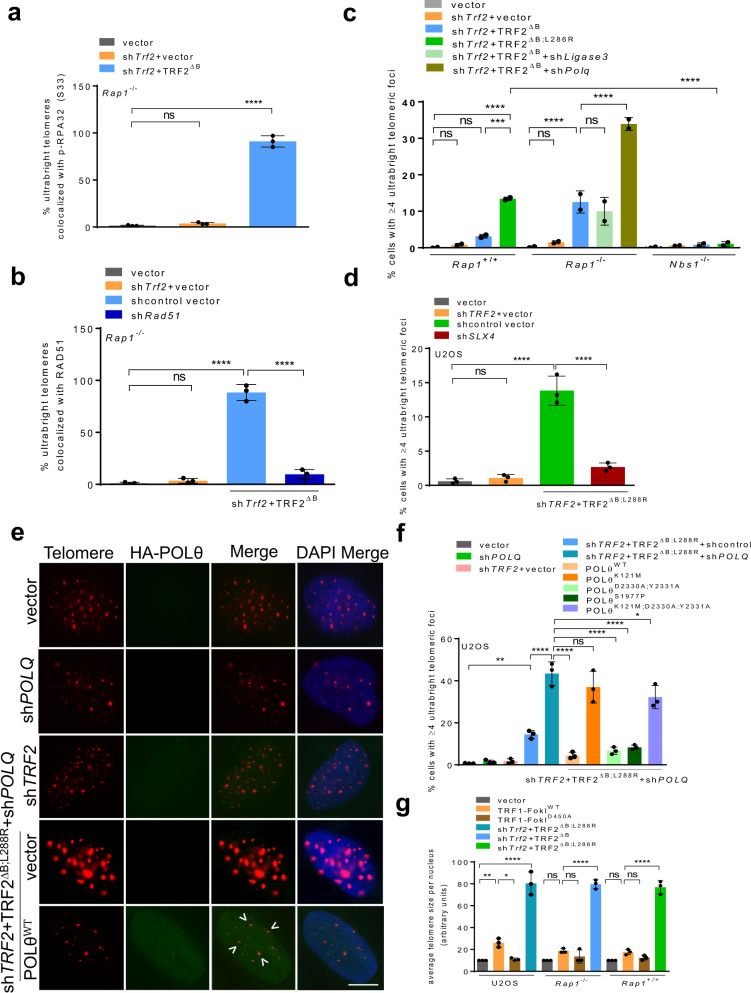
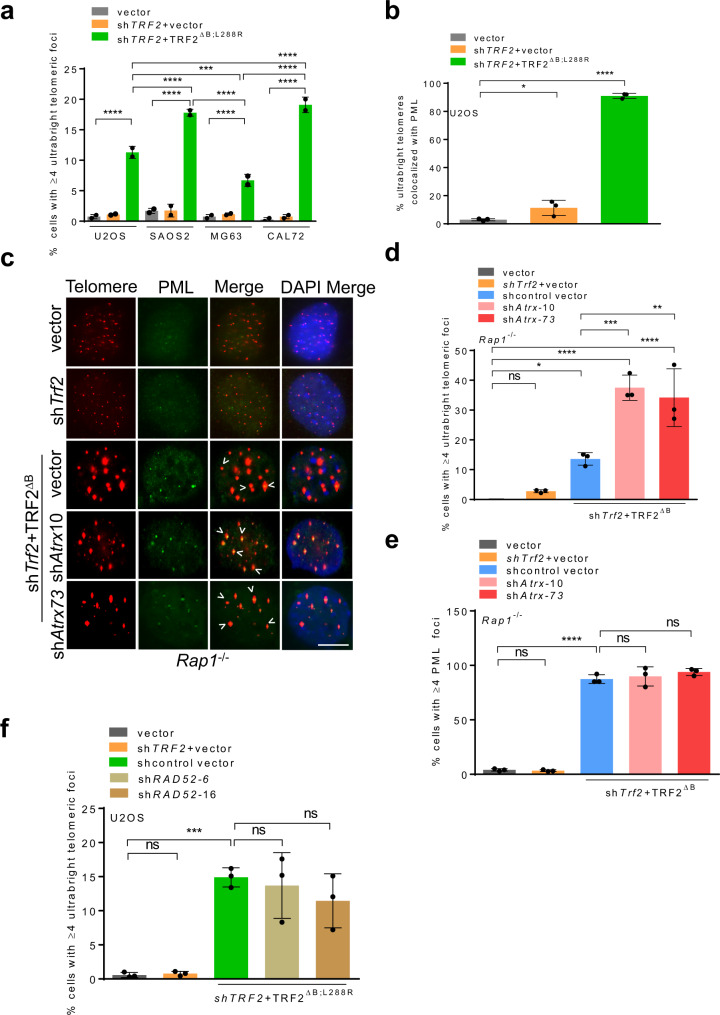
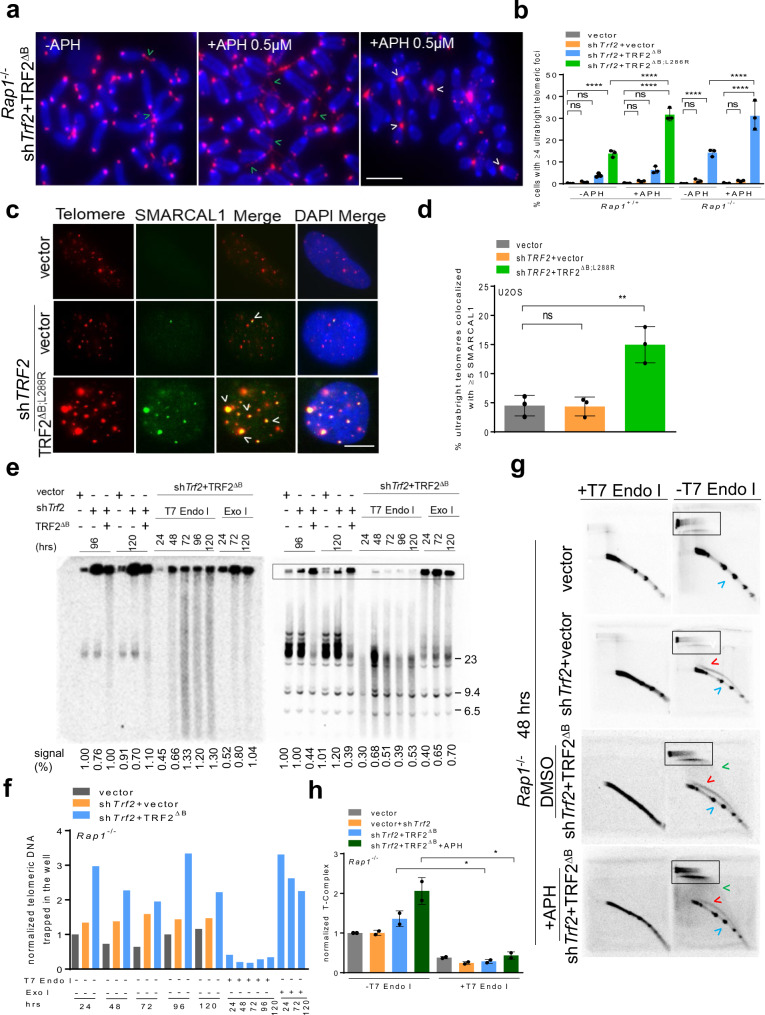
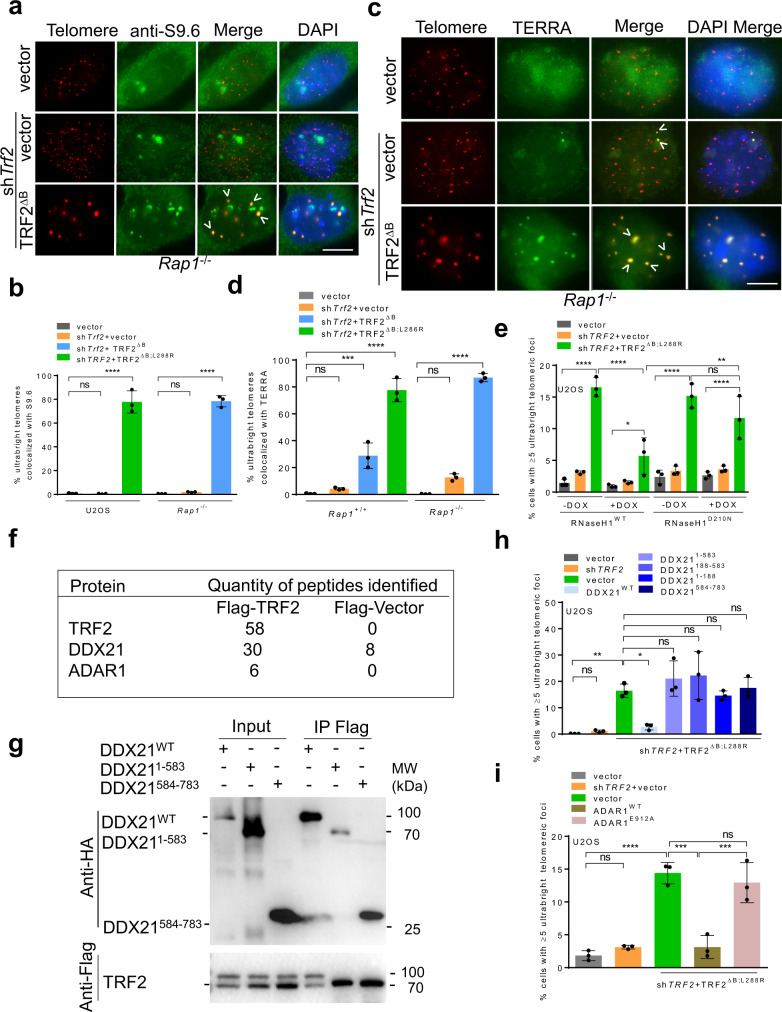
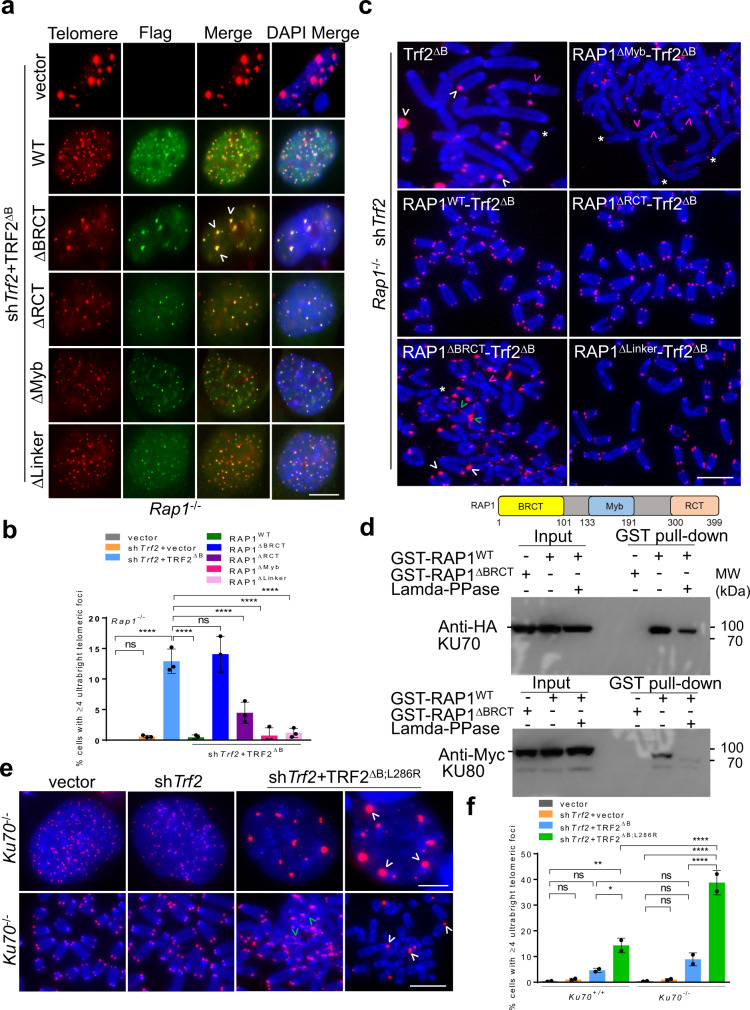
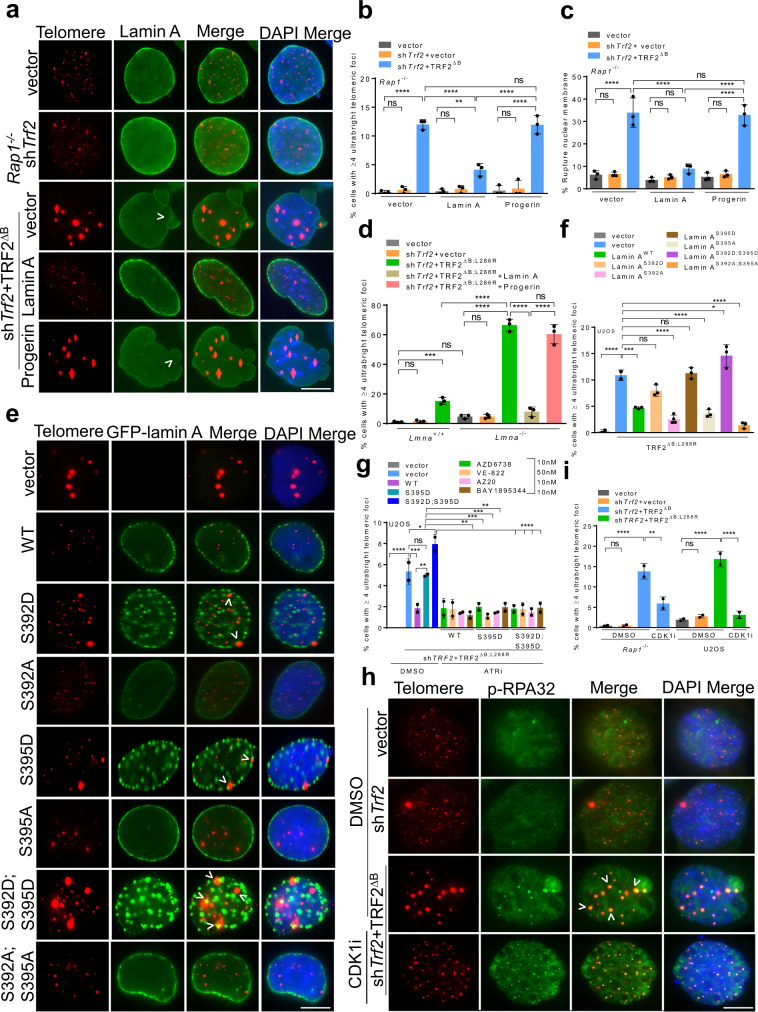
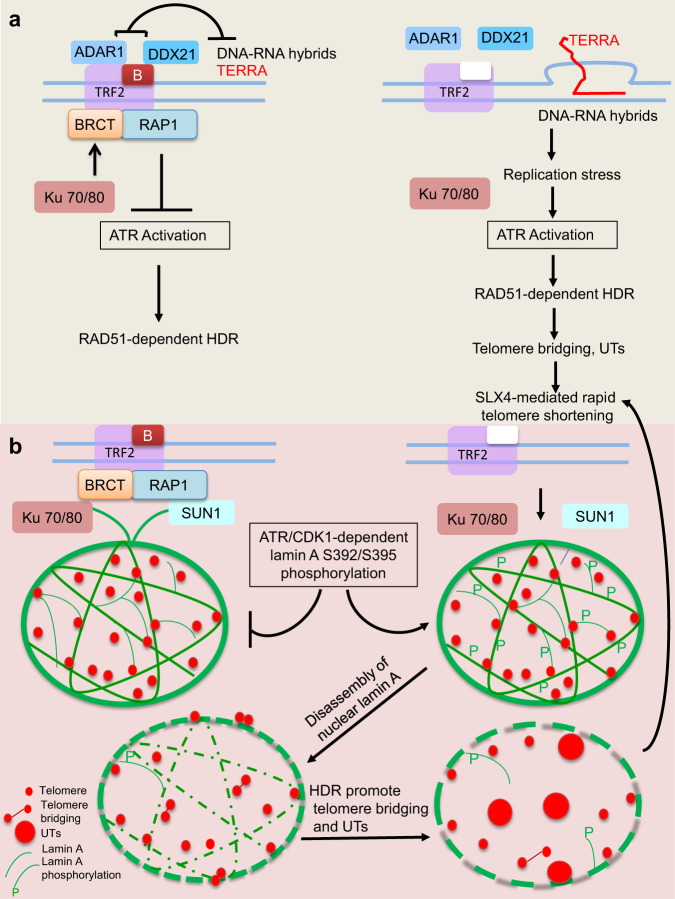
Double-strand breaks (DSBs) due to genotoxic stress represent potential threats to genome stability. Dysfunctional telomeres are recognized as DSBs and are repaired by distinct DNA repair mechanisms. RAP1 and TRF2 are telomere binding proteins essential to protect telomeres from engaging in homology directed repair (HDR), but how this occurs remains unclear. In this study, we examined how the basic domain of TRF2 (TRF2B) and RAP1 cooperate to repress HDR at telomeres. Telomeres lacking TRF2B and RAP1 cluster into structures termed ultrabright telomeres (UTs). HDR factors localize to UTs, and UT formation is abolished by RNaseH1, DDX21 and ADAR1p110, suggesting that they contain DNA-RNA hybrids. Interaction between the BRCT domain of RAP1 and KU70/KU80 is also required to repress UT formation. Expressing TRF2∆B in Rap1-/- cells resulted in aberrant lamin A localization in the nuclear envelope and dramatically increased UT formation. Expressing lamin A phosphomimetic mutants induced nuclear envelope rupturing and aberrant HDR-mediated UT formation. Our results highlight the importance of shelterin and proteins in the nuclear envelope in repressing aberrant telomere-telomere recombination to maintain telomere homeostasis.


Conflict of interest statement

The authors declare no competing interests.

Figures

Fig. 1
Fig. 1. TRF2B and RAP1 cooperate to repress ultrabright telomere formation.
a PNA- FISH of interphase nuclei showing time-dependent increase of CCCTAA-positive telomere filaments (green arrowheads) and UT foci (white arrowheads) in Rap1+/+ and Rap1–/– MEFs expressing the indicated DNAs. CCCTAA-positive filaments and telomeres detected with TelC-Cy3 (CCCTAA)3 PNA telomere probe (red) and DAPI to stain nuclei (blue). Inset: magnified view of CCCTAA-positive filaments and UTs. Scale bars: 5 µm. b Quantification of UTs in Rap1+/+ and Rap1–/– MEFs after 120 hrs. The mean of three independent experiments ± SD are shown, at least 200 nuclei analyzed per experiment. *P = 0.0458, ****P < 0.0001 by one-way ANOVA. ns: non-significant. c Quantification of UTs in Rap1–/– MEFs expressing TRF2ΔB at the indicated time points. The mean of three independent experiments ± SD are shown, at least 250 nuclei analyzed per experiment. *P = 0.0240, ***P = 0.0010, ****P < 0.0001 by one-way ANOVA. ns non-significant. d Representative images of UTs from two independent experiments shown to co-localized (white arrowheads) with indicated chromosomal specific sub-telomere probes (green) in U2OS cells expressing TRF2∆B;L288R. Scale bars: 5 µm. e Quantification of CCCTAA-positive filaments in Rap1–/– MEFs expressing TRF2ΔB at the indicated time points. The mean of three independent experiments ± SD are shown; at least 250 nuclei analyzed per experiment. **P = 0.0060, ***P = 0.0003, ****P < 0.0001 by one-way ANOVA. ns non-significant. f Representative PNA-FISH on metaphase spreads of Rap1–/– MEFs expressing TRF2ΔB from three independent experiments showing maximum formation of CCCTAA-positive telomere filaments (red) at 48 hrs (green arrowheads), UTs (white arrowheads), signal free ends (*), chromosomes fused with telomeres (orange arrowheads), chromosomes fused without telomeres (pink arrowheads). A minimum of 35 metaphase for each sample were examined per experiment. Scale bars: 15 µm. g The Fucci assay showing UTs formed primarily during the S-phase in U2OS cells. The mean of three independent experiments ±SD are shown, at least 150 nuclei analyzed per experiment. **P = 0.0015 by two-tailed unpaired t test. h Quantification of p-RPA32 and RAD51 localization on telomere bridges in Rap1–/– MEFs expressing indicated DNA constructs after 48 h. The mean of two independent experiments ± SD are shown, at least 200 nuclei analyzed per experiment. ****P < 0.0001 by one-way ANOVA. ns non-significant. i Quantification of UT frequencies in 53Bp1+/+ and 53Bp1–/– MEFs reconstituted with WT 53BP1 and the indicated 53BP1 mutants in the presence of shTrf2 + TRF2ΔB;L286R. The mean of two independent experiments ± SD are shown, at least 150 nuclei analyzed per experiment. ***P = 0.0010, ****P < 0.0001 by one-way ANOVA. Source data are provided as a Source Data file.
Fig. 2
Fig. 2. Recruitment of HDR factors promote the formation of ultrabright telomeres.
a Quantification of percent UTs co-localized with p-RPA32 (S33) in Rap1−/− MEFs expressing TRF2∆B. Data represents the mean of three independent experiments ± SD from a minimum 200 nuclei analyzed per experiment. ****P < 0.0001 by one-way ANOVA. ns non-significant. b Quantification of percent UTs co-localized with RAD51 in Rap1−/− MEFs expressing TRF2∆B. Data represents the mean of three independent experiments. At least 200 nuclei were examined per experiment. ****P < 0.0001 by one-way ANOVA. ns non-significant. c Quantification of UT frequencies in the absence of NBS1 and Ligase 3 that promote A-NHEJ. Data represents the mean values from two independent experiments ± SD from a minimum 200 nuclei analyzed per experiment. ***P = 0.0005, ****P < 0.0001 by one-way ANOVA. ns non-significant. d Quantification of the percentage of U2OS cells possessing UTs with or without treatment with SLX4 shRNA. Data represents the mean of three independent experiments ± SD from a minimum 200 nuclei analyzed per experiment. ****P < 0.0001 by one-way ANOVA. ns non-significant. e IF-FISH for HA-POLθ (green) co-localizing with telomeres (red) in U2OS cells expressing TRF2ΔB,L288R. Scale bars: 5 µm. f Quantification of UTs in U2OS cells expressing the indicated DNA constructs. Data represents the mean of three independent experiments ±SD from a minimum 150 nuclei analyzed per experiment. *P = 0.0295, **P = 0.0051, ****P < 0.0001 by one-way ANOVA. ns non-significant. g Quantification showing average telomere size per nucleus in U2OS, Rap1–/– and Rap1+/+ MEFs expressing indicated DNA constructs. Data represents the mean of three independent experiments ±SD from a minimum 100 nuclei analyzed per experiment. *P = 0.01, **P = 0.0064, ****P < 0.0001 by one-way ANOVA. ns non-significant. Source data are provided as a Source Data file.
Fig. 3
Fig. 3. TRF2B and RAP1 repress ALT associated proteins at telomeres.
a Quantification of UT frequencies in ATRX-positive and ATRX-null ALT cells expressing indicated DNA constructs. Data represents the mean of two independent experiments ±SD from a minimum 200 nuclei analyzed per experiment. ***P = 0.0009, ****P < 0.0001 by one-way ANOVA. b Quantification of percent UTs co-localized to PML bodies in U2OS expressing shTRF2 + TRF2ΔB;L288R. Data represents the mean of three independent experiments ±SD from a minimum 150 nuclei analyzed per experiment. *P = 0.0460, ****P < 0.0001 by one-way ANOVA. c Representative IF-FISH images showing the loss of ATRX promotes the formation of UTs colocalized with PML (green) in Rap1–/– MEFs expressing TRF2ΔB. Scale bars: 5 µm. d Quantification of cells containing ≥4 UTs with or without Atrx shRNAs in (c). Data represents the mean of three independent experiments ± SD from a minimum 250 nuclei analyzed per experiment. *P = 0.0407, **P = 0.0028, ***P = 0.0009, ***P < 0.0001 by one-way ANOVA. ns: non-significant. e Quantification of percent UTs co-localized to PML bodies in (c). Data represents the mean of three independent experiments ± SD from a minimum 250 nuclei analyzed per experiment. ****P < 0.0001 by one-way ANOVA. ns non-significant. f Quantification of cells containing ≥4 UTs with or without RAD52 shRNAs. The mean of three independent experiments ± SD shown from a minimum 200 nuclei analyzed per experiment. ***=0.0008 by one-way ANOVA. ns non-significant. Source data are provided as a Source Data file.
Fig. 4
Fig. 4. Replication defect is an early step in ultrabright telomere formation.
a PNA-FISH on metaphase spreads showing CCCTAA-positive filaments (green arrowheads) and UTs (white arrowheads) in Rap1–/– MEFs expressing TRF2ΔB with + / 0.5 µM aphidicolin (APH) treatment. Scale bars: 20 µm. A minimum of 30 metaphases for each sample were examined per experiment. b Quantification of UT frequencies in the interphase nuclei of Rap1+/+ and Rap1–/– MEFs expressing the indicated DNA constructs in (a). Mean of three independent experiments ± SD are shown from a minimum 250 nuclei analyzed per experiment. ****P < 0.0001 by one-way ANOVA. ns non-significant. c Representative IF-FISH images showing UTs co-localized to SMARCAL1 (green) in U2OS cells expressing shTRF2 + TRF2ΔB;L288R. Scale bars: 5 µm. d Quantification of percent UTs colocalized with SMARCAL1 in (c). Mean of three independent experiments ± SD from a minimum 300 nuclei analyzed per experiment. **P = 0.0032 by one-way ANOVA. ns non-significant. e In-gel single-strand G overhang (native, left panel) and total telomere (denatured, right panel) analysis in Rap1–/– MEFs expressing the indicated cDNA constructs at the indicated time point with ±T7 endonuclease I (T7 Endo I) and Exo I treatment. Single-strand G overhang and total telomere signals in vector was set at 100% after normalizing each lane with ethidium bromide staining that served as an internal loading control. The numbers below the gel represents single-strand G overhang and total telomere signals. Molecular weights are displayed on the right. f Quantification of normalized telomeric DNA trapped in the well (outlined by the box) at indicated time point in (e) from one representative experiment (see also Supplementary Fig. 4f). Signal intensities in vector was set at 100% after normalizing with sub telomeres signals that served as an internal loading control. g T-complex and T-circle analysis using two-dimensional (2D) gel electrophoresis from genomic DNA isolated from Rap1–/– MEFs expressing the indicated DNA constructs in ±0.5 µM APH treated with 40 units of T7 endonuclease I. T-complex (outlined by the box), t-circle (green arrowheads), ss G (red arrowheads), ds TRF (blue arrowheads). h Quantification of T-complex in (g). T-complex signal intensities in vector was set at 100% after normalizing with sub telomeres signals that served as an internal loading control. The graph represents the mean ± SD from two independent experiments. *P = 0.0175 by two tailed unpaired t test. Source data are provided as a Source Data file.
Fig. 5
Fig. 5. TRF2B and RAP1 cooperate to repress TERRA and R-loop formation in ultrabright telomeres.
a IF-FISH showing cells containing ≥4 UTs colocalized with S9.6 antibody (green) in Rap1–/– MEFs cells treated with shTrf2 + TRF2ΔB. Scale bars: 5 µm. b Quantification of percent UTs colocalized with S9.6 foci antibody in (a). Data represents the mean of three independent experiments ± SD from a minimum 300 nuclei analyzed per experiment. ****P < 0.0001 by one-way ANOVA. ns non-significant. c IF-FISH showing cells containing ≥4 UTs colocalized with TERRA (green) in Rap1–/– MEFs cells treated with shTrf2 + TRF2ΔB. Scale bars: 5 µm. d Quantification of percent UTs colocalized with TERRA in (c). Data represents the mean of three independent experiments ± SD from a minimum 350 nuclei analyzed per experiment. ***P = 0.0001, ****P < 0.0001 by one-way ANOVA. ns non-significant. e Quantification of UT frequencies after doxycycline induced RNaseH1WT or catalytically dead RNaseH1D210N mutant in U2OS cells expressing indicated constructs. Data represents the mean of three independent experiments ± SD from a minimum of 350 nuclei analyzed per experiment. *P = 0.0325, **P = 0.0035, ****P < 0.0001 by one-way ANOVA. ns: non-significant. f IP-MS data using Flag-TRF2 and Flag-vector as baits showing R-loop associated proteins coprecipitated with Flag-WT TRF2 but not in Flag-vector in one representative experiment. g Co-IP with Flag antibody with lysates from 293 T cells expressing indicated proteins showing the interaction between TRF2 and DDX21 mutant depends on the DDX21 C-terminus. The blot shown is the representative of two independent experiments. h Quantification of UT frequencies in U2OS cells expressing Flag-DDX21WT and the indicated DDX21 deletion mutants in the presence of shTRF2 + TRF2ΔB;L288R. Data represents the mean of three independent experiments ± SD from a minimum 300 nuclei analyzed per experiment. *P = 0.0254, **P = 0.0064 by one-way ANOVA. ns non-significant. i Quantification of UT frequency upon overexpression of GFP ADAR1p110 and catalytically inactive ADAR1p110E912A mutant in U2OS cells expressing indicated DNA constructs. Data represents the mean of three independent experiments ± SD from a minimum 350 nuclei analyzed per experiment. ***P = 0.0001, ****P < 0.0001 by one-way ANOVA. ns non-significant. Source data are provided as a Source Data file.
Fig. 6
Fig. 6. RAP1 BRCT domain and KU70/KU80 cooperate to repress ultrabright telomeres.
a IF-FISH showing Flag-tagged RAP1-TRF2ΔB fusion protein (green) localization at UTs in Rap1–/– MEFs expressing indicated constructs. Scale bars: 5 µm. b Quantification of UT frequencies in (a). Data shown as the mean of three independent experiments ± SD from a minimum 200 nuclei analyzed per experiment. ****P < 0.0001 by one-way ANOVA. ns non-significant. c Representative images from three independent experiments of PNA-FISH on metaphase spreads showing CCCTAA-positive filaments (green arrowheads) and UTs (white arrowheads), signal free ends (*), fused chromosome without telomere at the fusion site (pink arrowheads) in Rap1–/– MEFs expressing Flag-tagged RAP1-TRF2ΔB fusion proteins. At least 30 metaphases were analyzed per experiments. Scale bars: 15 µm. d Purified GST-RAP1WT and GST-RAP1∆BRCT were subjected to a pull-down assay with 293 T cell lysates overexpressing HA-KU70 and Myc-KU80 in the presence and absence of lambda -PPase (protein phosphatase). The blot shown is the representative of two independent experiments. e PNA-FISH on interphase nuclei and metaphases showing the formation of CCCTAA-positive filaments (green arrowheads) and UTs (white arrowheads) in Ku70–/– MEFs expressing indicated constructs. Scale bars: 5 µm. f Quantification of UT frequencies in (e). Data shown as the mean of two independent experiments ±SD from a minimum 350 nuclei analyzed per experiment. *P = 0.0277, **P = 0.0030, ****P < 0.0001 by one-way ANOVA. ns non-significant. Source data are provided as a Source Data file.
Fig. 7
Fig. 7. Defects in lamin A promote the formation of ultrabright telomeres.
a IF-FISH showing lamin A staining (green) in Rap1–/– MEFs expressing indicated constructs and upon expressing WT lamin A or Progerin. Scale bars: 5 µm. b Quantification of UT frequencies in (a). Data represents the mean of three independent experiments ± SD from a minimum 400 nuclei analyzed per experiment. **P = 0.0036, ****P < 0.0001 by one-way ANOVA. ns: non-significant. c Quantification of NE rupturing in cells expressing UTs in Rap1–/– MEFs expressing indicated constructs. Data represents the mean of three independent experiments ± SD from a minimum 400 nuclei analyzed per experiment. ****P < 0.0001 by one-way ANOVA. ns: non-significant. d Quantification of UT frequencies in Lmna+/+ and Lmna–/– MEFs treated with shTrf2 + TRF2ΔB;L286R. Data represents the mean of three independent experiments ± SD from a minimum 300 nuclei analyzed per experiment. ***P = 0.0008, ****P < 0.0001 by one-way ANOVA. ns non-significant. e IF-FISH showing the impact of CDK1 and ATR phospho- and dephospho-GFP-tagged Lamin mutants (green) in the generation of UTs in U2OS cells expressing TRF2∆B;L288R. Scale bars: 5 µm. f Quantification of UT frequencies in (e). Data represents the mean of three independent experiments ± SD from a minimum 350 nuclei analyzed per experiment. *P = 0.0246, ***P = 0.0001 ****P < 0.0001 by one-way ANOVA. ns non-significant. g Quantification of UT frequencies in U2OS cells expressing indicated constructs treated with ATR inhibitors (ATRi). Data represents the mean of two independent experiments ± SD from a minimum 300 nuclei analyzed per experiment. *P = 0.0204, **P = 0.0031, ***P = 0.001, ****P < 0.0001 by one-way ANOVA. ns non-significant. h Representative IF-FISH showing that 4.0 µM Ro-3306 CDK1 specific inhibitor (CDKi) reduced the formation of UTs but not p-RPA32(S33) (green) TIFs in Rap1−/− MEFs expressing indicated proteins. i Quantification of UTs in Rap1–/– MEFs and U2OS cells in the absence and presence of CDK1 inhibitor. Data represents the mean of two independent experiments ± SD from a minimum 300 nuclei analyzed per experiment. **P = 0.0023, ****P < 0.0001 by one-way ANOVA. ns non-significant. Scale bars: 5 µm. Source data are provided as a Source Data file.
Fig. 8
Fig. 8. Speculative schematic diagram illustrating the formation of ultrabright telomeres in the absence of RAP1 and TRF2B.
a In WT cells, TRF2B and RAP1 cooperate to protect chromosome ends from inappropriate activation of ATR-dependent HDR. TRF2B recruits DDX21 and ADAR1p110 to telomeres to resolve DNA-RNA hybrids, preventing the formation of telomeric R-loops, TERRA and UTs. In the absence of RAP1 and TRF2B, stalled replication forks lead to activation of ATR-CHK1, accumulation of telomeric R-loops and TERRA, promoting UT formation. Unresolved telomere recombination intermediates become substrates for cleavage by the SLX4 endonuclease, leading to catastrophic telomere shortening via T-loop HDR and the formation of telomere-free chromosome fusions. b Lamin A acts as a scaffold that restrains telomere movement in the nucleus, possibly through transient associations of RAP1 with KU70/KU80 and SUN1, known NE binding proteins. In the absence of RAP1 and TRF2B, ATR-CHK1 and CDK1 dependent phosphorylation of lamin A results in the disassembly of nuclear lamin A. Decompartmentalization of telomeres due to disruption of the lamin A architecture facilitates HDR, telomere-telomere clustering and UT formation.

References

    1. Chakravarti D, LaBella KA, DePinho RA. Telomeres: history, health, and hallmarks of aging. Cell. 2021;184:306–322. doi: 10.1016/j.cell.2020.12.028. - DOI - PMC - PubMed
    1. Luderus ME, et al. Structure, subnuclear distribution, and nuclear matrix association of the mammalian telomeric complex. J. Cell Biol. 1996;135:867–881. doi: 10.1083/jcb.135.4.867. - DOI - PMC - PubMed
    1. Crabbe L, Cesare AJ, Kasuboski JM, Fitzpatrick JA, Karlseder J. Human telomeres are tethered to the nuclear envelope during postmitotic nuclear assembly. Cell Rep. 2012;2:1521–1529. doi: 10.1016/j.celrep.2012.11.019. - DOI - PMC - PubMed
    1. de Lange T. Shelterin-mediated telomere protection. Annu Rev. Genet. 2018;52:223–247. doi: 10.1146/annurev-genet-032918-021921. - DOI - PubMed
    1. Attwooll CL, Akpinar M, Petrini JH. The mre11 complex and the response to dysfunctional telomeres. Mol. Cell Biol. 2009;29:5540–5551. doi: 10.1128/MCB.00479-09. - DOI - PMC - PubMed

Publication types

MeSH terms

Substances