. 2023 Apr 14;13(1):5734.
doi: 10.1038/s41598-023-32141-2.

Fluid-structure interaction modelling of a positive-displacement Total Artificial Heart

Affiliations

Fluid-structure interaction modelling of a positive-displacement Total Artificial Heart

Joseph Bornoff et al. Sci Rep. .

Abstract

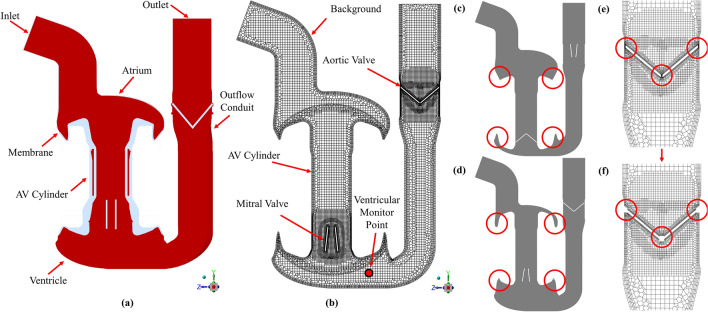
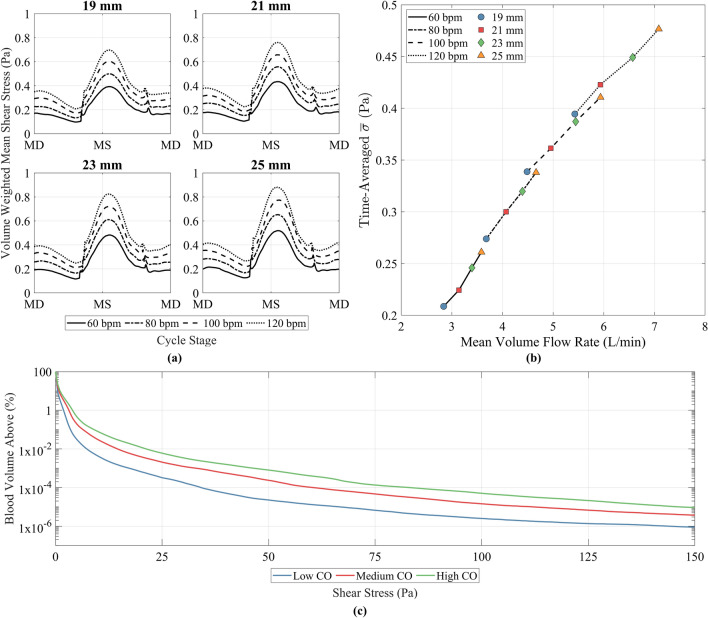
For those suffering from end-stage biventricular heart failure, and where a heart transplantation is not a viable option, a Total Artificial Heart (TAH) can be used as a bridge to transplant device. The Realheart TAH is a four-chamber artificial heart that uses a positive-displacement pumping technique mimicking the native heart to produce pulsatile flow governed by a pair of bileaflet mechanical heart valves. The aim of this work was to create a method for simulating haemodynamics in positive-displacement blood pumps, using computational fluid dynamics with fluid-structure interaction to eliminate the need for pre-existing in vitro valve motion data, and then use it to investigate the performance of the Realheart TAH across a range of operating conditions. The device was simulated in Ansys Fluent for five cycles at pumping rates of 60, 80, 100 and 120 bpm and at stroke lengths of 19, 21, 23 and 25 mm. The moving components of the device were discretised using an overset meshing approach, a novel blended weak-strong coupling algorithm was used between fluid and structural solvers, and a custom variable time stepping scheme was used to maximise computational efficiency and accuracy. A two-element Windkessel model approximated a physiological pressure response at the outlet. The transient outflow volume flow rate and pressure results were compared against in vitro experiments using a hybrid cardiovascular simulator and showed good agreement, with maximum root mean square errors of 15% and 5% for the flow rates and pressures respectively. Ventricular washout was simulated and showed an increase as cardiac output increased, with a maximum value of 89% after four cycles at 120 bpm 25 mm. Shear stress distribution over time was also measured, showing that no more than [Formula: see text]% of the total volume exceeded 150 Pa at a cardiac output of 7 L/min. This study showed this model to be both accurate and robust across a wide range of operating points, and will enable fast and effective future studies to be undertaken on current and future generations of the Realheart TAH.


Conflict of interest statement

A.N., T.F. and I.L.P. are employees of or consultants to and/or shareholders of Scandinavian Real Heart AB. J.B., L.F., H.G., A.N.C. and K.H.F. declare no potential conflicts of interest.

Figures

Figure 1
Figure 1
Computational domain and mesh of the Realheart TAH CFD model, showing (a) schematic of the TAH, with locations of the inlet and outlet, outflow conduit, atrial and ventricle regions alongside connective membrane linking the translating AV cylinder to these regions. (b) The internal mesh and the locations of the six overset component zones: background, AV cylinder, two mitral leaflets and two aortic leaflets. (c) Shape of the overlap between AV cylinder and atria and ventricle (circled in red) at end systole and (d) end diastole. (e) Locations of the small peripheral gaps (circled in red) that become excluded due to the gap model at (f) initialisation.
Figure 2
Figure 2
Mesh study results for the coarse, medium and fine meshes, showing (a) transient outlet volume flow rate, (b) transient leaflet angle for the left mitral and left aortic valve leaflet and (c) area-averaged transient wall shear stress for the left mitral and left aortic valve leaflets.
Figure 3
Figure 3
(a) Velocity flow field and (b) pressure contour plots at mid systole, end systole, mid diastole and end diastole at an operating point of 100 bpm 21 mm, equating to 5 L/min. Black arrows at mid systole and mid diastole denote direction of the AV plane. (c) Transient outlet volume flow rate and outlet pressure. Grey regions of plot denote diastole whilst white regions are systole.
Figure 4
Figure 4
Comparison between simulated and experimental data from hybrid cardiovascular simulator of (a) outlet pressure and aortic pressure and (b) outlet volume flow rate and outflow volume flow rate showing good qualitative agreement between the sets of data. (c) Mean outlet volume flow rate against heart rate for a change in stroke length. (d) Outlet pulse pressure against stroke length with a change in heart rate.
Figure 5
Figure 5
(a) Transient comparison of the aortic and mitral valve angles between simulated and in vitro data. The simulated left valve angle was used in both cases. Solid blue lines represent fully open and fully closed. Dashed blue lines represent the transition between the two states and not actual valve motion characteristics. (b) Image comparison between the in vitro video capture and simulated mitral valve position. Numbered points correspond to points on (a), where point 1 is mitral valve fully open, point 2 is during closing of the mitral valve and point 3 is during opening of mitral valve. Mitral valve leaflets are shown in dark grey, whilst light grey is rest of pump housing. (c) Comparison of the left and right mitral valve leaflets for the lowest CO (60 bpm 19 mm) equating to 3 L/min, and the highest CO (120 bpm 25 mm) equating to 7 L/min, where 0 is fully closed and 44 is fully open.
Figure 6
Figure 6
(a) Washout contour plots for low (60 bpm 19 mm), medium (100 bpm 21 mm) and high (120 bpm 25 mm) CO, equating to 3, 5 and 7 L/min. (b) Rate of ventricular washout against mean volume flow rate for the 16 simulated operating points.
Figure 7
Figure 7
(a) Volume-weighted mean scalar shear stress (σ¯) against time for the different conditions simulated. MD refers to mid diastole whilst MS refers to mid systole. (b) Time-averaged σ¯ against mean volume flow rate for each of the conditions simulated. (c) Average percentage volume of blood exposed to a given shear stress over the course of one cycle. Low CO was 60 bpm 19 mm (3 L/min), medium CO was 100 bpm 21 mm (5 L/min) and high CO was 120 bpm 25 mm (7 L/min).
Figure 8
Figure 8
(a) Volume of fluid that exceeds the threshold scalar shear stress value of 17.5 Pa at systolic and diastolic peak scalar shear stress time points and (b) wall shear stress distribution of aortic valve at systolic peak scalar shear stress, and mitral valve at diastolic peak scalar shear stress time points for low (60 bpm 19 mm), medium (100 bpm 21 mm) and high (120 bpm 25 mm) CO, equating to 3, 5 and 7 L/min.

References

    1. Bragazzi NL, et al. Burden of heart failure and underlying causes in 195 countries and territories from 1990 to 2017. Eur. J. Prev. Cardiol. 2021;28:1682–1690. doi: 10.1093/eurjpc/zwaa147. - DOI - PubMed
    1. Severino P, et al. Advanced heart failure and end-stage heart failure: Does a difference exist. Diagnostics (Basel) 2019;9:170. doi: 10.3390/diagnostics9040170. - DOI - PMC - PubMed
    1. NHSBT. Organ and tissue donation and transplantation—activity report 2021/22 (2022).
    1. Cook JA, et al. The total artificial heart. J. Thorac. Dis. 2015;7:2172–2180. doi: 10.3978/j.issn.2072-1439.2015.10.70. - DOI - PMC - PubMed
    1. Strueber MMD, et al. Multicenter evaluation of an intrapericardial left ventricular assist system. J. Am. Coll. Cardiol. 2011;57:1375–1382. doi: 10.1016/j.jacc.2010.10.040. - DOI - PubMed

Publication types