. 2023 Apr 14;9(1):61.
doi: 10.1038/s41531-023-00495-z.

Aberrant neurophysiological signaling associated with speech impairments in Parkinson's disease

Collaborators, Affiliations

Aberrant neurophysiological signaling associated with speech impairments in Parkinson's disease

Alex I Wiesman et al. NPJ Parkinsons Dis. .

Abstract

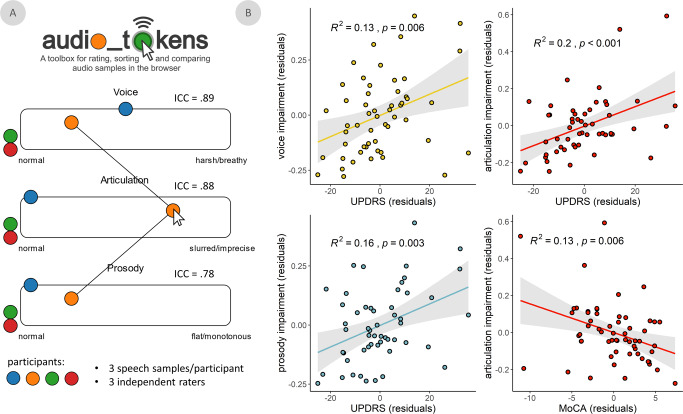
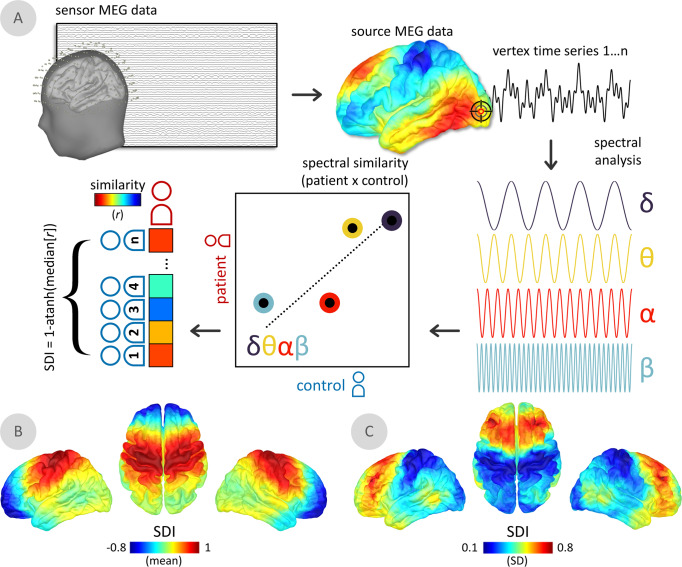
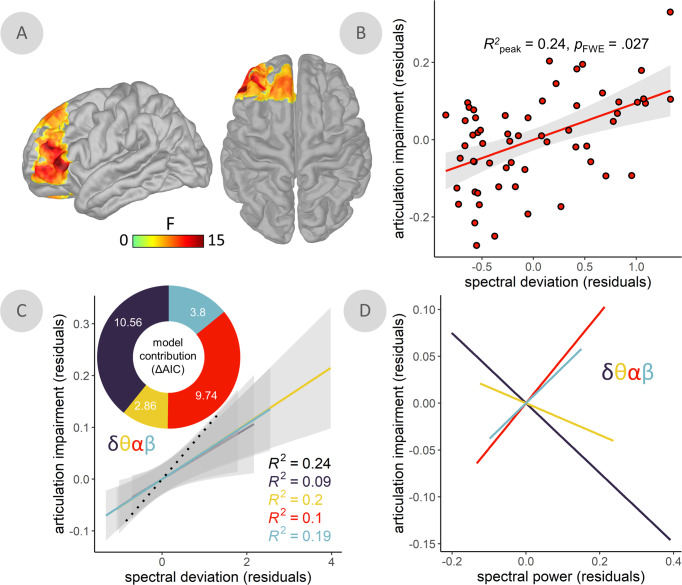
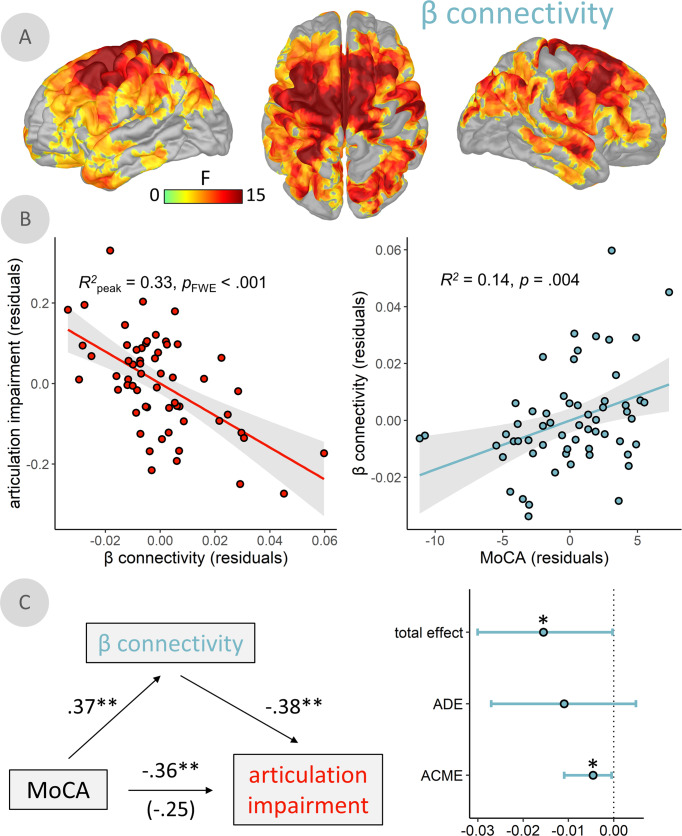
Difficulty producing intelligible speech is a debilitating symptom of Parkinson's disease (PD). Yet, both the robust evaluation of speech impairments and the identification of the affected brain systems are challenging. Using task-free magnetoencephalography, we examine the spectral and spatial definitions of the functional neuropathology underlying reduced speech quality in patients with PD using a new approach to characterize speech impairments and a novel brain-imaging marker. We found that the interactive scoring of speech impairments in PD (N = 59) is reliable across non-expert raters, and better related to the hallmark motor and cognitive impairments of PD than automatically-extracted acoustical features. By relating these speech impairment ratings to neurophysiological deviations from healthy adults (N = 65), we show that articulation impairments in patients with PD are associated with aberrant activity in the left inferior frontal cortex, and that functional connectivity of this region with somatomotor cortices mediates the influence of cognitive decline on speech deficits.


Conflict of interest statement

The authors declare no competing interests.

Figures

Fig. 1
Fig. 1. Speech impairment ratings are reliable and associated with clinical features of PD.
A Graphical user interface for the manual rating of speech feature impairments using audio_tokens. When hovered-over with the mouse, colored circles play speech samples from separate patients with Parkinson’s disease (each represented by a different color), allowing for interactive and comparative rating (i.e., by clicking and sliding the circles horizontally) of impairments in each speech feature. Intraclass correlation coefficients (ICC) indicate reliability of speech ratings across three independent raters. B Significant linear relationships between voice, articulation, and prosody impairments and two common clinical scales in Parkinson’s disease: the Unified Parkinson’s Disease Rating Scale part III (i.e., UPDRS-III, minus speech sub-scores) and the Montreal Cognitive Assessment (MoCA). All models controlled for age. Shaded intervals represent the 95% confidence interval.
Fig. 2
Fig. 2. The spectral deviation index (SDI).
A For all participants, magnetoencephalography (MEG) data were cortically mapped, frequency-transformed, and averaged over canonical frequency bands (i.e., δ/delta: 2–4 Hz; θ/theta: 4–7 Hz; α/alpha: 8–12 Hz; β/beta: 15–29 Hz). Pearson correlation coefficients were then estimated at each vertex, representing the similarity across frequency-wise power estimates between each patient and control. For each patient, the median of these values was taken over all comparisons to control participants, which was then Fisher-transformed to ensure linear scaling (i.e., transformed with the inverse hyperbolic tangent function) and subtracted from 1 to indicate relative deviations from the control group. Surface maps below indicate the mean (B) and standard deviation (C) of the spectral deviation maps across all patients with Parkinson’s disease.
Fig. 3
Fig. 3. Spectral deviation relates to articulatory impairments in the left inferior frontal cortex.
A Surface maps indicate a significant relationship between spectral deviations and articulation impairments in patients with Parkinson’s disease (PD), with spectral deviations (SDI) and articulation impairment ratings from the peak vertex of this relationship plotted in (B). C Model contribution values shown in the donut plot indicate comparisons between models predicting articulation impairment ratings using the SDI values from the same peak vertex and comparable SDI values computed with each frequency left-out once. More positive differences in Akaike information criterion (ΔAIC) indicate a stronger contribution of that frequency to the overall model, with ΔAIC > 2 signifying meaningful differences in model information. Best fit lines represent the linear relationships between these leave-one-out models for each frequency and the articulation impairment ratings across patients with PD (dotted black line = full-frequency, broad-band model). D Lines-of-best-fit indicate the direction of the underlying relationships between spectral power at each frequency and articulation impairment ratings. All models controlled for age. Shaded intervals represent the 95% confidence interval.
Fig. 4
Fig. 4. β-frequency functional connectivity between left inferior frontal cortex and somatomotor regions mediates the impact of cognitive decline on articulation impairments.
A Surface maps indicate a significant relationship between articulation impairment ratings and frequency-resolved functional connectivity, computed using orthogonalized amplitude envelope correlations (AEC) with the peak vertex of the relationship from Fig. 3 as the seed. B β-connectivity and articulation impairments from the peak vertex of this relationship are plotted on the left, and the relationship between the same β-connectivity values and cognitive function (i.e., Montreal Cognitive Assessment [MoCA] scores) are plotted on the right. C Paths between MoCA scores, articulation impairment ratings, and β-connectivity values to the left indicate partial correlations (r) between each set of variables. The correlation value in parentheses represents the mediated relationship between MoCA scores and articulation impairment ratings when accounting for β-connectivity. The total effect, average direct effect (ADE), and average causal mediation effect (ACME; i.e., indirect effect) are plotted with 95% confidence intervals to the right. All models controlled for age. Shaded intervals represent the 95% confidence interval. **p < 0.01, *p < 0.05.

References

    1. Feigin VL, et al. Global, regional, and national burden of neurological disorders, 1990–2016: a systematic analysis for the Global Burden of Disease Study 2016. Lancet Neurol. 2019;18:459–480. doi: 10.1016/S1474-4422(18)30499-X. - DOI - PMC - PubMed
    1. Polychronis S, Niccolini F, Pagano G, Yousaf T, Politis M. Speech difficulties in early de novo patients with Parkinson’s disease. Parkinsonism Relat. Disord. 2019;64:256–261. doi: 10.1016/j.parkreldis.2019.04.026. - DOI - PubMed
    1. Becker G, et al. Early diagnosis of Parkinson’s disease. J. Neurol. 2002;249:iii40–iii48. doi: 10.1007/s00415-002-1309-9. - DOI - PubMed
    1. Rusz J, Cmejla R, Ruzickova H, Ruzicka E. Quantitative acoustic measurements for characterization of speech and voice disorders in early untreated Parkinson’s disease. J Acoustical Soc. Am. 2011;129:350–367. doi: 10.1121/1.3514381. - DOI - PubMed
    1. Ramig LO, Fox C, Sapir S. Speech treatment for Parkinson’s disease. Exp. Rev. Neurother. 2008;8:297–309. doi: 10.1586/14737175.8.2.297. - DOI - PubMed