. 2023 Apr 14;14(1):2154.
doi: 10.1038/s41467-023-37885-z.

Legionella para-effectors target chromatin and promote bacterial replication

Affiliations

Legionella para-effectors target chromatin and promote bacterial replication

Daniel Schator et al. Nat Commun. .

Abstract

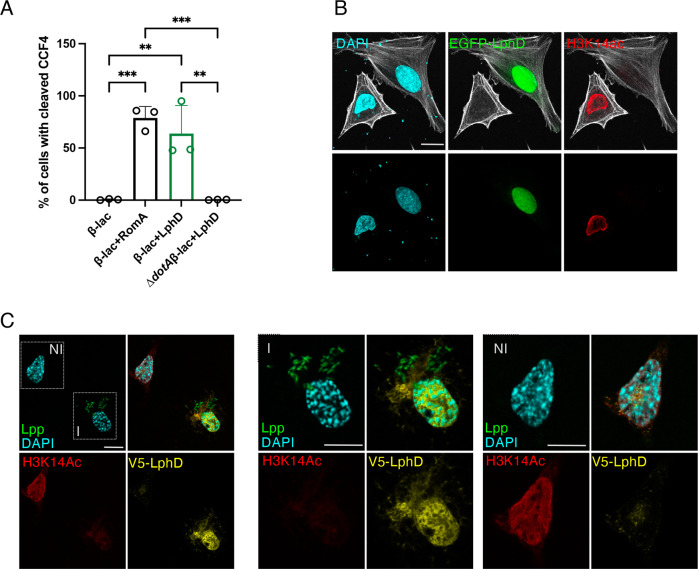
Legionella pneumophila replicates intracellularly by secreting effectors via a type IV secretion system. One of these effectors is a eukaryotic methyltransferase (RomA) that methylates K14 of histone H3 (H3K14me3) to counteract host immune responses. However, it is not known how L. pneumophila infection catalyses H3K14 methylation as this residue is usually acetylated. Here we show that L. pneumophila secretes a eukaryotic-like histone deacetylase (LphD) that specifically targets H3K14ac and works in synergy with RomA. Both effectors target host chromatin and bind the HBO1 histone acetyltransferase complex that acetylates H3K14. Full activity of RomA is dependent on the presence of LphD as H3K14 methylation levels are significantly decreased in a ∆lphD mutant. The dependency of these two chromatin-modifying effectors on each other is further substantiated by mutational and virulence assays revealing that the presence of only one of these two effectors impairs intracellular replication, while a double knockout (∆lphD∆romA) can restore intracellular replication. Uniquely, we present evidence for "para-effectors", an effector pair, that actively and coordinately modify host histones to hijack the host response. The identification of epigenetic marks modulated by pathogens has the potential to lead to the development of innovative therapeutic strategies to counteract bacterial infection and strengthening host defences.


Conflict of interest statement

The authors declare no competing interests.

Figures

Fig. 1
Fig. 1. LphD has predicted structural similarity to eukaryotic HDACs and possesses deacetylase activity.
A LphD model generated by AlphaFold v2.0.1. Insert: per-residue confidence score (pLDDT) produced by AlphaFold. B The conservation score between LphD and representative eukaryotic HDAC families mapped onto the LphD model. Insert: substrate binding groove with the catalytic residues (binding pocket residues and catalytic center) of LphD highlighted, colored according to conservation and HDAC6 colored green (PDB 5EDU). The catalytic zinc is shown from the HDAC6 structure. C Fluor de Lys® HDAC activity assay of LphD. Lysine deacetylase activity in vitro of increasing amounts of His-LphD and its catalytic inactive mutant (His-LphD Y392F). Control: 5 µM of Trichostatin A (TSA) (HDAC inhibitor). Data are presented as mean values ± SD of n = 3 independent experiments. For statistical analyses a two-way ANOVA was performed using Tukey’s multiple comparisons test (*p = 0.0486, **p = 0.027, ***p = 0.002, ****p < 0.001). D LphD-H3 peptide complex generated by AlphaFold v2.0.1. The H3 peptide is represented as a surface/cartoon model, K14, A15, and P16 residues are shown as sticks. E H3K14 (in green) is positioned towards the active site and the active site cavity (in blue) shows space to accommodate an acetylated K14 residue (red arrow). Insert: Residues 12 to 16 of the H3 peptide are represented as ball and stick, the entrance of the active site of LphD as surface. F Steady-state kinetics of purified LphD on fluorescent H3 peptide substrates acetylated at different lysine residues (H3K4ac, H3K9ac, H3K14ac, H3K18ac, H3K23ac, H3K27ac). Vi values (µM.min−1) plotted against substrate peptide concentrations and curves fitted using Michaelis–Menten equation. Data are presented as mean values ± SD of n = 3 independent experiments. G Densiometry quantification of LphD and LphD Y392F activity on H3K14ac levels on nucleosomes. Time [minutes]: reaction stop. H3K14ac signal was quantified after immunoblot detection and normalized to 0 min. Data are presented as mean values ± SD of n = 3 independent experiments. Statistical analysis performed using paired t-test (**p = 0.005139). All source data of this Figure are provided as source file.
Fig. 2
Fig. 2. LphD is a secreted effector that targets H3K14 in the nucleus.
A ß-lactamase secretion assays. Percentage of cells with cleaved CCF4 calculated as a ratio of secretion-positive (blue) over total stained cells (green and blue) after 2 hours of infection with L. pneumophila (Lp) wild-type (wt), or ∆dotA overexpressing either ß-lactamase (ß-lac), ß-lac fused to LphD (ß-lac+LphD) or to RomA (ß-lac+RomA). Data are presented as mean values ± SD of n = 3 independent experiments. For statistical analyses an ordinary one-way ANOVA was performed using Tukey’s multiple comparisons test (**p = 0.0032; ***p = 0.0008). B Immunofluorescence analysis of EGFP-LphD and H3K14 acetylation. HeLa cells were transfected with EGFP-LphD for 24 hours and stained for H3K14ac. DAPI (cyan), EGFP-LphD (green), H3K14ac (red), phalloidin (gray). Single-channel images are shown. Scale bars 10 µm. C Immunofluorescence analysis of LphD during infection. Differentiated THP-1 cells were infected 16 hours (MOI = 50) with Lp wt expressing V5-LphD and GFP. DAPI (cyan), V5-LphD (yellow), Lp (green), and H3K14ac (red). In the first panel uninfected (NI) and infected (I) cells are framed and zoomed in panels NI and I, respectively. Scale bars 10 µm. All source data of this Figure are provided as source file.
Fig. 3
Fig. 3. LphD and RomA target H3K14 synergistically.
Western blot quantification of H3K14 (A), H3K18 or H3K23 acetylation (B). THP-1 cells infected with L. pneumophila (Lp) wild-type (wt) (green) or ∆lphD (white) expressing EGFP. Infected cells were enriched by FACS sorting (EGFP signal). Histones were isolated by acidic extraction and analysed by western blot. Loading control: Histone H1, signal is fold-change normalized to non-infected cells. Data are presented as mean values ± SD of n = 3 independent experiments. For A statistical analyses a two-way ANOVA was performed using Šidák’s multiple comparisons test (*p = 0.0317, **p = 0.0054). C Western blot quantification of H3K14 methylation. THP- 1 cells were infected with Lp wt (green), ∆lphD (white) expressing EGFP. Infected cells were enriched by FACS sorting (EGFP signal). Histones were isolated by acidic extraction and analysed by western blot. Loading control: Histone H1, signal is fold-change normalized to non-infected cells. Data are presented as mean values ± SD of n = 3 independent experiments. For statistical analyses a two-way ANOVA was performed using Šidák’s multiple comparisons test (*p = 0.0136, **p = 0.0010, ****p < 0.0001). D ChIP of H3K14me during Lp infection followed by qPCR targeting selected promoters. THP-1 cells were uninfected (orange) or infected 7 hours with Lp wt (green) or ∆lphD (white) expressing EGFP. Infected cells were enriched by FACS (EGFP signal). Signal was normalized to histone H3. Data are presented as mean values ± SD of n = 3 independent experiments. For statistical analyses a two-way ANOVA was performed using Tukey’s multiple comparisons test with *p as indicated. E ChIP of LphD during Lp infection followed by qPCR targeting selected promoters. THP-1 cells were uninfected (orange) or infected with Lp wt (green) or ∆lphD (white) expressing EGFP. Infected cells were enriched by FACS (EGFP signal). Signal was normalized to histone H3. Data are presented as mean values ± SD of n = 4 independent experiments. All source data in this Figure are provided as source file.
Fig. 4
Fig. 4. LphD and RomA act as para-effectors during intracellular replication.
L. pneumophila (Lp) intracellular replication (log10 ratio cfu/ml/t2) in THP-1(MOI = 10 in A, C, D, F) or A. castellanii (MOI = 0.1 in B, E). A Lp wt (green), ΔlphD (black). Data are presented as mean values ± SD of n = 3 independent experiments. For statistical analyses a two-way ANOVA was performed using Šidák’s multiple comparisons test (*p = 0.0189). Non-linear regression analysis using a straight-line model showed a significant slope difference (p = 0.0291; F = 5.907). B Lp wt (green) and ΔlphD mutant (black). Data are presented as mean values ± SD of n = 4 independent experiments (except t24h and 48 h n = 2 independent experiments). For statistical analyses a two-way ANOVA was performed using Šidák’s multiple comparisons test (***p < 0.001). Non-linear regression analysis using a logistic growth model showed a significant difference in the curves (p < 0.001; F = 12.22). C Complementation analysis of Lp wt (green) and ΔlphD (black) with empty pBC-KS, ΔlphD with pBC-KS-lphD (orange). Data are presented as mean values ± SD of n = 4 independent experiments. For statistical analyses a two-way ANOVA was performed using Tukey’s multiple comparisons (**p = 0.001; ***p < 0.001). D Lp wt (green), ΔlphDromA (orange), ∆lphD (black), and ∆romA (blue). Data are presented as mean values ± SD of n = 4 independent experiments. For statistical analyses a two-way ANOVA was performed using Tukey’s multiple comparisons test (*p = 0.0189). E Lp wt (green), ∆lphDromA (orange), ΔlphD (black), ∆romA (blue). Data are presented as mean values ± SD of n = 3 independent experiments. For statistical analyses a two-way ANOVA was performed using Tukey’s multiple comparisons (*p = 0.026). F Complementation analysis of Lp wt (green) and ΔlphDromA (orange) with empty pBC-KS, pBC-KS-lphD (blue), and pBC-KS-romA (black); or pBC-KS-lphD-Y392F (blue, boxed) and pBC-KS-romA-Y249F/R207G/N210A (black boxed). Data are presented as mean values ± SD of n = 4 independent experiments (complemented n = 3, complemented inactive n = 2 independent experiments). For statistical analyses a two-way ANOVA was performed using Tukey’s multiple comparisons test with p as indicated. All source data of this Figure are provided as source file.
Fig. 5
Fig. 5. LphD and RomA interact and target chromatin.
A In vitro protein interaction assay using purified GST-RomA and His-LphD. Purified proteins were mixed in equal amounts followed by a GST-pulldown using Glutathione-beads. HIS6-LegK1 was used as negative binding control. Representative of n = 3 independent experiments. Source data provided as source file. B Immunoblots showing the interaction of LphD and RomA with histone H3. GFP-trap in HEK293T cells transfected with EGFP, EGFP-LphD, EGFP-LphD-Y392F, or EGFP-RomA. Pulldown samples were analyzed for the presence of H3. Input shows the expression level of endogenous histone H3 total lysate (IP control Figure S5B). Representative of n = 3 independent experiments. C Volcano plot of EGFP-LphD interacting proteins. The log2 fold change of EGFP-LphD to control (GFP) is plotted against the −log10 of the false discovery rate (FDR). Red: KAT7 selected for further analyses. Threshold: log2 fold change >2 and FDR < 0.1 red lines. D Schema of the HBO1 histone acetyltransferase complex with BRPF1-3 targeting H3K14. E Immunoblots of LphD, KAT7, and histone H3 interaction. GFP-trap in HEK293T cells transfected with EGFP, EGFP-LphD, EGFP-LphD-Y392F. Input shows the expression level of endogenous KAT7 and Histone H3 in total lysates (IP control Figure S5D). Representative of n = 3 independent experiments. All source data of this Figure are provided as source file.
Fig. 6
Fig. 6. LphD and RomA target chromatin via the HBO1/KAT7 complex.
A Immunoblots showing the interaction of LphD and RomA with the HBO1 complex and histone H3. GFP-trap in HEK293T cells transfected with EGFP, EGFP-LphD, or EGFP-RomA. Samples were analyzed for the presence of the different components of the HBO1 complex (BRPF1, KAT7, MEAF6, ING5). Input shows the expression level of endogenous HBO1 components and histone H3 in total lysates. For IP control see Figure S5F. Representative of n = 3 independent experiments. B Immunoblots showing the interaction of LphD and RomA with KAT7. GFP-trap in HEK293-FcγRII cells transfected with either EGFP or EGFP-KAT7 followed by infection with L. pneumophila (Lp) wild-type (wt) over-expressing either V5-LphD or V5-RomA. EGFP proteins were pulled down using GFP-trap beads and samples were analyzed for the presence of V5-LphD or V5-RomA. Input shows the expression level in total lysates of transfected EGFP-KAT7, V5-fusion proteins, as well as ß-actin (loading control). Representative of n = 3 independent experiments. C  In vitro protein interaction assay using purified FLAG-KAT7,  His-LphD, and GST-RomA. Purified proteins were mixed in equal amounts followed by a FLAG-pulldown using FLAG-trap beads. His-MBP and GST-MYL1 were used as negative binding controls. Representative of n = 3 independent experiments. D Quantification of western blot signal for H3K14 methylation in WM-3835 (KAT7-specific inhibitor) treated cells. THP-1 cells were treated with WM-3835 (1 µM) 18 hours prior to infection with Lp wt (green) or ∆lphD (white) expressing EGFP. Cells were sorted at different times post-infection by FACS (EGFP signal), histones were isolated and analysed by western blot. Loading control: Histone H1, compared to non-infected cells (n = 2 independent experiments). All source of this Figure are data provided as source file.

Similar articles

Cited by

References

    1. Preez LLdu, Patterton H-G. Secondary structures of the core histone N-terminal tails: their role in regulating chromatin structure. Sub-cell Biochem. 2013;61:37–55. doi: 10.1007/978-94-007-4525-4_2. - DOI - PubMed
    1. Kouzarides T. Chromatin modifications and their function. Cell. 2007;128:693–705. doi: 10.1016/j.cell.2007.02.005. - DOI - PubMed
    1. Allfrey VG, Faulkner R, Mirsky AE. Acetylation and methylation of histones and their possible role in the regulation of RNA synthesis. Proc. Natl Acad. Sci. 1964;51:786–794. doi: 10.1073/pnas.51.5.786. - DOI - PMC - PubMed
    1. Murray K. The occurrence of iε-N-Methyl Lysine in Histones. Biochem.-us. 1964;3:10–15. doi: 10.1021/bi00889a003. - DOI - PubMed
    1. Rice JC, Allis CD. Histone methylation versus histone acetylation: new insights into epigenetic regulation. Curr. Opin. Cell Biol. 2001;13:263–273. doi: 10.1016/S0955-0674(00)00208-8. - DOI - PubMed

Publication types