. 2023 Aug;45(4):2601-2627.
doi: 10.1007/s11357-023-00789-3. Epub 2023 Apr 14.

Protectin DX as a therapeutic strategy against frailty in mice

Affiliations

Protectin DX as a therapeutic strategy against frailty in mice

Laís R Perazza et al. Geroscience. 2023 Aug.

Abstract

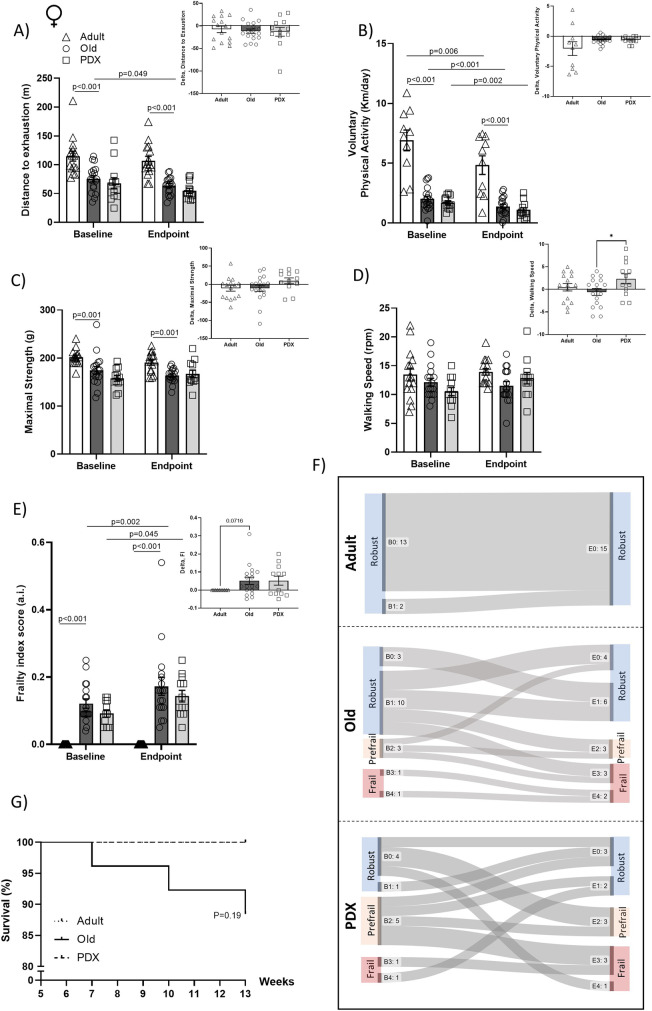
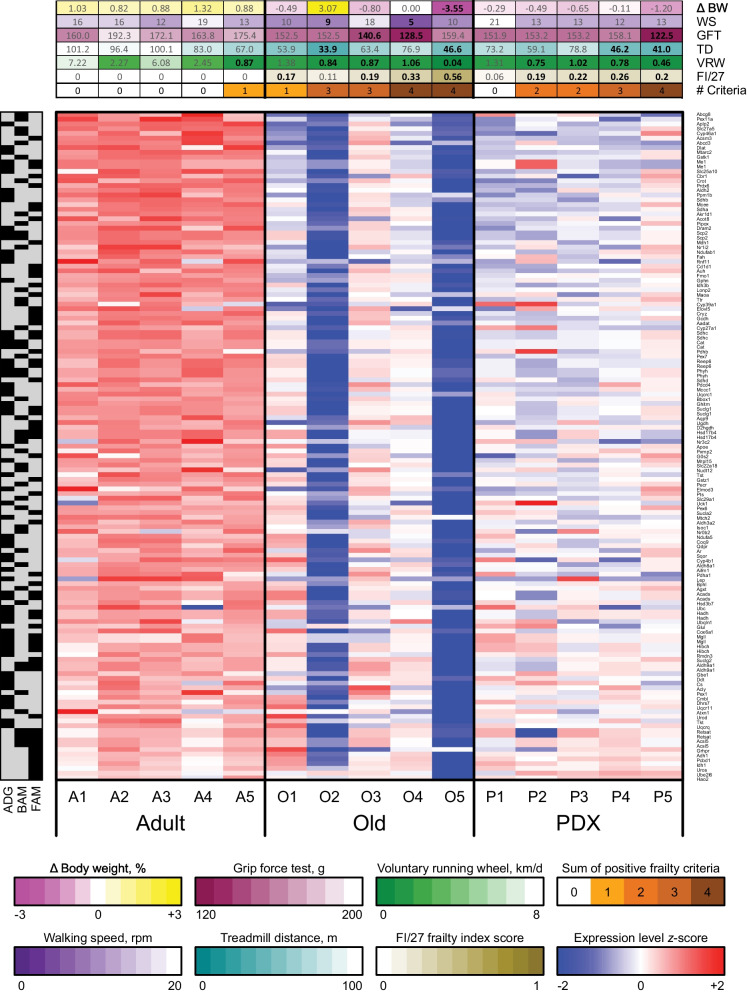
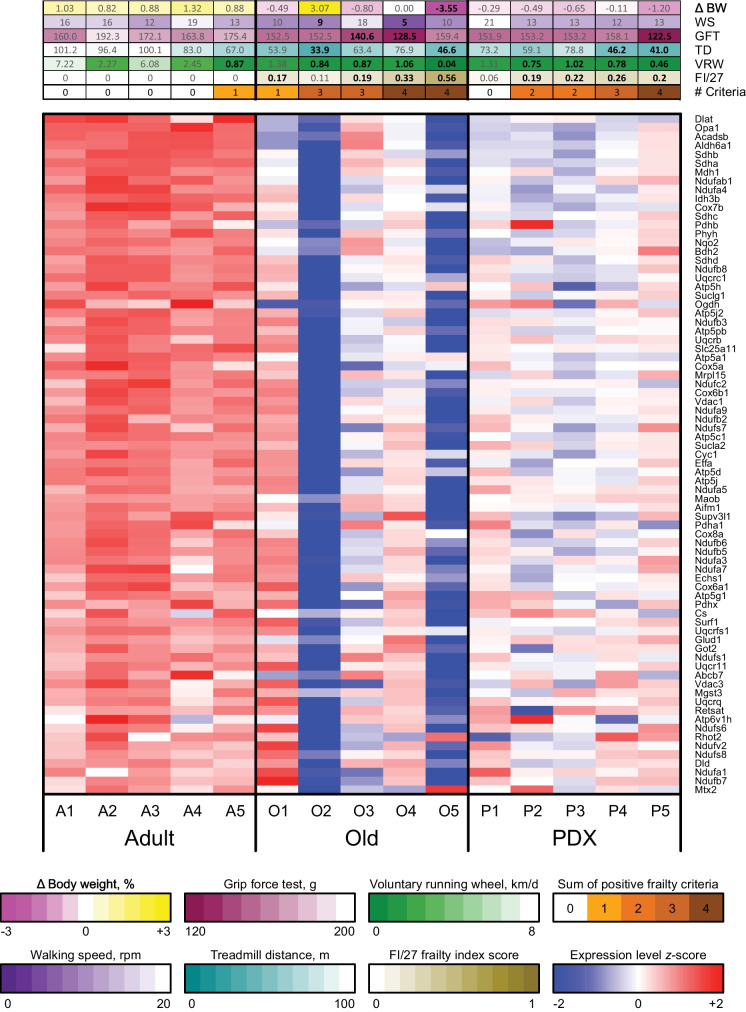
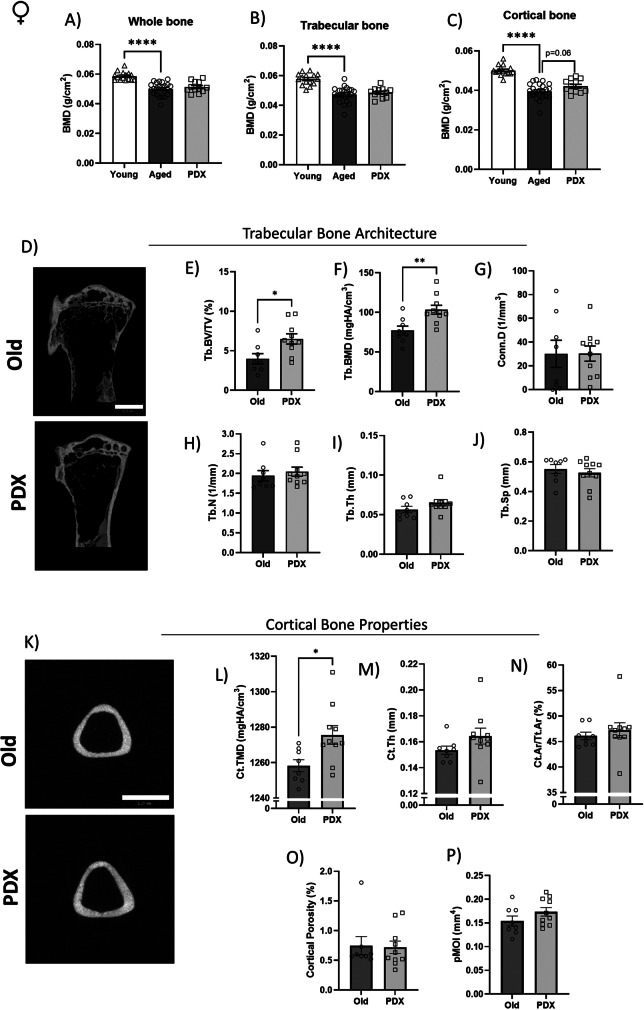
Frailty in aging is driven by the dysregulation of multiple biological pathways. Protectin DX (PDX) is a docosahexaenoic acid (DHA)-derived molecule that alleviates many chronic inflammatory disorders, but its potential effects on frailty remain unknown. Our goal is to identify age-related impairments in metabolic systems and to evaluate the therapeutic potential of PDX on frailty, physical performance, and health parameters. A set of 22-month-old C57BL/6 male and female mice were assigned to vehicle (Old) or PDX daily gavage treatment for 9 weeks, whereas 6-month-old (Adult) mice received only vehicle. Forelimb and hindlimb strength, endurance, voluntary wheel activity and walking speed determined physical performance and were combined with a frailty index score and body weight loss to determine frailty status. Our data shows that old vehicle-treated mice from both sexes had body weight loss paralleling visceromegaly, and Old females also had impaired insulin clearance as compared to the Adult group. Aging was associated with physical performance decline together with higher odds of frailty development. There was also age-driven mesangial expansion and glomerular hypertrophy as well as bone mineral density loss. All of the in vivo and in vitro impairments observed with aging co-occurred with upregulation of inflammatory pathways and Myc signaling as well as downregulation of genes related to adipogenesis and oxidative phosphorylation in liver. PDX attenuated the age-driven physical performance (strength, exhaustion, walking speed) decline, promoted robustness, prevented bone losses and partially reversed changes in hepatic expression of Myc targets and metabolic genes. In conclusion, our data provides evidence of the beneficial therapeutic effect of PDX against features of frailty in mice. Further studies are warranted to investigate the mechanisms of action and the potential for human translation.

Keywords: Aging; Bone mineral density; Frailty; Liver transcriptomics; Physiological decline; Protectin DX.


Conflict of interest statement

The authors declare no conflict of interest.

Figures

Fig. 1
Fig. 1
Aging is associated with declines in body weight and temperature in both sexes and reduced insulin clearance in females. Weekly body weight (BW, A) and body temperature (BT, B) with area under the curve (AUC, insert) of female mice throughout the 13 weeks of the intervention timeline. At week 1 the Adult and Old animals were 6 months and 22 months old, respectively. Plasma levels of glycemia (C), insulinemia (D) and C-peptide (E) during oral glucose tolerance test (oGTT) performed at week 13 with AUC. Plasma C-peptide/insulin ratio (F) during oGTT with AUC. Weekly body weight (BW, G) and body temperature (BT, H) with AUC of male mice throughout the 13 weeks of experimental timeline. Plasma levels of glycemia (I), insulinemia (J) during oral glucose tolerance test (oGTT) performed at week 13 with AUC. Data are expressed as mean ± SEM. Statistical analysis from BW, BT and oGTT data were determined by repeated measures two-way ANOVA with Bonferroni’s post hoc test, whereas AUC differences were calculated by Student’s t test. *P < 0.05 vs. Adult; ****P < 0.0001 vs. Adult; #P < 0.05 vs. Old. Arrow indicates the initiation of gavaging period
Fig. 2
Fig. 2
In female mice, aging is associated with decline in physical performance, which is attenuated by PDX treatment, promoting robustness. Maximal forelimb force, distance to exhaustion, voluntary wheel activity and walking speed were assessed in female mice to determine physical performance before and after PDX treatment (A-D, with inserted AUC). A frailty index score was determined as described in Methods at baseline and at endpoint (E, with AUC). Frailty index scores and performances from the physical phenotype evaluation were used to determine whether an animal was frail, prefrail or robust, as described in Methods. Sankey flow diagrams illustrate the number of animals with 0-4 health deficits at baseline (B0-B4) and at endpoint (E0-E4) and the frailty category and progression of each animal throughout the intervention period (F). Survival is represented as survival rate (%, G). Adult and Old animals were 6 months and 22 months old, respectively, at baseline, and 10 months and 26 months old, respectively, at endpoint. Data in panels A-E are expressed as mean ± SEM. Statistical analysis for all performance tests were determined by repeated measures two-way ANOVA with Bonferroni’s post hoc test, whereas differences in AUC values were determined by Student’s t test, comparing Old versus Adult and Old versus PDX. Differences in survival rate were measured by logrank (Mantel-Cox) test versus Adult. *P < 0.05 vs. Adult
Fig. 3
Fig. 3
In male mice, aging is associated with decline in physical performance, which is attenuated by PDX treatment, promoting robustness. Maximal forelimb force, distance to exhaustion, voluntary wheel activity and walking speed were assessed in male mice to determine physical performance before and after PDX treatment (A-D, with inserted AUC). A frailty index score was determined as described in Methods at baseline and at endpoint (E, with AUC). Frailty index scores and performances from the physical phenotype evaluation were used to determine whether an animal was frail, prefrail or robust, as described in Methods. Sankey flow diagrams illustrate the number of animals with 0-4 positive frailty criteria at baseline (B0-B4) and at endpoint (E0-E4) and the progression of each animal throughout the intervention period (F). Survival is represented as survival rate (%, G). Adult and Old animals were 6 months and 22 months old, respectively, at baseline, and 10 months and 26 months old, respectively, at endpoint. Data in panels A-E are expressed as mean ± SEM. Statistical analysis for all performance tests were determined by repeated measures two-way ANOVA with Bonferroni’s post hoc test, whereas differences in AUC values were determined by Student’s t test, comparing Old versus Adult and Old versus PDX. Differences in survival rate were measured by logrank (Mantel-Cox) test versus Adult. *P < 0.05 vs. Adult; **P < 0.01 vs. Adult; ****P < 0.0001 vs. Adult
Fig. 4
Fig. 4
Targets of the transcription factor Myc are coordinately upregulated in the liver of female animals with aging, which is attenuated by PDX treatment. The heatmap indicates the variance-stabilizing-transformed (VST) expression of the union set of genes that are in the leading edges of the two Hallmark Myc target gene sets (v1 and v2) for both comparisons (coordinately downregulated in Old vs Adult, FDR q < 0.05; coordinately upregulated in PDX vs Old, FDR q < 0.05). Rows and columns correspond to genes and samples, respectively, and the presence or absence of each gene within each gene set is indicated by gray and black boxes, respectively. Blue and red indicate VST expression values that are at least 2 standard deviations below or above, respectively, the mean value (white) of each row. The various frailty metrics are shown in sidebars above each column: average weekly percent change in body weight over the 12-week period of the study (Δ BW), and walking speed (WS), grip force test (GFT), treadmill distance (TD), voluntary running wheel activity (VRW), and FI/27 frailty index score measured at endpoint. The bottommost column sidebar indicates the tally of positive frailty criteria, i.e., the number of metrics that fall within the frailest quintile across all animals in the study (indicated in bold face). Color scales are shown below the heatmap, with darker colors corresponding to greater frailty. Rows are sorted from top to bottom by Old vs Adult Wald statistic, and columns are sorted from left to right first by sample group, then by number of positive frailty criteria, and finally by FI/27 frailty index score
Fig. 5
Fig. 5
Genes involved in lipid metabolism are coordinately downregulated in the liver of female animals with aging, which is partly attenuated by PDX treatment. The heatmap indicates the variance-stabilizing-transformed (VST) expression of the union set of genes that are in the leading edges of the Hallmark adipogenesis (ADG), bile acid metabolism (BAM), and fatty acid metabolism (FAM) gene sets for both comparisons (coordinately downregulated in Old vs Adult, FDR q < 0.05; coordinately upregulated in PDX vs Old, FDR q < 0.05). Rows and columns correspond to genes and samples, respectively, and the presence or absence of each gene within each gene set is indicated by gray and black boxes, respectively. Blue and red indicate VST expression values that are at least 2 standard deviations below or above, respectively, the mean value (white) of each row. The various frailty metrics are shown in sidebars above each column: average weekly percent change in body weight over the 12-week period of the study (Δ BW), and walking speed (WS), grip force test (GFT), treadmill distance (TD), voluntary running wheel activity (VRW), and FI/27 frailty index score measured at endpoint. The bottommost column sidebar indicates the tally of positive frailty criteria, i.e., the number of metrics that fall within the frailest quintile across all animals in the study (indicated in bold face). Color scales are shown below the heatmap, with darker colors corresponding to greater frailty. Rows are sorted from top to bottom by Old vs Adult Wald statistic, and columns are sorted from left to right first by sample group, then by number of positive frailty criteria, and finally by FI/27 frailty index score
Fig. 6
Fig. 6
Genes involved in oxidative phosphorylation are coordinately downregulated in the liver of female animals with aging, which is partly attenuated by PDX treatment. The heatmap indicates the variance-stabilizing-transformed (VST) expression of the genes that are in the leading edges of the Hallmark oxidative phosphorylation gene set for both comparisons (coordinately downregulated in Old vs Adult, FDR q < 0.0001; coordinately upregulated in PDX vs Old, FDR q < 0.0001). Rows and columns correspond to genes and samples, respectively. Blue and red indicate VST expression values that are at least 2 standard deviations below or above, respectively, the mean value (white) of each row. The various frailty metrics are shown in sidebars above each column: average weekly percent change in body weight over the 12-week period of the study (Δ BW), and walking speed (WS), grip force test (GFT), treadmill distance (TD), voluntary running wheel activity (VRW), and FI/27 frailty index score measured at endpoint. The bottommost column sidebar indicates the tally of positive frailty criteria, i.e., the number of metrics that fall within the frailest quintile across all animals in the study (indicated in bold face). Color scales are shown below the heatmap, with darker colors corresponding to greater frailty. Rows are sorted from top to bottom by Old vs Adult Wald statistic, and columns are sorted from left to right first by sample group, then by number of positive frailty criteria, and finally by FI/27 frailty index score
Fig. 7
Fig. 7
Age-driven decline in bone mineral density is attenuated by PDX treatment in female mice. Old vehicle-treated and PDX-treated female mice were euthanized at 25 months of age and tibias were isolated and fixed in 4% formaldehyde. Bone mineral density (BMD) from trabecular (A), cortical (B) and whole bone (C) was analyzed by dual energy X-ray absorptiometry (DEXA). 3D bone morphology was further analyzed in tibia from Old vehicle-treated and PDX-treated animals using Micro-CT. Trabecular bone architecture (D) is illustrated by BV/TV (E), BMD (F), Conn.D (G), Tb.N (H), Tb.Th (I) and Tb.Sp (J); whereas cortical bone properties (K) are shown by Ct.TMD (L), Ct.Th (M), Ct.Ar/Tt.Ar (N), cortical porosity (O) and pMOI (P). Data are expressed as mean ± SEM. All P values were determined by Student’s t test comparing Old versus PDX. *P < 0.05 vs. Adult; **P < 0.01 vs. Adult; ****P < 0.0001 vs. Adult. BMD: Bone mineral density; BV/TV: Bone Volume Fraction; Conn.D: Connectivity Density; Tb.N: Trabecular Number; Tb.Th: Trabecular thickness; Tb.Sp: Trabecular Separation; Ct.TMD: Cortical Tissue Mineral Density; Ct.Th: Cortical Thickness; Ct.Ar/Tt.Ar: Bone Area Fraction; pMOI: Polar Moment of Inertia

References

    1. Nations: World population prospects 2019: highlights - Google Scholar [Internet]. [cited 2022 Oct 3]. Available from: https://scholar.google.com/scholar_lookup?title=World%20Population%20Pro....
    1. Clegg A, Young J, Iliffe S, Rikkert MO, Rockwood K. Frailty in elderly people. Lancet. 2013;381(9868):752–762. - PMC - PubMed
    1. Fried LP, Tangen CM, Walston J, Newman AB, Hirsch C, Gottdiener J, et al. Frailty in Older Adults: Evidence for a Phenotype. J Gerontol: A. 2001;56(3):M146–M157. - PubMed
    1. van Assen MALM, Helmink JHM, Gobbens RJJ. Associations between lifestyle factors and multidimensional frailty: a cross-sectional study among community-dwelling older people. BMC Geriatr. 2022;22(1):7. - PMC - PubMed
    1. Schietzel S, Chocano-Bedoya PO, Sadlon A, Gagesch M, Willett WC, Orav EJ, et al. Prevalence of healthy aging among community dwelling adults age 70 and older from five European countries. BMC Geriatr. 2022;22(1):174. - PMC - PubMed

Publication types

Substances