. 2023 Apr 15;25(1):62.
doi: 10.1186/s13075-023-03040-8.

Activated CD90/Thy-1 fibroblasts co-express the Δ133p53β isoform and are associated with highly inflamed rheumatoid arthritis

Affiliations

Activated CD90/Thy-1 fibroblasts co-express the Δ133p53β isoform and are associated with highly inflamed rheumatoid arthritis

Anna K Wiles et al. Arthritis Res Ther. .

Abstract

Background: The p53 isoform Δ133p53β is known to be associated with cancers driven by inflammation. Many of the features associated with the development of inflammation in rheumatoid arthritis (RA) parallel those evident in cancer progression. However, the role of this isoform in RA has not yet been explored. The aim of this study was to determine whether Δ133p53β is driving aggressive disease in RA.

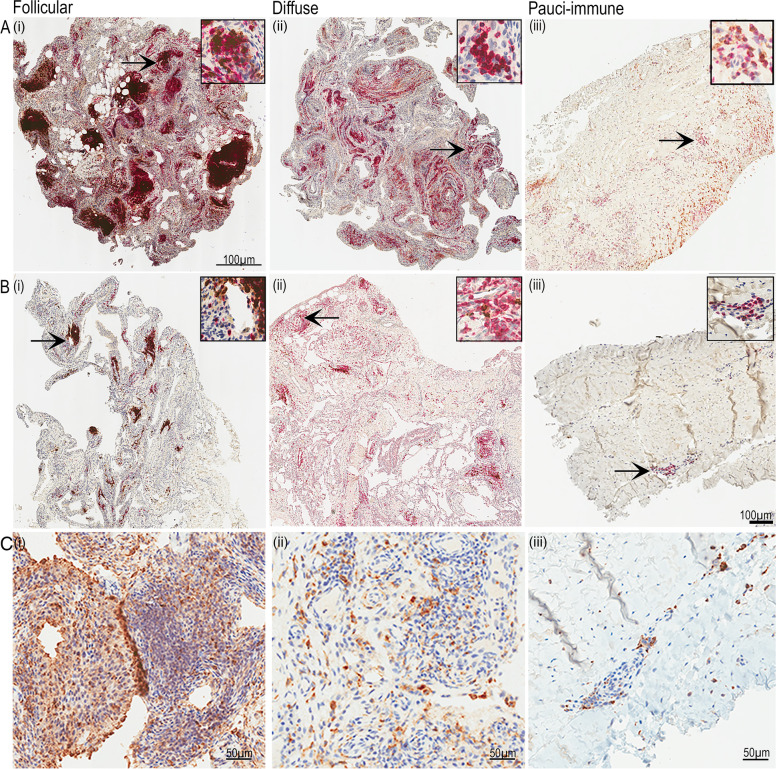
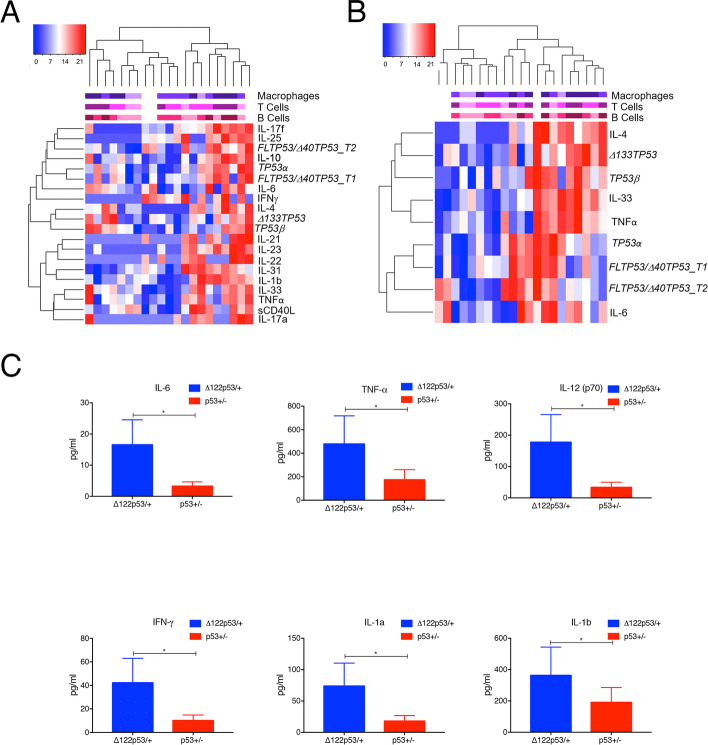
Methods: Using RA patient synovia, we carried out RT-qPCR and RNAScope-ISH to determine both protein and mRNA levels of Δ133p53 and p53. We also used IHC to determine the location and type of cells with elevated levels of Δ133p53β. Plasma cytokines were also measured using a BioPlex cytokine panel and data analysed by the Milliplex Analyst software.

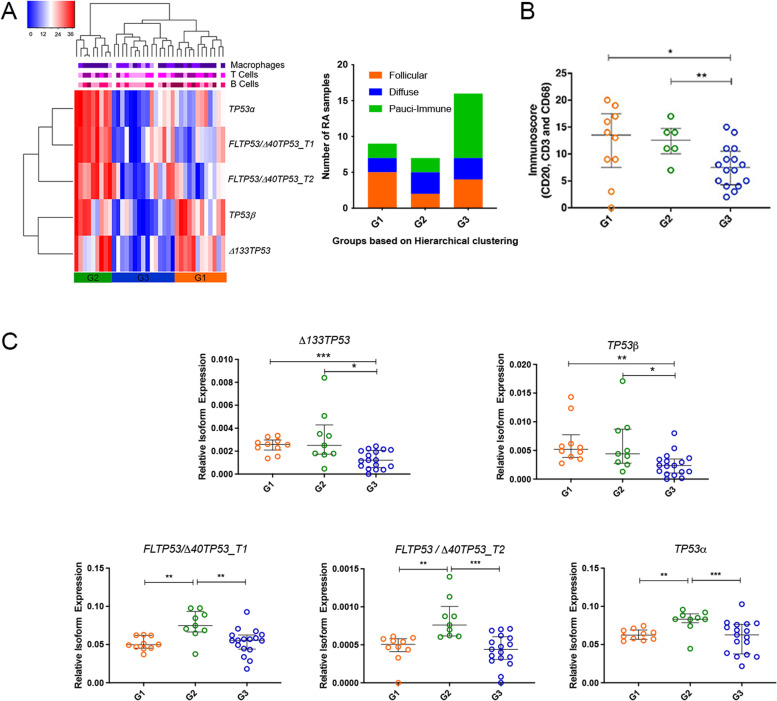
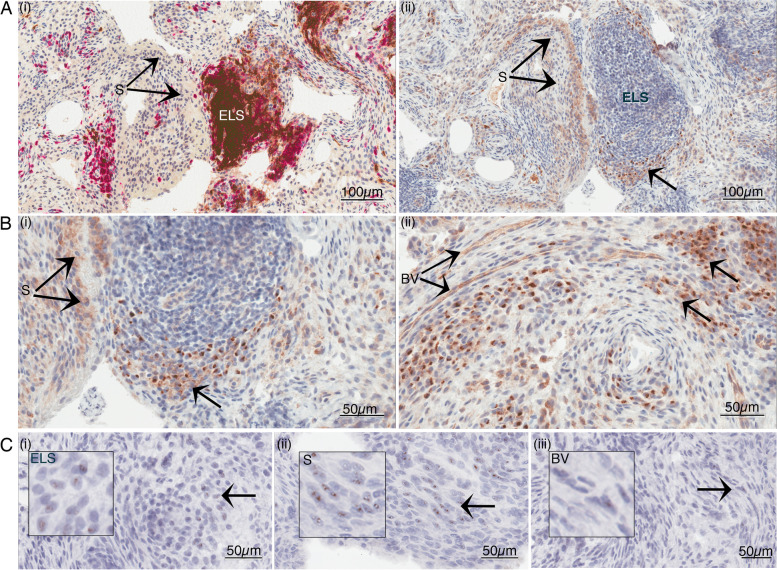
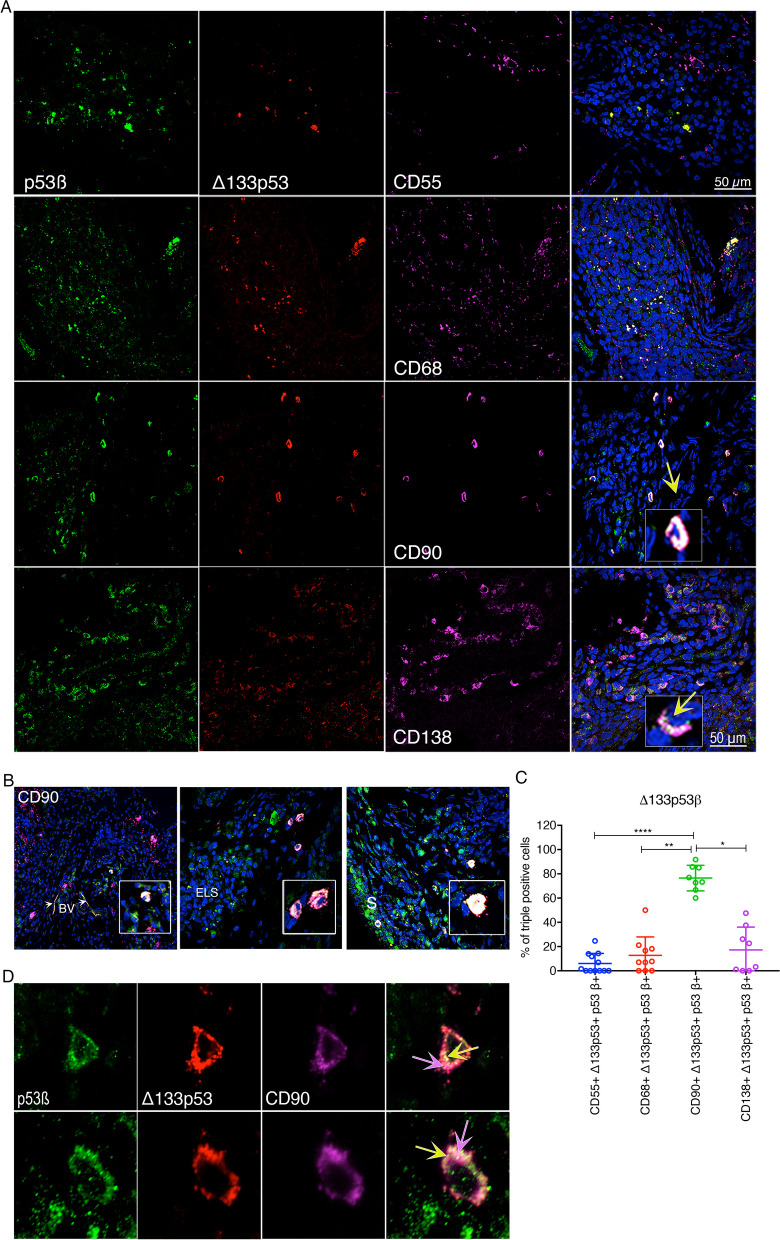
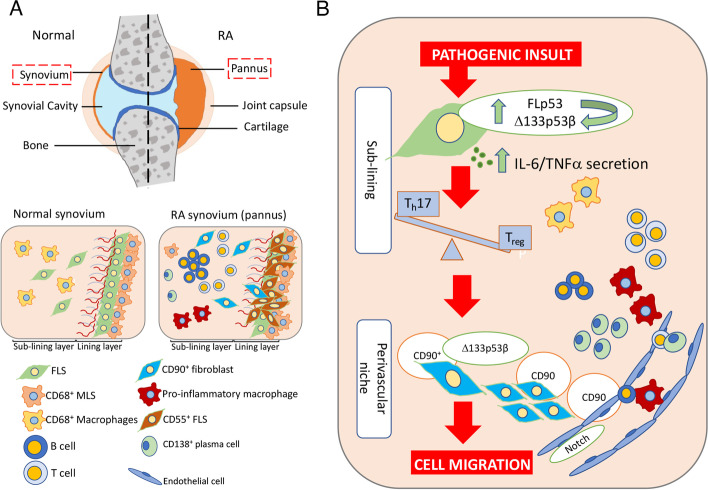
Results: Elevated levels of pro-inflammatory plasma cytokines were associated with synovia from RA patients displaying extensive tissue inflammation, increased immune cell infiltration and the highest levels of Δ133TP53 and TP53β mRNA. Located in perivascular regions of synovial sub-lining and surrounding ectopic lymphoid structures (ELS) were a subset of cells with high levels of CD90, a marker of 'activated fibroblasts' together with elevated levels of Δ133p53β.

Conclusions: Induction of Δ133p53β in CD90+ synovial fibroblasts leads to an increase in cytokine and chemokine expression and the recruitment of proinflammatory cells into the synovial joint, creating a persistently inflamed environment. Our results show that dysregulated expression of Δ133p53β could represent one of the early triggers in the immunopathogenesis of RA and actively perpetuates chronic synovial inflammation. Therefore, Δ133p53β could be used as a biomarker to identify RA patients more likely to develop aggressive disease who might benefit from targeted therapy to cytokines such as IL-6.

Keywords: CD90; Fibroblasts; Inflammation; Rheumatoid arthritis; Synoviocytes; p53 isoforms.


Conflict of interest statement

The authors declare no competing interests.

Figures

Fig. 1
Fig. 1
RA cohort divided into three synovial membrane histopathological subtypes which display different immune phenotypes, based on immune cell infiltrate. B cells and T cells were identified in duplex IHC by antibodies to CD20 (brown) and CD3 (red) (A, B). Macrophages/MLS identified by CD68 (brown) (C). Follicular: A (i) with many ectopic lymphoid structures (ELS) and T and B cell aggregates or B (i) small number of ELS and T- and B cells. Diffuse: A (ii) dominated by myeloid cells, T- and B-lymphocyte aggregates and scattered T and B cells; B (ii) small numbers of T- and B cell aggregates and scattered T- and B cells. Pauci-immune: A (iii) fibroblast dominated, with minimal inflammatory infiltrate areas of scattered T- and B cells; B (iii) very occasional T- and B cells. C CD68 + cells in (i) follicular, (ii) diffuse and (iii) pauci-immune subtypes. Arrows indicate the location of the inset (enlarged) images
Fig. 2
Fig. 2
RA samples with elevated Δ133TP53 and TP53β mRNA expression are associated with high immune infiltration. A Hierarchical clustering analysis of RA joint tissue by mRNA expression of FL/Δ40TP53_T1, FL/Δ40TP53_T2, Δ133TP53, TP53α and TP53β. The coloured label bars on the top indicate the amount of infiltration of CD68+ cells, CD3+ T cells and CD20.+ B cells (warm colours: high infiltration; cool colours: low infiltration). The bar graph represents the number of RA patient samples from each of the RA subtypes that fall within the groups G1, G2 or G3, determined by rank hierarchical clustering. B Immunoscore vs transcript expression for each patient sample. C Transcript expression of Δ133TP53, TP53β, FL/Δ40TP53_T1, FL/Δ40TP53_T2 and TP53α. Dots in B and C represent the individual data points in each group. The lines represent the mean and SD. Significance was determined using an unpaired t test with Welch’s correction. *p < 0.05; **p < 0.01
Fig. 3
Fig. 3
Δ133p53β gene expression seen in cells and areas positive for p53β protein. A IHC staining for (i) CD20+ B cells (brown) and CD3+ T cells (red) and (ii)79.3+ p53β protein expression; × 200 magnification. B IHC p53 higher magnification with (i) synovial cells and (ii) blood vessels displaying moderate granular staining and intense polarised staining seen in individual cells surrounding ELS, below the blood vessels and below the synovium as indicated; × 400 magnification. C RNAScope Δ133TP53 message evident (i) within and around ELS and endothelial cells of the blood vessels and (ii) within the synovial lining cells and in the synovial sub-lining cells; × 400 magnification. S, synovial lining; SS, synovial sub-lining; ELS, ectopic lymphoid structure; BV, blood vessel. Arrow represents the area immediately below the synovium
Fig. 4
Fig. 4
CD90+ FLS express the highest levels of Δ133p53β isoform. A p53β expressing cells (green, panel 1), Δ133p53αβγ expressing cells (red, panel 2), cells expressing either CD55+, CD68+ and CD90+ or CD138+ (magenta, panel 3); merged images (panel 4) showing co-localisation of p53β with Δ133p53β (yellow) and CD90+/Δ133p53β+ co-localisation (light pink); × 400 magnification, scale bar 50 μm. B Regional localisation of CD90+/Δ133p53β+ cells (light pink) adjacent to the blood vessels (BV, left panel), ELS (middle panel) and synovium and sub-lining (S, right panel); × 400 magnification, scale bar 50 μm. C The percentage of CD55+, CD68+, CD90+ and CD138+ cells, represented in A, which co-express p53β, Δ133p53 and both Δ133p53 and p53β. Each dot represents the results from each individual image field and a minimum of 100 cells. Lines represent the mean and standard deviation. Significance was determined using Kruskal–Wallis with Dunn’s multiple comparison (*p < 0.002, **p < 0.005 and ****p < 0.0001). D Δ133p53β isoform is located in CD90+ FLS. Images from the top and bottom rows show the cellular location of p53β (green, panel 1), Δ133p53αβγ (red, panel 2) and CD90 (magenta, panel 3). Panel 4 represents the merge of panels 1, 2 and 3, demonstrating the location of Δ133p53αβγ and p53β in CD90+ cells. Co-localisation of Δ133p53αβγ with p53β is yellow (yellow arrow) and represents Δ133p53β; note the large perinuclear aggregates; co-localisation of Δ133p53β (yellow) CD90 (magenta) is light pink (light pink arrow); co-localisation of Δ133p53αγ with CD90 is shown as a deeper pink. Panels 1 through 4 indicate panel position from left to right
Fig. 5
Fig. 5
RA synovial tissue with elevated Δ133TP53 and TP53β transcript expression is associated with elevated levels of plasma cytokines. A, B Hierarchical clustering analysis of RA synovial tissue by mRNA expression of FL/Δ40TP53_T1, FL/Δ40TP53_T2, Δ133TP53, TP53α and TP53β. A Fifteen Th17-related plasma cytokines. B Four selected plasma cytokines. The scale labels along the top indicate the amount of infiltration of CD68+ cells, CD3+ T cells and CD20+ B cells (warm colours: high infiltration; cool colours: low infiltration). C Levels of 6 serum cytokines (IL-6, TNF-α, IL-12(p70), IFN-γ, IL-1a and IL-1b) from 9-week-old Δ122p53 + / − (blue) and p53 + / − (red) mice. Shown are the mean concentrations of each cytokine from serum pooled from 4 individual mice with error bars at 97% CI. Significance was determined using an unpaired t test with Welch’s correction; *p < 0.05
Fig. 6
Fig. 6
Model proposing how Δ133p53β orchestrates CD90 cell migration in RA. A Graphical representation of the normal and RA joint synovia. B The inflammatory milieu invokes a TP53 response leading to an upregulation of Δ133p53β in FLS. This leads to cytokine secretion, including IL-6, sustaining a pro-inflammatory microenvironment. Downstream effects include the expansion and persistence of Th17 cells vs Tregs and the recruitment and activation of CD90+ FLS, resulting in their migration through the CD90+ perivasculature facilitated by CD90+ endothelial cells

Similar articles

Cited by

References

    1. Smolen JS, Aletaha D, McInnes IB. Rheumatoid arthritis. Lancet. 2016;388(10055):2023–2038. doi: 10.1016/S0140-6736(16)30173-8. - DOI - PubMed
    1. Deane KD, Demoruelle MK, Kelmenson LB, Kuhn KA, Norris JM, Holers VM. Genetic and environmental risk factors for rheumatoid arthritis. Best Pract Res Clin Rheumatol. 2017;31(1):3–18. doi: 10.1016/j.berh.2017.08.003. - DOI - PMC - PubMed
    1. Ai R, Laragione T, Hammaker D, Boyle DL, Wildberg A, Maeshima K, Palescandolo E, Krishna V, Pocalyko D, Whitaker JW, Bai Y, Nagpal S, Bachman KE, Ainsworth RI, Wang M, Ding B, Gulko PS, Wang W, Firestein GS. Comprehensive epigenetic landscape of rheumatoid arthritis fibroblast-like synoviocytes. Nat Commun. 2018;9(1):1921. doi: 10.1038/s41467-018-04310-9. - DOI - PMC - PubMed
    1. Tobon GJ, Youinou P, Saraux A. The environment, geo-epidemiology, and autoimmune disease: rheumatoid arthritis. J Autoimmun. 2010;35(1):10–14. doi: 10.1016/j.jaut.2009.12.009. - DOI - PubMed
    1. Bodkhe R, Balakrishnan B, Taneja V. The role of microbiome in rheumatoid arthritis treatment. Ther Adv Musculoskelet Dis. 2019;11:1759720X19844632. doi: 10.1177/1759720X19844632. - DOI - PMC - PubMed

Publication types

MeSH terms