. 2023 Apr 15;15(1):63.
doi: 10.1186/s13148-023-01477-x.

Bromodomain inhibitor i-BET858 triggers a unique transcriptional response coupled to enhanced DNA damage, cell cycle arrest and apoptosis in high-grade ovarian carcinoma cells

Affiliations

Bromodomain inhibitor i-BET858 triggers a unique transcriptional response coupled to enhanced DNA damage, cell cycle arrest and apoptosis in high-grade ovarian carcinoma cells

Marcos Quintela et al. Clin Epigenetics. .

Abstract

Background: Ovarian cancer has a specific unmet clinical need, with a persistently poor 5-year survival rate observed in women with advanced stage disease warranting continued efforts to develop new treatment options. The amplification of BRD4 in a significant subset of high-grade serous ovarian carcinomas (HGSC) has led to the development of BET inhibitors (BETi) as promising antitumour agents that have subsequently been evaluated in phase I/II clinical trials. Here, we describe the molecular effects and ex vivo preclinical activities of i-BET858, a bivalent pan-BET inhibitor with proven in vivo BRD inhibitory activity.

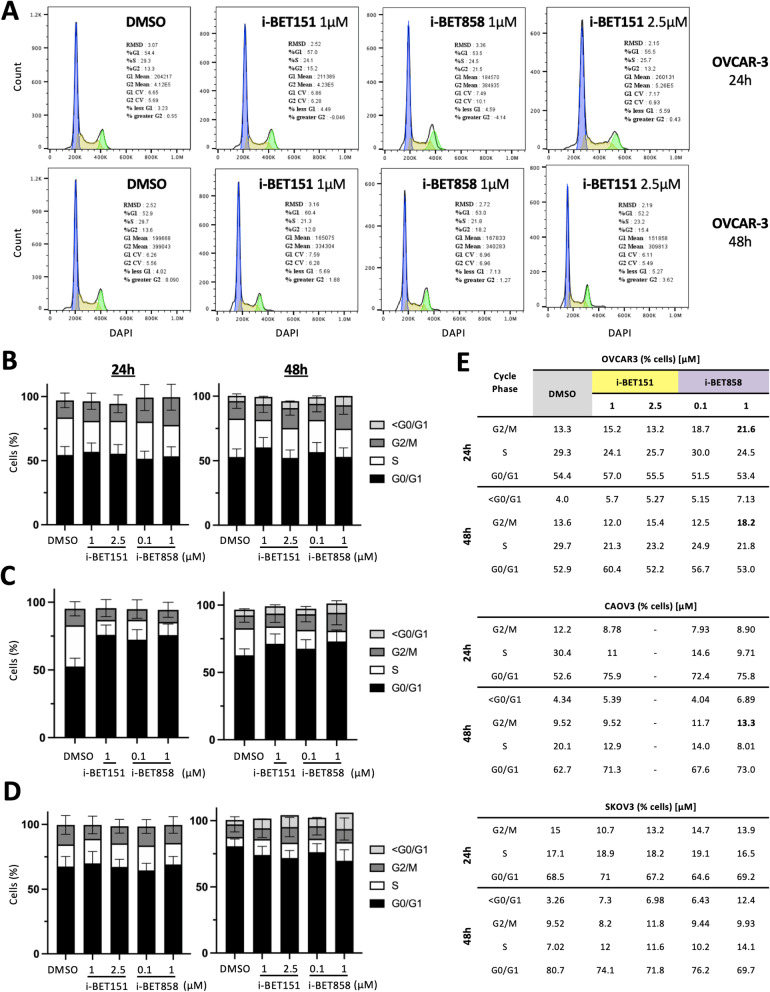
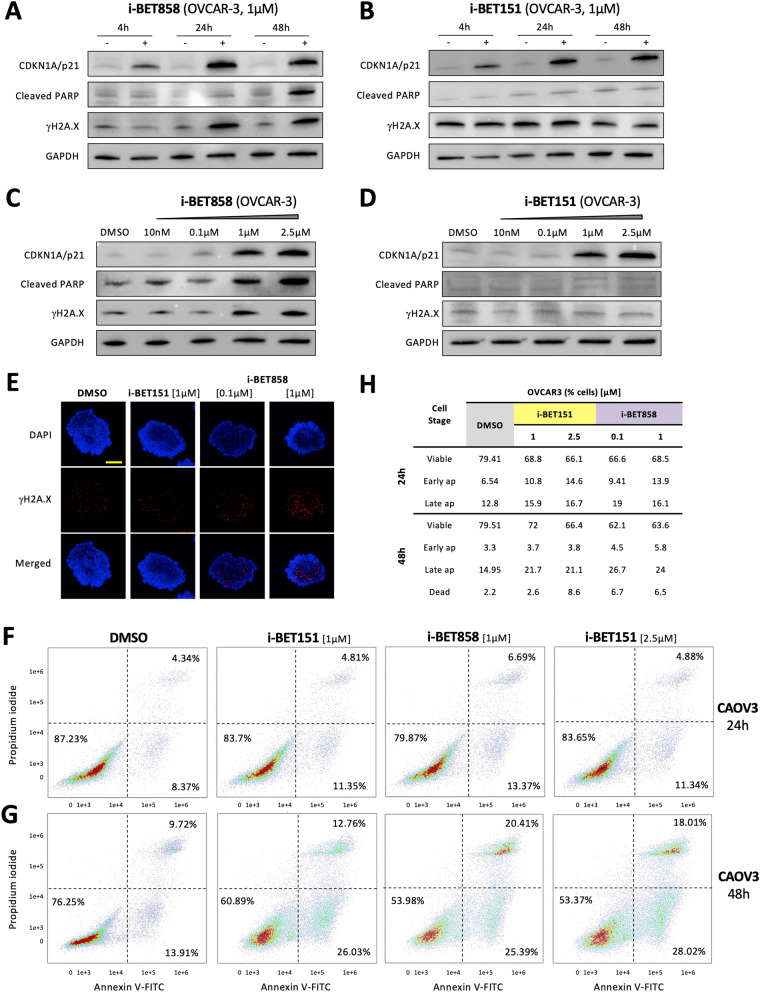
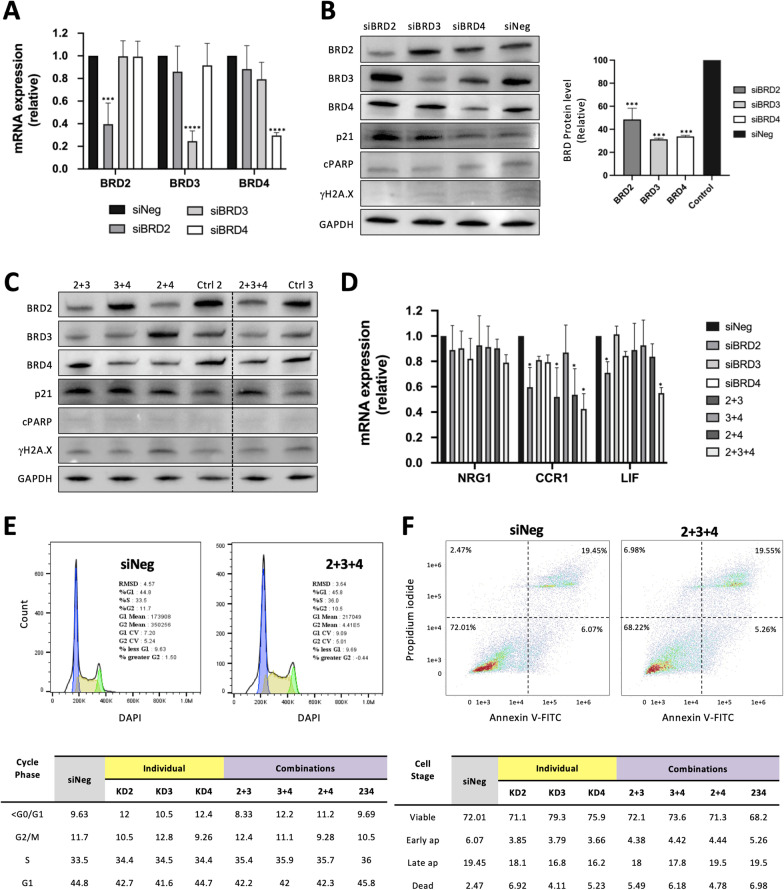
Results: i-BET858 demonstrates enhanced cytotoxic activity compared with earlier generation BETis both in cell lines and primary cells derived from clinical samples of HGSC. At molecular level, i-BET858 triggered a bipartite transcriptional response, comprised of a 'core' network of genes commonly associated with BET inhibition in solid tumours, together with a unique i-BET858 gene signature. Mechanistically, i-BET858 elicited enhanced DNA damage, cell cycle arrest and apoptotic cell death compared to its predecessor i-BET151.

Conclusions: Overall, our ex vivo and in vitro studies indicate that i-BET858 represents an optimal candidate to pursue further clinical validation for the treatment of HGSC.

Keywords: Advanced therapeutics; BETi; Drug development; Ovarian cancer; i-BET858.


Conflict of interest statement

NG, RKP and NRH are employees and shareholders of GSK. IR was an employee and shareholder of GSK when the study was carried out. All other authors declare no conflict of interest.

Figures

Fig. 1
Fig. 1
i-BET858 exhibits increased efficacy compared to other BETi in cell lines and primary samples. A Protein lysates from ovarian cancer cell lines were subjected to western blot analyses to study basal BET protein expression (BRD2, BRD3, BRD4). GAPDH was used as loading control. B, C and D Determination of IC50 values (µM) using 2D (B) and 3D (C) models of ovarian cancer cell lines. Cells were treated for 48 h with varying concentrations of i-BET858, i-BET151 and i-BET726 (10 pM–10 µM). DMSO was used as vehicle control, and staurosporine was used as positive control (+). (E) Microscopy images of 3D spheroids of SKOV3 and OVCAR-3 cells treated with varying concentrations of i-BET151 and i-BET858 (10 nM–10 µM) and vehicle control. Scales represent 100 µm. (F) Protein lysates from patient derived primary cells were subjected to western blot analyses to study basal protein expression of BRD2, BRD3 and BRD4. GAPDH was used as loading control. (G) Determination of IC50 values (µM) using 2D models of HGSC primary cells treated for 48 h with varying concentrations of i-BET858, i-BET151 and i-BET726 (10 pM–10 µM)
Fig. 2
Fig. 2
Transcriptome analyses of i-BET858 treatment highlight known BETi-associated pathways as well as unique features. A Principal component analysis (PCA) showing the distribution of data following RNA-sequencing of OVCAR-3 samples treated with i-BET858, i-BET151 and DMSO control for 4 and 24 h. Three biological replicates of each sample were sequenced. B Volcano plots displaying gene expression levels after 4 and 24 h of i-BET858 treatment (1 µM) in comparison with the DMSO control. Grey dots represent transcripts whose expression did not change significantly as a result of treatment, whilst red and blue dots represent transcripts that were up and down-regulated, respectively. C Venn diagram comparisons of differentially expressed genes between i-BET858 and i-BET151 treatments after 4 and 24 h. D Venn diagram comparison of differentially expressed genes between i-BET858 (4 h, 1 µM), i-BET151 (4 h, 1 µM), and JQ1 (0.125 µM, 40 min, GSE77568). E Table summarising expression changes on genes associated with a core BETi response. F Cell lysates of SKOV3, CAOV3, OVCAR-3 and UWB1.289 (UWB) cell lines were subjected to qRT-PCR validation to confirm changes in expression levels of NRG1, p21 and c-MYC targets. G Gene set enrichment pathway analysis of differentially expressed genes after 4 and 24 h of i-BET858 and i-BET151 treatments. H Gene over-representation pathway analysis of differentially expressed genes uniquely affected with i-BET858 treatment. All values represent the mean ± standard deviation (SD) of three biological samples (*P < 0.05, **P < 0.01, ***P < 0.001)
Fig. 3
Fig. 3
i-BET858 treatment leads to significant G2/M cell cycle arrest. A Flow cytometry cell cycle analyses of OVCAR-3 cells treated with different concentrations of i-BET151, i-BET858 and DMSO vehicle control for 24 and 48 h. Blue peaks represent cells in G0/G1 phase, whilst green peaks represent cells in G2/M phase. The area depicted as yellow represents cells in S phase. BD Illustrative representations of the percentage of OVCAR-3, CAOV3 and SKOV3 cells present in different cell cycle phases following treatment. Particles containing less DNA than that of G0/G1 cells (< G0/G1) are related to apoptotic damage; due to low numbers this population was overlooked in graphs displaying 24 h treatment results. FlowJo™ was unable to fit peaks obtained at high concentrations of i-BET151 (2.5 µM) in CAOV3 cells; these datasets are included in Additional file 1: Fig. S2. E Table detailing specific percentages of cells detected per cell cycle phase following treatments
Fig. 4
Fig. 4
Ovarian cancer cells undergo apoptosis following i-BET858 treatment. Protein lysates of OVCAR-3 cells treated with (A) i-BET858 and B i-BET151 were subjected to western blot analyses to study changes in CDKN1A/p21, cleaved PARP and γH2A.X protein levels after 4, 24 and 48 h of treatment; GAPDH was used as loading control. C, D Protein lysates of OVCAR-3 cells treated with different concentrations of i-BET858 and i-BET151 (10 nM-2.5 µM; 48 h) were subjected to western blot analyses to study dose-dependent changes in CDKN1A/p21, cleaved PARP and γH2A.X protein levels. E Confocal microscopy images of OVCAR-3 spheroids treated with i-BET151, i-BET858 and DMSO control for 48 h. First and second rows show fluorescent-labelled DNA and γH2A.X staining, respectively; third row displays merged images of both fluorescent signals. Scale represents 100 µm. F, G Flow cytometry apoptosis analysis of CAOV3 cells treated with different concentrations of i-BET151, i-BET858 and DMSO vehicle control for (F) 24 h and G 48 h. Cells were stained with propidium iodide and Annexin V-FITC rendering 4 populations: viable (−, −), early apoptotic (−, +), late apoptotic (+, +) and dead (+, −), two of which are highlighted in the panels. Graphs display cell densities, whereby red, green and blue colours indicate high, medium and low cell densities, respectively. H Table detailing specific percentages of OVCAR-3 cells detected in each population following treatments. Percentages of dead cells after 24 h treatment were not significant and are not included in this table
Fig. 5
Fig. 5
BRD protein knockdown effect on ovarian cancer BET-associated mechanisms. A siRNA-mediated knockdown in OVCAR-3 cells resulted in significant BRD2, BRD3 and BRD4 transcript down-regulation after 48 h compared to the control treatment (siNeg). B Protein lysates of OVCAR-3 cells treated with specific siRNAs were subjected to western blot analyses to study changes in BRD2, BRD3, BRD4, p21, cleaved PARP (cPARP) and γH2A.X protein levels after 48 h of knockdown (KD). The right panel displays proportional differences between relative densities of BRD proteins in KD and control samples calculated using ImageJ. C Protein lysates of OVCAR-3 cells treated with different combinations of siRNAs were subjected to western blot analyses. The two controls correspond to different amounts of scrambled siRNA introduced in cells to mimic the action of 2 or 3 target siRNAs (Ctrl 2 and Ctrl 3). D Cell lysates from OVCAR-3 cells treated with combinations of siRNAs (2, 3 and 4) for 48 h were subjected to qRT-PCR to study mRNA expression changes of i-BET858 targets NRG1, CCR1 and LIF. Each KD was compared to their correspondent control sample which included different amounts of scrambled siRNA; only one control was plotted to simplify (siNeg). E Flow cytometry apoptosis analysis of OVCAR-3 cells treated with siRNA targeting BRD2, BRD3 and BRD4 for 48 h. Cells were stained with propidium iodide and Annexin V-FITC rendering 4 populations: viable (−, −), early apoptotic (−, +), late apoptotic (+, +) and dead (+, −). Graphs display cell densities, whereby red, green and blue colours indicate high, medium and low cell densities, respectively. F Flow cytometry cell cycle analyses of OVCAR-3 cells treated with siRNA targeting BRD2, BRD3 and BRD4 for 48 h. Blue peaks represent cells in G0/G1 phase, whilst green peaks represent cells in G2/M phase. The area depicted as yellow represents cells in S phase. All values represent the mean ± SD of three biological samples (*P < 0.05, ***P < 0.001, ****P < 0.0001)

Similar articles

Cited by

References

    1. Cancer Research UK. Ovarian cancer statistics 2020. https://www.cancerresearchuk.org/health-professional/cancer-statistics/s....
    1. Siegel RL, Miller KD, Jemal A. Cancer statistics, 2019. CA Cancer J Clin. 2019;69:7–34. doi: 10.3322/caac.21551. - DOI - PubMed
    1. Matulonis UA, Sood AK, Fallowfield L, Howitt BE, Sehouli J, Karlan BY. Ovarian cancer. Nat Rev Dis Prim. 2016;2:16061. doi: 10.1038/nrdp.2016.61. - DOI - PMC - PubMed
    1. Prat J. Ovarian carcinomas: five distinct diseases with different origins, genetic alterations, and clinicopathological features. Virchows Arch. 2012;460:237–249. doi: 10.1007/s00428-012-1203-5. - DOI - PubMed
    1. Kroeger PT, Drapkin R. Pathogenesis and heterogeneity of ovarian cancer. Curr Opin Obstet Gynecol. 2017;29:26–34. doi: 10.1097/GCO.0000000000000340. - DOI - PMC - PubMed

Publication types

MeSH terms