. 2023 Jun;10(16):e2204824.
doi: 10.1002/advs.202204824. Epub 2023 Apr 14.

Neuregulin4 Acts on Hypothalamic ErBb4 to Excite Oxytocin Neurons and Preserve Metabolic Homeostasis

Affiliations

Neuregulin4 Acts on Hypothalamic ErBb4 to Excite Oxytocin Neurons and Preserve Metabolic Homeostasis

Yi Zhang et al. Adv Sci (Weinh). 2023 Jun.

Abstract

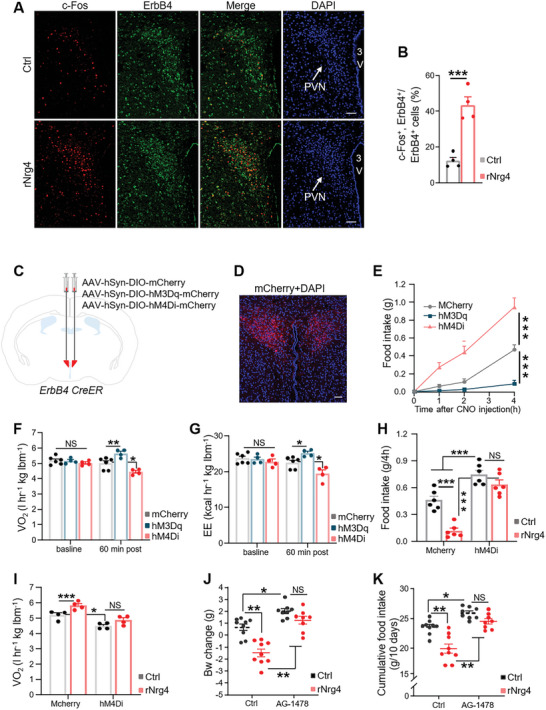
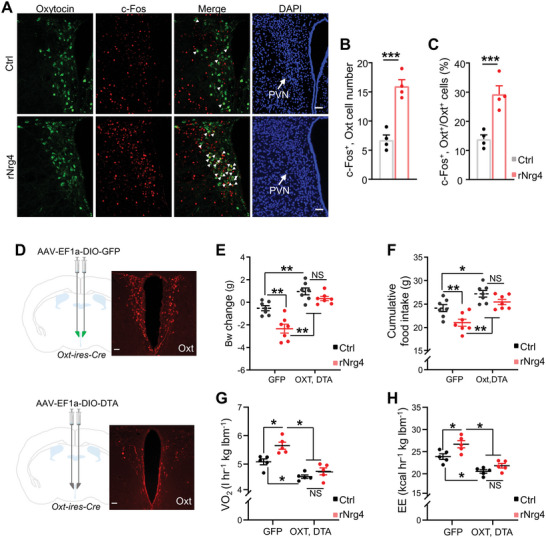
Neuregulin 4 (Nrg4) is an adipose tissue-enriched secreted factor that modulates glucose and lipid metabolism. Nrg4 is closely associated with obesity and preserves diet-induced metabolic disorders. However, the specific mechanisms via which Nrg4 regulates metabolic homeostasis remain incompletely understood. Here, this work finds that the Nrg4 receptor, ErbB4, is highly expressed in the hypothalamus, and the phosphorylation of hypothalamic ErbB4 is reduced in diet-induced obesity (DIO) mice. Peripheral Nrg4 can act on ErbB4 via blood circulation and excite neurons in the paraventricular nucleus of hypothalamus (PVN). Central administration of recombinant Nrg4 protein (rNrg4) reduces obesity and related metabolic disorders by influencing energy expenditure and intake. Overexpression of ErbB4 in the PVN protects against obesity, whereas its knock down in oxytocin (Oxt) neuron accelerates obesity. Furthermore, Nrg4-ErbB4 signaling excites Oxt release, and ablation of Oxt neuron considerably attenuates the effect of Nrg4 on energy balance. These data suggest that the hypothalamus is a key target of Nrg4, which partially explains the multifaceted roles of Nrg4 in metabolism.

Keywords: ErbB4; hypothalamus; neuregulin4; obesity; oxytocin neuron.


Conflict of interest statement

The authors declare no conflict of interest.

Figures

Figure 1
Figure 1
Impaired ErbB4 signaling in the hypothalamus of HFD‐fed mice. A,B) Metabolic tissue‐specific expression levels of Nrg4 and ErbB4 were measured in lean C57BL/6J male mice and are presented as ΔCT values (n = 3 for each group). C) tdTomato of ErbB4‐CreER::Ai14 mice showing ErbB4 expression in the PVN, DMH, VMH, and Arc of the hypothalamus. Cell nuclei were counterstained with DAPI. Scale bar, 50 µm. D) Western blot (WB) analysis of ErbB4 and pErbB4 in the hypothalamus of chow‐ or HFD‐fed mice. β‐actin was used as loading control. E) Quantification of the Western blots for ErbB4 and pErbB4. n = 4 for each group. F) Fluorescent Nissl staining (Neuro Trace, neurons, green) in PVN of ErbB4‐CreER::Ai14 mice. 3 V, third ventricle. Cell nuclei were counterstained with DAPI. Scale bar, 50 µm. Data are presented as mean ± SEM; **p < 0.01, two‐tailed Student's t‐test (E).
Figure 2
Figure 2
Nrg4 targets the brain to preserve metabolic homeostasis A) WB analysis of pErbB4 and ErbB4 from hypothalamic lysates of mice treated with Ctrl or rNrg4 (500 µg kg−1) for 30 min. B) Immunofluorescence staining of c‐Fos in the PVN of mice intraperitoneally injected with rNrg4 (500 µg kg−1) or control for 2 h. Scale bar, 100 µm. C) Numbers of c‐Fos+ cells in the PVN (n = 5 for each group). D–G) DIO mice receiving daily central administration of rNrg4 or Ctrl for 10 days. D) Body weight, E) representative DEXA images, F) body weight changes, and G) fat mass changes. Ctrl, 0.9% NaCl‐injected mice (n = 8 for Ctrl, n = 7 for rNrg4). H,I) H&E staining (H) and mean area of adipocytes (I) in epididymal white adipose tissue (eWAT) from mice administered Ctrl or rNrg4 (n = 3 for each group). Scale bar, 100 µm. J) Serum triglyceride (TG) levels of mice administered Ctrl or rNrg4 (n = 7 for Ctrl, n = 6 for rNrg4). K,L) Glucose tolerance test (GTT, K) and AUC of GTT(L) of mice injected with Ctrl or rNrg4 (n = 8 for Ctrl, n = 7 for rNrg4). M) Cumulative food intake of mice injected with Ctrl or rNrg4 (n = 8 for Ctrl, n = 7 for rNrg4). N,O) HFD‐fed mice were i.c.v. injected saline or rNrg4. Oxygen consumption (VO2, N) and Energy expenditure (EE, O) for 8 h post treatment are shown (n = 5 for each group). lbm, lean body mass. Data are presented as mean ± SEM. *p < 0.05, **p < 0.01, ***p < 0.001, two‐tailed Student's t‐test (C,F,G,I,J,L,N,O); two‐way analysis of variance (ANOVA) with Bonferroni's post hoc test (D,K,M).
Figure 3
Figure 3
PVN ErbB4 neurons mediate Nrg4's effect on energy balance. A) Double immunostaining of ErbB4 (green) and c‐Fos (red) in the PVN of control‐ or Nrg4‐administered mice. Cell nuclei were counter‐stained with DAPI. Scale bar, 50 µm. B) Percentage of ErbB4+ cells expressing c‐Fos in the PVN of Ctrl or rNrg4‐administered mice (n = 4 for each group). C) A diagram depicting bilateral injection of AAV‐hSyn‐DIO‐mCherry, AAV‐hSyn‐DIO‐hM3Dq‐mCherry, and AAV‐hSyn‐DIO‐hM4Di‐mCherry into the PVN of ErbB4 CreER mice. D) Representative image showing mCherry expression in the PVN. The section was counter‐stained with DAPI. Scale bar: 50 µm. E) HFD‐fed ErbB4 CreER mice expressed mCherry, hM3Dq‐mCherry, hM4Di‐mCherry in PVN were briefly fasted and treated with CNO immediately before light‐off. Food intake during the following 1, 2, and 4 h were shown (n = 7 for mCherry, hM3Dq‐mCherry mice, n = 6 for hM4Di‐mCherry). F,G) VO2 (F) and EE (G) average during 1 h period before and after CNO injection in mCherry, hM3Dq‐mCherry and hM4Di‐mCherry mice under HFD feeding for 2 weeks (n = 7 for mCherry mice, n = 6 for hM3Dq‐mCherry and hM4Di‐mCherry). H) HFD‐fed ErbB4 CreER mice expressed mCherry and hM4Di‐mCherry in PVN were briefly fasted and treated with CNO and saline or rNrg4. Food intake for 4 h post treatment was shown (n = 6 for each group). lbm, lean body mass. I) HFD‐fed ErbB4 CreER mice expressed mCherry and hM4Di‐mCherry in PVN were treated with saline or rNrg4. VO2 for 4 h post treatment was shown (n = 4 for each group). lbm, lean body mass. J,K) HFD‐fed mice were centrally administered control or 20 nmol of the ErbB4 antagonist, AG‐1478. After 1 h, mice received i.c.v. injections of control or 500 ng of rNrg4 for 10 consecutive days. Body weight changes (J) and cumulative food intake (K) were measured (n = 9 for Ctrl, n = 8 for AG‐1478). Data are presented as mean ± SEM; *p < 0.05, **p < 0.01, two‐tailed Student's t‐test (B); two‐way analysis of variance (ANOVA) with Bonferroni's posthoc test (E–K).
Figure 4
Figure 4
Overexpression of ErbB4 in the PVN protects against DIO. A) EGFP expression (green) after injection of the control lentivirus (Ctrl‐L) into the PVN. Cell nuclei were counterstained with DAPI (blue). Scale bar, 100 µm. B) Western blot analysis of ErbB4 expression in PVN lysates of mice injected with Ctrl‐L and ErbB4‐L viruses (n = 3 for each group). C–F) Body weights(C), DEXA images(D), fat mass (E), and lean mass(F) of mice injected with Ctrl‐L or ErbB4‐L virus into the PVN under a HFD diet (n = 9 for Ctrl‐L, n = 8 for ErbB4‐L). G,H) H&E staining (G) and mean area (H) of adipocytes of eWAT of mice fed a HFD for 20 weeks (n = 4 for each group). Scale bar, 100 µm. I) Serum TG levels of mice fed a HFD for 20 weeks. (n = 8 for Ctrl‐L, n = 6 for ErbB4‐L). J,K) GTT (J) and AUC of GTT (K) of mice fed a HFD for 8 weeks (n = 8 for Ctrl‐L, n = 7 for ErbB4‐L). L) Daily food intake of Ctrl‐L and ErbB4‐L mice (n = 7 for each group). M,N) Mice were intra‐PVN injected with Ctrl‐L and ErbB4‐L viruses. VO2 (M), carbon dioxide (VCO2, N), and O) EE of Ctrl‐L and ErbB4‐L mice fed a HFD for 1 week. (n = 5 for Ctrl‐L, n = 6 for ErbB4‐L). Data are presented as mean ± SEM; *p < 0.05, **p < 0.01, two‐tailed Student's t‐test (E,H,I,K,L); two‐way analysis of variance (ANOVA) with Bonferroni's post hoc test (C,J,M–O).
Figure 5
Figure 5
Blocking Oxt attenuates the effects of rNrg4 on energy balance. A) Double immunofluorescence staining of oxytocin (green) and c‐Fos (red) in the PVN of mice administered control or rNrg4. Cell nuclei were counterstained with DAPI (blue). Arrows indicate c‐Fos and Oxt co‐expressing cells. Scale bar, 50 µm. B,C) Number of c‐Fos+ and Oxt+ cells (B) and percentage of Oxt+ cells expressing c‐Fos (C) in the PVN (n = 4 for each group). D) Schematic representation of GFP and DTA virus injection sites with representative images of Oxt expression in the PVN. Scale bar, 100 µm. E,F) Adult male Oxt‐ires‐Cre mice were injected with AAV‐DIO‐GFP (Ctrl) or AAV‐Ef1a‐DIO‐DTA (DTA) viruses into the PVN and were fed a HFD for 4 weeks. The mice were centrally injected with saline or rNrg4 for 10 consecutive days. Body weight changes (E) and cumulative food intake (F) were measured (n = 7 for each group). G,H) Ctrl and Oxt neuron‐ablated mice were centrally injected with saline or rNrg4 immediately before dark light. VO2 (G) and EE (H) were then measured for 12 h in the dark light after injection (n = 5 for AAV‐DIO‐GFP, n = 6 for AAV‐DIO‐DTA). lbm, lean body mass. Data are presented as mean ± SEM; *p < 0.05, **p < 0.01, two‐tailed Student's t‐test (B,C); two‐way analysis of variance (ANOVA) with Bonferroni's correction (E–H).
Figure 6
Figure 6
Oxt neuron‐specific knockdown of ErbB4 aggravates obesity. A) Body weights of mice injected with either Oxt‐shCtrl or Oxt‐shErbB4 virus into the PVN. Mice were fed a chow diet for the first 3 weeks after injection, and then mice were switched to a HFD (n = 10 per group). B–D) DEXA images (B), fat mass (C), and lean mass (D) of mice injected with either Oxt‐shCtrl or Oxt‐shErbB4 virus into the PVN under a HFD diet for 10 weeks (n = 10 for each group). E,F) Representative H&E staining images (E) and mean eWAT area (F) of Oxt‐shCtrl and Oxt‐shErbB4 mice (n = 4 for each group). Scale bar, 50 µm. G,H) GTT (G) and AUC of GTT (H) of mice fed a HFD for 12 weeks (n = 10 for each group). I) Average food intake of Oxt‐shCtrl or Oxt‐shErbB4 mice fed a HFD (n = 10 for each group). J–L) O2 consumption (J), CO2 production(K), and EE (L) of mice fed a HFD for 1 week. (n = 5 for Oxt‐shCtrl, n = 6 for Oxt‐shErbB4). Data are presented as mean ± SEM; *p < 0.05, **p < 0.01, two‐tailed Student's t‐test (C,D,F,H,I); two‐way analysis of variance (ANOVA) with Bonferroni's correction (A,G,J–L).
Figure 7
Figure 7
Nrg4‐ErbB4 signaling regulates Oxt release from the PVN. A,B) Oxt‐shCtrl or Oxt‐shErbB4 mice under a HFD feeding were treated with rNrg4 or saline; 24 h body weight (A) and food intake (B) were measured. (n = 5 for Oxt‐shCtrl and rNrg4; n = 6 for remaining groups). C) HFD‐fed mice were injected with Oxt‐shCtrl or Oxt‐shErbB4 virus into the PVN, treated with rNrg4 or saline for 7 consecutive days, and serum Oxt levels were measured. (n = 5 for Oxt‐shCtrl, n = 6 for Oxt‐shErbB4). D) Basal and rNrg4 (1 µg mL−1)‐elicited Oxt release in PVN slices of HFD‐fed mice (n = 5 for Ctrl, n = 6 for rNrg4). E) Basal Oxt release of PVN slices of HFD‐fed Oxt‐shCtrl or Oxt‐shErbB4 mice (n = 9 for Oxt‐ShCtrl, n = 8 for Oxt‐ShErbB4). F,G) HFD‐fed mice were centrally administered with control or 2 µg of an OXT antagonist, L‐372662. After 1 h, mice received daily i.c.v. injections of control or 500 ng of rNrg4. 24 h body weight changes (F) and cumulative food intakes (G) were measured (n = 7 for each group). H,I) HFD‐fed Oxt‐shCtrl and Oxt‐s hErbB4 mice were treated with control or Oxytocin, body weight changes (H) and food intake (I) were measured (n = 7 for each group). Data are presented as mean ± SEM; *p < 0.05, **p < 0.01, ***p < 0.001, two‐tailed Student's t‐test (D,E); one‐way analysis of variance (ANOVA) with Bonferroni's correction (A–C); two‐way analysis of variance (ANOVA) with Bonferroni's correction (F–I).

Similar articles

Cited by

References

    1. Hill J. O., Wyatt H. R., Peters J. C., Circulation 2012, 126, 126. - PMC - PubMed
    1. Hu C., Jia W., Diabetes 2018, 67, 3. - PubMed
    1. Piché M. E., Tchernof A., Després J. P., Circ. Res. 2020, 126, 1477. - PubMed
    1. Hopkins B. D., Goncalves M. D., Cantley L. C., J. Clin. Oncol. 2016, 34, 4277. - PMC - PubMed
    1. Caron A., Lee S., Elmquist J. K., Gautron L., Nat. Rev. Neurosci. 2018, 19, 153. - PMC - PubMed

Publication types

LinkOut - more resources