

The Evolution of the Age of Onset of Resistance to Infectious Disease
- PMID: 37060428
- PMCID: PMC10105688
- DOI: 10.1007/s11538-023-01144-5
The Evolution of the Age of Onset of Resistance to Infectious Disease
Abstract
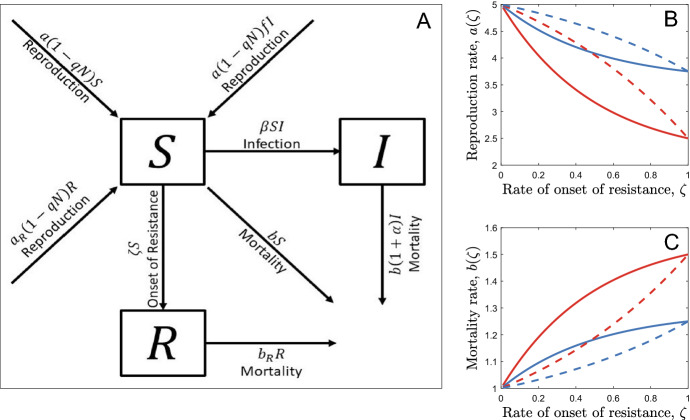
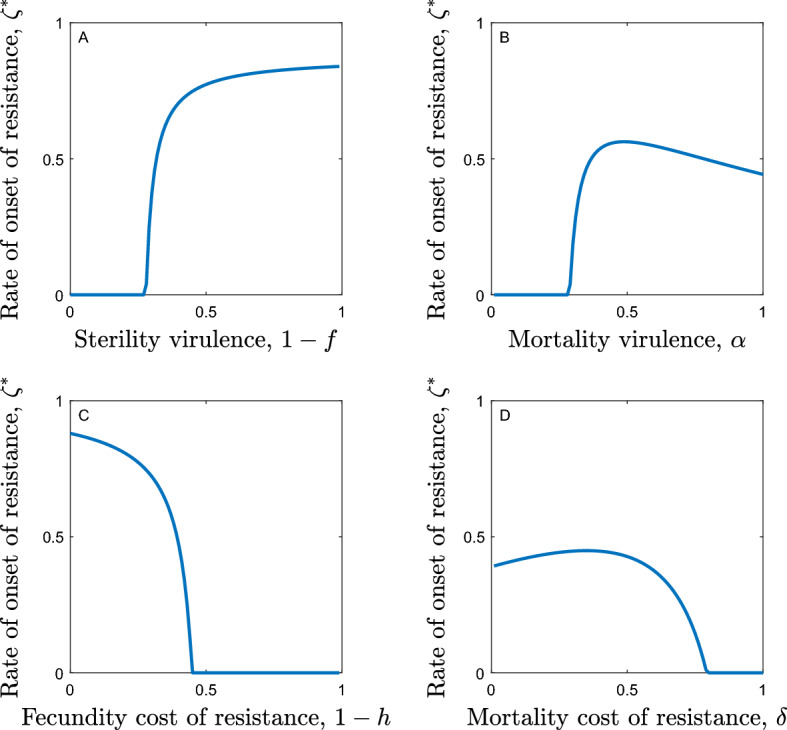
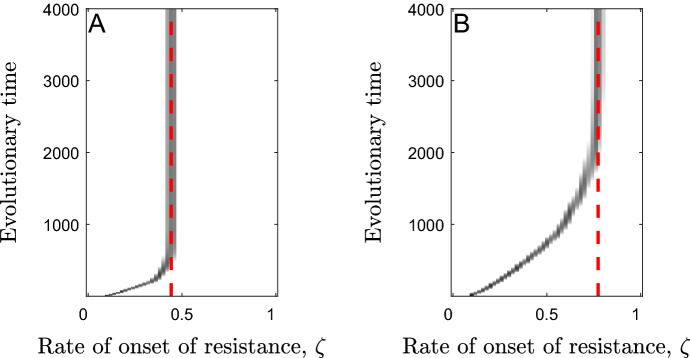
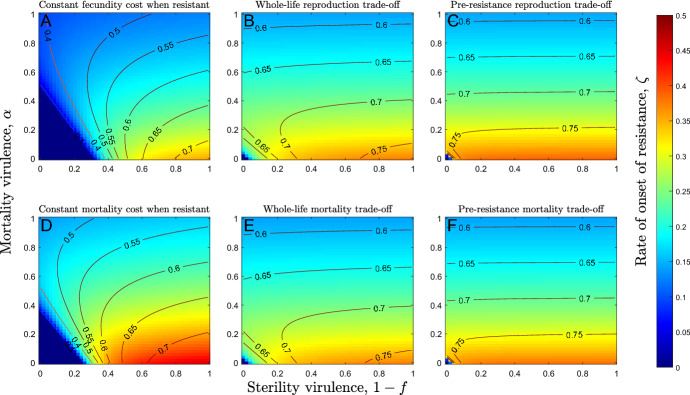
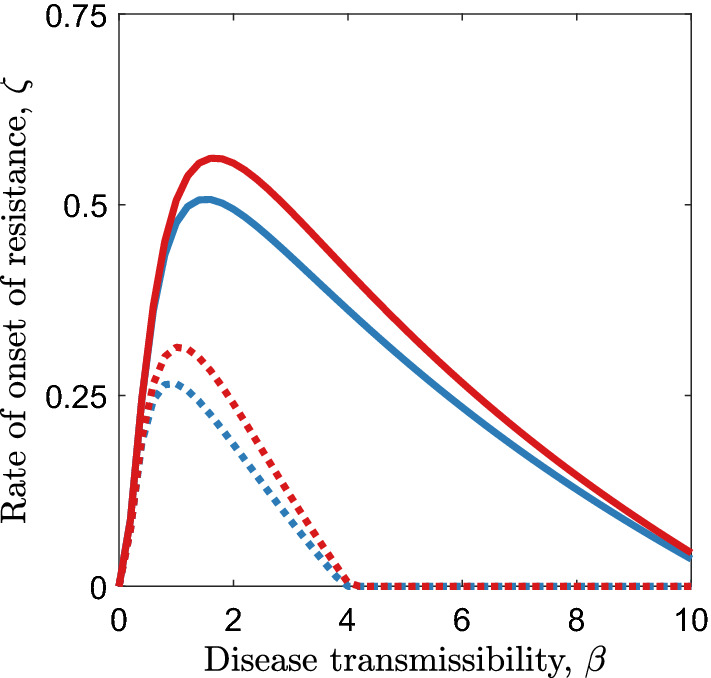
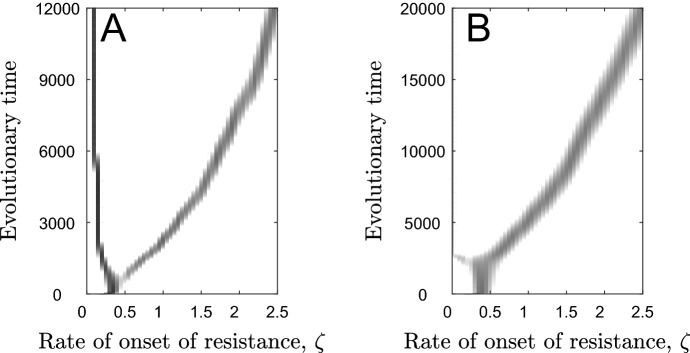
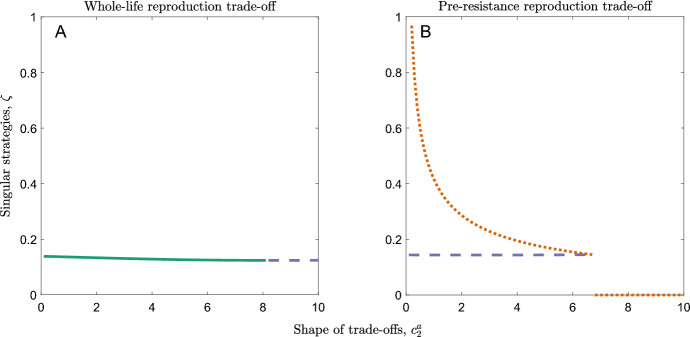
Many organisms experience an increase in disease resistance as they age, but the time of life at which this change occurs varies. Increases in resistance are partially due to prior exposure and physiological constraints, but these cannot fully explain the observed patterns of age-related resistance. An alternative explanation is that developing resistance at an earlier age incurs costs to other life-history traits. Here, we explore how trade-offs with host reproduction or mortality affect the evolution of the onset of resistance, depending on when during the host's life cycle the costs are paid (only when resistance is developing, only when resistant or throughout the lifetime). We find that the timing of the costs is crucial to determining evolutionary outcomes, often making the difference between resistance developing at an early or late age. Accurate modelling of biological systems therefore relies on knowing not only the shape of trade-offs but also when they take effect. We also find that the evolution of the rate of onset of resistance can result in evolutionary branching. This provides an alternative, possible evolutionary history of populations which are dimorphic in disease resistance, where the rate of onset of resistance has diversified rather than the level of resistance.
Keywords: Adult; Juvenile; Parasite; Pathogen; Resistance; Susceptibility.
© 2023. The Author(s).
Figures
Similar articles
-
The evolution of age-specific resistance to infectious disease.Proc Biol Sci. 2023 Jan 25;290(1991):20222000. doi: 10.1098/rspb.2022.2000. Epub 2023 Jan 25. Proc Biol Sci. 2023. PMID: 36695037 Free PMC article.
-
The evolution of juvenile susceptibility to infectious disease.Proc Biol Sci. 2018 Jun 27;285(1881):20180844. doi: 10.1098/rspb.2018.0844. Proc Biol Sci. 2018. PMID: 29925619 Free PMC article.
-
Vector-Borne Pathogen and Host Evolution in a Structured Immuno-Epidemiological System.Bull Math Biol. 2017 Feb;79(2):325-355. doi: 10.1007/s11538-016-0239-0. Epub 2016 Dec 28. Bull Math Biol. 2017. PMID: 28032207
-
The evolution of growth trajectories: what limits growth rate?Biol Rev Camb Philos Soc. 2011 Feb;86(1):97-116. doi: 10.1111/j.1469-185X.2010.00136.x. Biol Rev Camb Philos Soc. 2011. PMID: 20394607 Review.
-
The roles of the immune system in women's reproduction: evolutionary constraints and life history trade-offs.Am J Phys Anthropol. 2011;146 Suppl 53:134-54. doi: 10.1002/ajpa.21621. Am J Phys Anthropol. 2011. PMID: 22101690 Review.
Cited by
-
Disease resistance is more costly at younger ages: An explanation for the maintenance of juvenile susceptibility in a wild plant.Proc Natl Acad Sci U S A. 2025 Apr 8;122(14):e2419192122. doi: 10.1073/pnas.2419192122. Epub 2025 Apr 4. Proc Natl Acad Sci U S A. 2025. PMID: 40184176
-
Coevolution of Age-Structured Tolerance and Virulence.Bull Math Biol. 2024 Apr 25;86(6):62. doi: 10.1007/s11538-024-01292-2. Bull Math Biol. 2024. PMID: 38662120 Free PMC article.
References
-
- Altizer S, Davis AK, Cook KC, Cherry JJ. Age, sex, and season affect the risk of mycoplasmal conjunctivitis in a southeastern house finch population. Can J Zool. 2004;82:755–763. doi: 10.1139/Z04-050. - DOI
-
- Antonovics J, Thrall PH. The cost of resistance and the maintenance of genetic polymorphism in host-pathogen systems. Proc R Soc B. 1994;257:105–110. doi: 10.1098/rspb.1994.0101. - DOI
Publication types
MeSH terms
LinkOut - more resources
Full Text Sources
Medical
