

Effects of hyperventilation on oxygenation, apnea breaking points, diving response, and spleen contraction during serial static apneas
- PMID: 37060440
- PMCID: PMC10363065
- DOI: 10.1007/s00421-023-05202-7
Effects of hyperventilation on oxygenation, apnea breaking points, diving response, and spleen contraction during serial static apneas
Abstract
Purpose: Hyperventilation is considered a major risk factor for hypoxic blackout during breath-hold diving, as it delays the apnea breaking point. However, little is known about how it affects oxygenation, the diving response, and spleen contraction during serial breath-holding.
Methods: 18 volunteers with little or no experience in freediving performed two series of 5 apneas with cold facial immersion to maximal duration at 2-min intervals. In one series, apnea was preceded by normal breathing and in the other by 15 s of hyperventilation. End-tidal oxygen and end-tidal carbon dioxide were measured before and after every apnea, and peripheral oxygen saturation, heart rate, breathing movements, and skin blood flow were measured continuously. Spleen dimensions were measured every 15 s.
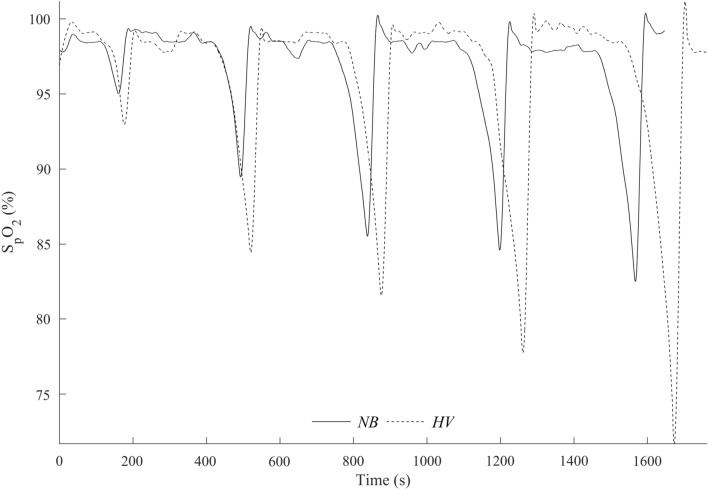
Results: Apnea duration was longer after hyperventilation (133 vs 111 s). Hyperventilation reduced pre-apnea end-tidal CO2 (17.4 vs 29.0 mmHg) and post-apnea end-tidal CO2 (38.5 vs 40.3 mmHg), and delayed onset of involuntary breathing movements (112 vs 89 s). End-tidal O2 after apnea was lower in the hyperventilation trial (83.4 vs 89.4 mmHg) and so was the peripheral oxygen saturation nadir after apnea (90.6 vs 93.6%). During hyperventilation, the nadir peripheral oxygen saturation was lower in the last apnea than in the first (94.0% vs 86.7%). There were no differences in diving response or spleen volume reduction between conditions or across series.
Conclusions: Serial apneas revealed a previously undescribed aspect of hyperventilation; a progressively increased desaturation across the series, not observed after normal breathing and could heighten the risk of a blackout.
Keywords: Blackout; Breath-hold diving; Hypocapnia; Hypoxia.
© 2023. The Author(s).
Conflict of interest statement
The authors of this manuscript report no conflict of interest. This manuscript has been approved by all the authors.
Figures


Similar articles
-
Effects of hyperventilation on repeated breath-holding while in a fasting state: do risks outweigh the benefits?Am J Physiol Regul Integr Comp Physiol. 2024 Apr 1;326(4):R319-R329. doi: 10.1152/ajpregu.00260.2023. Epub 2024 Feb 5. Am J Physiol Regul Integr Comp Physiol. 2024. PMID: 38314699 Free PMC article.
-
Progressive changes of oxygenation, diving response, and involuntary breathing movements during repeated apneas.Respir Physiol Neurobiol. 2025 Aug-Sep;336:104455. doi: 10.1016/j.resp.2025.104455. Epub 2025 Jun 5. Respir Physiol Neurobiol. 2025. PMID: 40482793
-
Effect of hypercapnia on spleen-related haemoglobin increase during apnea.Diving Hyperb Med. 2012 Mar;42(1):4-9. Diving Hyperb Med. 2012. PMID: 22437969
-
[Breath-hold diving--an increasing adventure sport with medical risks].Lakartidningen. 2004 Feb 26;101(9):787-90. Lakartidningen. 2004. PMID: 15045843 Review. Swedish.
-
Breath-Hold Diving.Compr Physiol. 2018 Mar 25;8(2):585-630. doi: 10.1002/cphy.c160008. Compr Physiol. 2018. PMID: 29687909 Review.
Cited by
-
Influence of hypercapnia and hypercapnic hypoxia on the heart rate response to apnea.Physiol Rep. 2024 Jun;12(11):e16054. doi: 10.14814/phy2.16054. Physiol Rep. 2024. PMID: 38872580 Free PMC article.
-
Factors Affecting Voluntary Breath-Holding Duration and Breaking Point in Young Adults.Ethiop J Health Sci. 2024 May;34(3):221-228. doi: 10.4314/ejhs.v34i3.7. Ethiop J Health Sci. 2024. PMID: 40438452 Free PMC article.
-
Toward a hyperventilation detection system in freediving: a proof of concept using force sensor technology.Front Physiol. 2025 Jan 6;15:1498399. doi: 10.3389/fphys.2024.1498399. eCollection 2024. Front Physiol. 2025. PMID: 39835203 Free PMC article.
-
The Effect of Static Apnea Diving Training on the Physiological Parameters of People with a Sports Orientation and Sedentary Participants: A Pilot Study.Sports (Basel). 2024 May 22;12(6):140. doi: 10.3390/sports12060140. Sports (Basel). 2024. PMID: 38921834 Free PMC article.
-
Effects of hyperventilation on repeated breath-holding while in a fasting state: do risks outweigh the benefits?Am J Physiol Regul Integr Comp Physiol. 2024 Apr 1;326(4):R319-R329. doi: 10.1152/ajpregu.00260.2023. Epub 2024 Feb 5. Am J Physiol Regul Integr Comp Physiol. 2024. PMID: 38314699 Free PMC article.
References
MeSH terms
Substances
LinkOut - more resources
Full Text Sources
